MEMBERS ONLY

HOUSING STOCKS FALL AS BOND YIELDS JUMP -- S&P 500 SLIPS BELOW 50-DAY AVERAGE

by John Murphy,
Chief Technical Analyst, StockCharts.com
HOMEBUILDERS DRAG MARKET DOWN ... A weaker-than-expected report on home sales for the month of December is causing heavy selling in homebuilding stocks. That in turn is helping to pull down the rest of the market which is in a weak technical condition to begin with. From a charting...
READ MORE
MEMBERS ONLY

LOW VOLUME BOUNCE NOT THAT IMPRESSIVE -- SHORT-TERM INDICATORS ARE STILL NEGATIVE -- SPY RUNS INTO SELLING AT FRIDAY'S LOW
by John Murphy,
Chief Technical Analyst, StockCharts.com
DOW AND NASDAQ ETFS ARE STILL BELOW 50-DAY LINES... The modest price bounce of the last two days has done little to reverse the downside momentum created by last week's high-volume price drop. For one thing, this week's bounce has been on relatively light...
READ MORE
MEMBERS ONLY
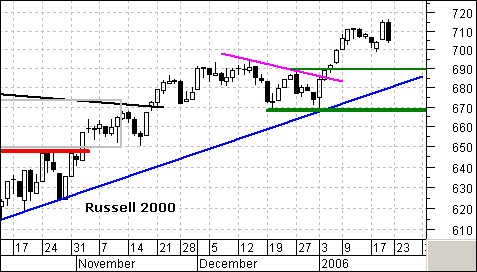
DOW LEADS THE WAY LOWER
Wall Street took a pounding on Friday and the Dow took the biggest technical beating of all the major indices. The Nasdaq, S&P 500 and Russell 2000 all remain above their 3-Jan lows, but the Dow broke below its 3-Jan low. This shows relative weakness and...
READ MORE
MEMBERS ONLY
UNDERMINING GOLD
While mining gold has become very profitable, there are many signs that future prices are being undermined. For example, our first chart shows total assets and cash flow for Rydex Precious Metals Fund. While assets have risen along with price, cash flow (the bottom panel on the chart) reflects that...
READ MORE
MEMBERS ONLY
SHARPCHARTS2 BETA 7 ARRIVES FEB. 1st!
SHARPCHARTS2 BETA 7 DUE OUT ON FEBRUARY 1st! We continue to work feverishly here at StockCharts getting the final "Beta" version of our new SharpCharts2 charting tool ready for its February 1st debut. Here are just some of the changes that we think will dazzle you:
* No more...
READ MORE
MEMBERS ONLY
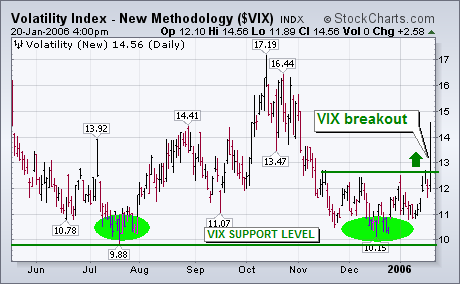
VIX TURNS UP -- S&P TURNS DOWN
A week ago Thursday I wrote a message entitled: "Low Volatility (VIX) Index May Increase Market Risk in 2006 -- S&P 500 Pulls Back From Overbought Condition" (January 12, 2006). The next two charts are updates of the ones shown at that time. I was concerned that...
READ MORE
MEMBERS ONLY
Hello Fellow ChartWatchers!
Jitters have crept back into the stock market with last Friday's big drop in the major averages. In addition to breaking the Dow's low from the start of the year, Friday's selloff ended with the first close below the 50-day moving average since...
READ MORE
MEMBERS ONLY

MARKET SELLS OFF ON BIG VOLUME -- DOW AND NASDAQ 100 BREAK 50-DAY LINES -- VIX TURNS UP WHILE S&P GIVES SELL SIGNALS
by John Murphy,
Chief Technical Analyst, StockCharts.com
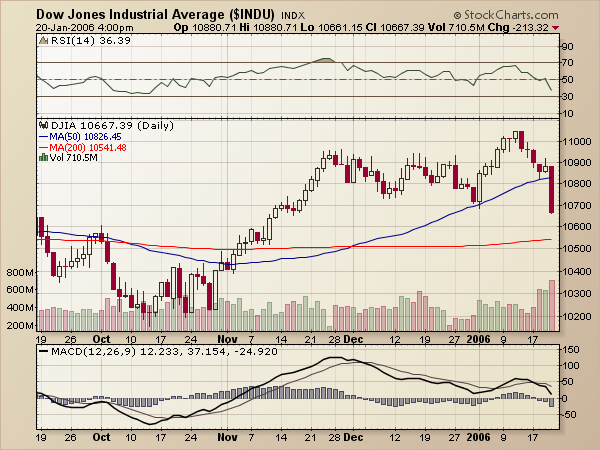
DOW DIAMONDS BREAK 50-DAY LINE AND DECEMBER LOW ... Thanks mainly to a huge plunge in Citigroup and General Electric, the Dow Industrials had a terrible chart day. Chart 1 shows the Dow Diamonds (DIA) shattering its 50-day moving average and falling to the lowest level in more than...
READ MORE
MEMBERS ONLY

PLUNGE IN CITIGROUP AND GE PUSH DOW BELOW 50-DAY AVERAGE -- MACD LINES WEAKEN FOR THE NASDAQ AND THE S&P 500
by John Murphy,
Chief Technical Analyst, StockCharts.com
DOW BREAKS 50-DAY LINE ... The Dow is the first of the major stock indexes to break its 50-day moving average. If that pattern continues through the balance of the day, it would be the first legitimate sell signal since last October. Although the Nasdaq and the S&...
READ MORE
MEMBERS ONLY

CHIPS LEAD MARKET AS SMH BOUNCES OFF 50-DAY LINE -- TRANSPORTS LEAD DOW COMPLEX HIGHER -- JAPAN AND GOLD RECOVER -- HOW TO USE PARABOLIC STOPS ON GOLD
by John Murphy,
Chief Technical Analyst, StockCharts.com
SOX CLIMBS 3.4% AND BOOSTS SMH ... Last evening I suggested that the ability of the Semiconductor (SOX) Index to end in positive territory after early selling was a positive sign. That positive tone has carried into today's trading in a big way. Thanks to good news from...
READ MORE
MEMBERS ONLY

INTEL PLUNGE WEIGHS ON SMH -- TOKYO LEADS ASIA LOWER -- GOLD IS ALSO SLIPPING FROM OVERBOUGHT CONDITION -- MAJOR INDEXES TEST MOVING AVERAGE LINES
by John Murphy,
Chief Technical Analyst, StockCharts.com
INTEL IS BIGGEST STOCK IN THE SMH ... Today's plunge in Intel has been devastating to its chart pattern. Chart 1 shows the chip and technology bellwether plunging nearly 3 points (-12%) on very heavy volume. The stock is now threatening its fourth quarter low. That helped make the...
READ MORE
MEMBERS ONLY

OVERBOUGHT MARKET CORRECTS AS VIX JUMPS -- CRUDE OIL CRACKS $65 AS XLE HITS NEW RECORD -- JAPAN CORRECTS
by John Murphy,
Chief Technical Analyst, StockCharts.com
CRUDE TOPS $65 -- XLE HITS RECORD HIGH ... Crude oil continues to climb after recently breaking through its mid-December peak at 62. That upside breakout signaled that the downside correction starting in early September had been completed and that its intermediate trend had turned higher. Rising crude prices are good...
READ MORE
MEMBERS ONLY

US DOLLAR THREATENS ITS 200-DAY AVERAGE -- CANADIAN MARKET BENEFITS FROM STRONG CURRENCY AND RISING COMMODITIES
by John Murphy,
Chief Technical Analyst, StockCharts.com
DOLLAR TREND CONTINUES TO WEAKEN ... The weekly chart of the U.S. Dollar Index shows that the 2005 rally stopped at the spring 2005 peak just above 92. At the same time, the weekly MACD lines have "double topped" and turned negative. The USD has also broken an...
READ MORE
MEMBERS ONLY

LOW VOLATILITY (VIX) INDEX MAY INCREASE MARKET RISK IN 2006 -- S&P 500 PULLS BACK FROM OVERBOUGHT CONDITION
by John Murphy,
Chief Technical Analyst, StockCharts.com
VIX AT LOWEST LEVEL IN A DECADE... Despite the market's getting off to a strong start in the new year, I've maintained a generally cautious view on the market's long-term trend. Part of that is based on the length of this bull market...
READ MORE
MEMBERS ONLY

NYSE ADVANCE-DECLINE LINE HITS NEW HIGH -- DOW CLOSES OVER 11K FOR SECOND DAY -- TRACKING 50-DAY AVERAGES ON STOCKCHARTS
by John Murphy,
Chief Technical Analyst, StockCharts.com
ADVANCE-DECLINE LINE HITS NEW HIGH ... Back in December I expressed concern about the fact that the NYSE Advance-Decline line remained beneath its August/September highs which was creating a "negative divergence" with the NYSE and S&P 500 indexes which had broken through those highs...
READ MORE
MEMBERS ONLY
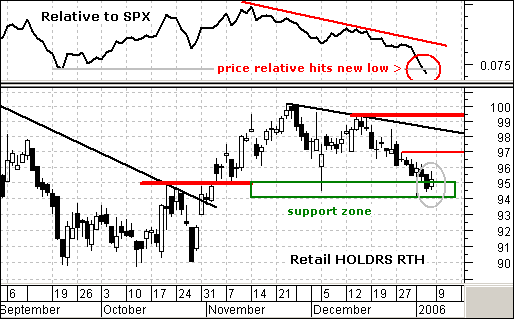
RETAIL HOLDRS HAVE YET TO RECOVER
Despite a strong start in the S&P 500 this year, the Retail HOLDRS (RTH) remains under pressure and is lagging the overall market. This is not a good sign for the industry group or the Consumer Discretionary sector, which is heavily weighted towards retail stocks. In addition, retail...
READ MORE
MEMBERS ONLY
2006 ASSESSMENT
I am often asked to make an annual forecast, and I frequently oblige, but this year I'd like to take a different approach. Rather than making a "forecast," let's make an assessment of some significant factors that will be affecting market progress in 2006....
READ MORE
MEMBERS ONLY
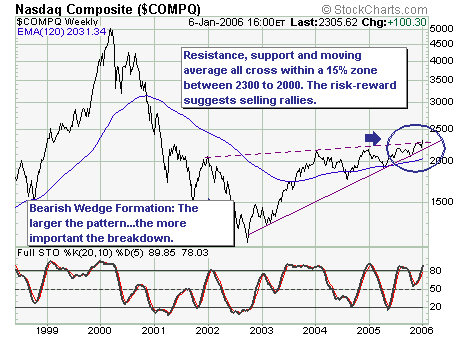
FALSE BREAKOUTS AHEAD?
The first 4-days of US trading has shown nothing but gains; and we believe that this "euphoria" is providing an upcoming opportunity to be come short the technology sector as a whole. Allow us to explain:
Using the weekly NASDAQ Composite chart, the rally off the low...
READ MORE
MEMBERS ONLY
BETA 7, FUND DISTRIBUTIONS, YIELD DATA
SHARPCHARTS 2 BETA 7 TO LAUNCH ON FEBRUARY 1ST - As we mentioned above, the next version of our SharpCharts2 charting tool will appear on February 1st. This version of SharpCharts will give you greater control over your charts and overlays and will allow members to save charts into their accounts....
READ MORE
MEMBERS ONLY
CONCENTRATING ON STRENGTH
The market is starting the new year with a bang. Virtually all of the major market averages have risen to new 52-week highs. Some of that new optimism is the result of the Fed minutes released earlier in the week hinting that it might be close to ending its...
READ MORE
MEMBERS ONLY
Hello Fellow ChartWatchers!
Wow! Six years into the new millennium already - and into StockCharts.com's seventh year of existence! Last year was our strongest year ever as we continued to expand our site and our subscribership. This year looks even brighter with the upcoming release of SharpCharts2 and our long-awaited...
READ MORE
MEMBERS ONLY

EARLY 2006 LEADERSHIP FAVORS GOLD, OIL, AND CHIPS -- NEXT UPSIDE TARGET FOR S&P IS 1315 -- WAYS TO DEAL WITH CURRENT MARKET
by John Murphy,
Chief Technical Analyst, StockCharts.com
CONCENTRATING ON STRENGTH ... The market is starting the new year with a bang. Virtually all of the major market averages have risen to new 52-week highs. Some of that new optimism is the result of the Fed minutes released earlier in the week hinting that it might be close...
READ MORE
MEMBERS ONLY

SEMICONDUCTOR BUYING BOOSTS TAIWAN ETF WHICH IS DAY'S STRONGEST FOREIGN MARKET -- TAIWAN SEMICONDUCTOR IS BREAKING OUT
by John Murphy,
Chief Technical Analyst, StockCharts.com
TAIWAN AND SEMICONDUCTOR ISHARES ARE DAY'S LEADERS ... As you've probably figured out by now, I try to look for meaningful linkages behind the day's headlines and the movements in various markets. One such linkage is evident in today's trading. Domestically, the day&...
READ MORE
MEMBERS ONLY

FED MINUTES WEAKEN DOLLAR -- THAT'S GOOD FOR GOLD AND FOREIGN MARKETS
by John Murphy,
Chief Technical Analyst, StockCharts.com
DOLLAR WEEKLY CHART LOOKS TOPPY ... In writing about the drop in the U.S. dollar yesterday I mentioned that its weekly chart also looked toppy. I was referring to the chart that I showed back in mid-December accompanied by the headline: "Record Trade Deficit Weakens Dollar at Major...
READ MORE
MEMBERS ONLY

FED MINUTES SPARK RALLY AS MARKET INDEXES BOUNCE OFF 50-DAY LINES -- FALLING DOLLAR AND SURGE COMMODITIES SUGGEST INFLATION BATTLE IS FAR FROM OVER
by John Murphy,
Chief Technical Analyst, StockCharts.com
2:00 RELEASE BOOSTS MARKET ... The minutes of the Fed's December meeting carried wording that future rate hikes would probably not be large and that inflation pressures were well contained. That hint that the Fed might be near the end of their tightening campaign turned what had been...
READ MORE
MEMBERS ONLY

MONEY FLOWS INTO COMMODITY STOCKS AS DOLLAR WEAKENS -- CANADA IS GAINING FROM RISING CURRENCY AND COMMODITY PRICES
by John Murphy,
Chief Technical Analyst, StockCharts.com
OIL CLIMBS OVER $63... Crude oil (and most other commodities) are starting the new year on a strong note. Crude oil is climbing more than $2 and is trading over $63 for the first time in more than two months. Gold is trading $11 higher while the CRB Index is...
READ MORE
MEMBERS ONLY

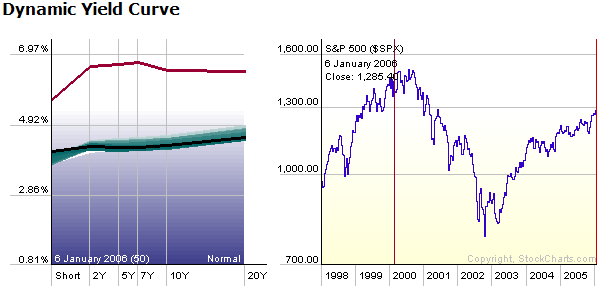
THIS TIME THE YIELD CURVE MAY NOT MEAN AS MUCH -- WHY JAPAN IS A GOOD GLOBAL VALUE -- NEW JAPANESE LEADERSHIP MAY BE SIGNALLING SHIFT TO GLOBAL INFLATION
by John Murphy,
Chief Technical Analyst, StockCharts.com
REPEATS OF EARLIER MESSAGES... Yesterday I presented a long-term bullish case for the gold market. Today I'm going to try to do the same for Japan. First of all, I have to remind some newer readers that my bullish attitude on Japan isn't new. I...
READ MORE
MEMBERS ONLY

LONGER-TERM TRENDS CONTINUE TO FAVOR GOLD ASSETS AND JAPAN
by John Murphy,
Chief Technical Analyst, StockCharts.com
LONG-TERM TREND NOW FAVORS GOLD ... I've written articles about why I'm a long-term bull on gold, but I thought it worth revisiting as we approach the end of the year. Gold is also my favorite stock group for the coming year. Chart 1 is...
READ MORE
MEMBERS ONLY

MARKET STARTS LAST WEEK OF 2005 ON WEAK NOTE -- WORRIES OVER NEGATIVE YIELD CURVE
by John Murphy,
Chief Technical Analyst, StockCharts.com
THERE MAY BE NO SANTA CLAUS THIS YEAR ... In case you're confused about what the traditional Santa Claus rally is, it's the tendency for the market to rise in the week between Christmas and New Years. Judging from today's selling in stocks, there'...
READ MORE
MEMBERS ONLY

DECEMBER LEADERSHIP SHOW CAUTIOUS MARKET -- DRUGS HAVE STRONG WEEK -- HEALTHCARE ETF NEAR RECORD HIGH
by John Murphy,
Chief Technical Analyst, StockCharts.com
JOHN'S LATEST PERFORMANCE CHART ... John's Latest Performance Chart ranks the best and worst groups over the last month. Basic materials, gold, and oil service stocks have benefited from firmer commodity prices. Other sector leaders include healthcare, utilities, and consumer staples. It's worth noting that...
READ MORE
MEMBERS ONLY

GOLD SLIPS BELOW $500 -- NASDAQ IS LOSING LEADERSHIP -- MORE NYSE LOWS THAN HIGHS
by John Murphy,
Chief Technical Analyst, StockCharts.com
HEADED TOWARD LOWER BAND... The price of gold fell $7.85 today to close below $500 for the first time in a month. Chart 1 shows the recent chart action for the Gold Trust Shares (GLD). It closed at $49 today which is the equivalent of $490 for bullion. The...
READ MORE
MEMBERS ONLY

NYSE ADVANCE-DECLINE LINE SHOWS FIRST NEGATIVE DIVERGENCE IN THREE YEARS -- NEW HIGH-NEW LOW LINE IS ALSO DROPPING -- WHY CHRISTMAS MAY BE A GOOD TIME TO DO SOME STOCK TRIMMING
by John Murphy,
Chief Technical Analyst, StockCharts.com
NYSE ADVANCE DECLINE HASN'T HIT A NEW HIGH ... Like most other market analysts, I've been expecting the traditional fourth quarter market rally. On Tuesday, after the Fed hinted that it might be nearing the end of its rate-hiking, I wrote that the two-week correction/...
READ MORE
MEMBERS ONLY

RECORD TRADE DEFICIT WEAKENS DOLLAR AT MAJOR RESISTANCE BARRIER -- GOLD WEAKENS WHILE JAPANESE YEN IS JUMPING
by John Murphy,
Chief Technical Analyst, StockCharts.com
GOLD PULLS BACK WHILE YEN JUMPS ... On Monday I revisited the positive relationship between gold and the Japanese market. I suggested that both still looked overbought to me, but would probably need to correct together. Gold started its downturn yesterday which has continued today. Chart 1 shows the Gold Trust...
READ MORE
MEMBERS ONLY

MARKET LIKES CHANGE IN FED WORDING AND APPEARS READY TO RESUME DECEMBER RALLY
by John Murphy,
Chief Technical Analyst, StockCharts.com
FED DROPS REFERENCE TO ACCOMODATION ... The Fed raised short-term rates another quarter point today to 4.25% as expected. However, it dropped its reference to "policy accommodation". The market took that to mean that the Fed may be nearing the end of its tightening cycle. Whether that&...
READ MORE
MEMBERS ONLY

GOLD AND JAPAN HIT NEW HIGHS -- THEY'RE STILL CLOSELY CORRELATED
by John Murphy,
Chief Technical Analyst, StockCharts.com
NEITHER ONE HAS CORRECTED ... A couple of weeks ago I expressed some concern that gold prices might stall or pullback temporarily from long-term supply around $500. Obviously, that didn't happen. Gold has since jumped another $40 to a new 24-year high. It was up over $10...
READ MORE
MEMBERS ONLY
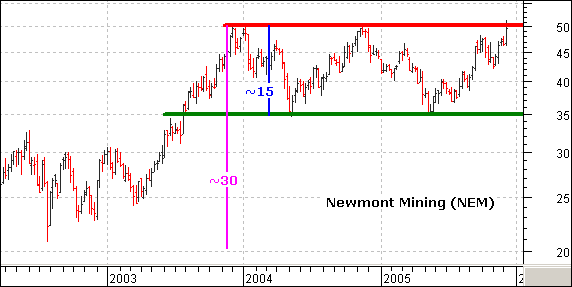
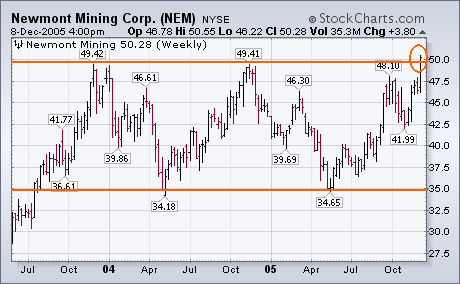
NEWMONT (NEM) FORMS THE MOTHER OF ALL CONSOLIDATIONS
Since NEM first broke above 35, gold has advanced from below 400 to above 500. However, NEM remains stuck in a long-term trading range. Did NEM secretly hedge production? Probably not, but the stock is not keeping up with gold, which broke above its 2003 and 2004 highs.
NEM...
READ MORE
MEMBERS ONLY
GOLD HITS $500 AND RESISTANCE
On December 1 New York spot gold closed at $502.30, slightly exceeding a target long awaited by gold bugs, but $500 is also a level we technicians have for a long time identified as a long-term resistance level. Could it be that the cyclical bull market in gold...
READ MORE
MEMBERS ONLY
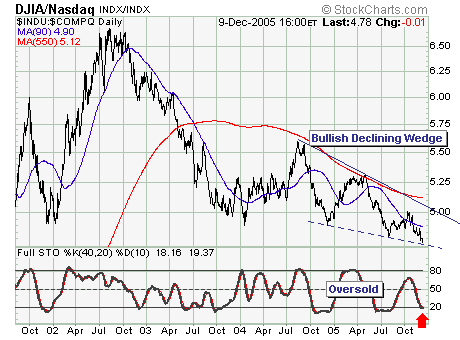
TOPS AHEAD FOR DEC/JAN?
The December to mid-January time frame has produced a number of rather large and tradable tops throughout history; and it is our belief the probability favors just such a top developing given the current overbought momentum readings. That said, we also note that the declining Dow Industrials-Nasdaq Composite...
READ MORE
MEMBERS ONLY
GOLD STOCKS BREAK OUT
Gold bullion climbed over $5.00 today to end at $519 which is the highest level in twenty-four years. Gold has now exceeded its 1983 peak at $514. Despite my concerns about a possible pullback around the $500 area, bullion shows no signs of slowing down. That may be...
READ MORE
MEMBERS ONLY
Hello Fellow ChartWatchers!
Happy Holidays everyone! And welcome to the holiday edition of ChartWatchers. This special edition replaces our normal December issues and it contains several exciting announcements about the markets and StockCharts.com. Be sure to check out the Site News section for more on StockCharts including news about our holiday subscription...
READ MORE
