MEMBERS ONLY

MARKET PULLBACK CONTINUES -- ENERGY PRICES JUMP WHILE THE CHIPS FALL -- GOLD STOCKS BREAKOUT -- JAPAN MAY HAVE BEGUN OVERBOUGHT CORRECTION

by John Murphy,
Chief Technical Analyst, StockCharts.com
DOW LOSES MORE GROUND ... The market lost more ground today. The Dow Industrials fell 55 points to close at 10755. That puts it within 55 points of its summer highs near 10700. The market got hit with two negatives today. One was a sizeable pullback in semiconductors which had recently...
READ MORE
MEMBERS ONLY

OVERBOUGHT CONDITION WEIGHS ON MARKET -- ADX LINES TURN DOWN -- USING BOLLINGER BANDS TO FIND CHART SUPPORT
by John Murphy,
Chief Technical Analyst, StockCharts.com
DOW BACKS OFF FROM 11000 ... Chart 1 shows some chart reasons why the Dow Industrials are pulling back. First of all, the Dow reached its spring high (10984) in an overbought condition. That's seen in the 9-day RSI line (top of chart) which moved into overbought territory...
READ MORE
MEMBERS ONLY

SEMICONDUCTORS RESUME UPTREND -- APPLIED MATERIALS BREAKS OUT -- ASIAN ETFS BENEFIT FROM CHIP GAINS -- TAIWAN SEMICONDUCTOR NEARS BULLISH BREAKOUT
by John Murphy,
Chief Technical Analyst, StockCharts.com
SEMIS CONTINUE TO CLIMB ... The Semiconductor (SOX) Index is gaining more than 2% today to continue its uptrend and its recent market leadership. Chart 1 shows the SOX reaching a new 52-week high today. Just last week it broke through its summer high to achieve a bullish breakout. It&...
READ MORE
MEMBERS ONLY

BOND YIELDS ARE CLIMBING AGAIN -- BASIC MATERIALS ARE STARTING TO OUTPERFORM FINANCIALS -- RISING INFLATION AND RISING RATES COULD CAUSE 2006 PROBLEMS
by John Murphy,
Chief Technical Analyst, StockCharts.com
YIELDS ARE BOUNCING OFF SUMMER HIGHS... After pulling back during the month of November, bond yields are starting to climb again. More importantly, they're bouncing off the previous peaks hit during August. That's important in chart work because short-term pullbacks shouldn't fall below...
READ MORE
MEMBERS ONLY

DOW THEORY UPTREND STILL IN QUESTION -- NEW CHIP LEADERSHIP -- ENERGY PRICES MAY HAVE BOTTOMED -- JAPAN LOOKS OVERBOUGHT
by John Murphy,
Chief Technical Analyst, StockCharts.com
INDUSTRIALS STILL BELOW 2005 HIGH ... One of the oldest technical approaches is the Dow Theory. It simply holds that upside breakouts in either the Dow Industrials or the Dow Transports must be confirmed by the other to signal the start or the resumption of the major bull trend. In this...
READ MORE
MEMBERS ONLY

ECONOMIC OPTIMISM BOOSTS CYCLICALS -- STOCKS ARE RALLYING AT BONDS' EXPENSE -- CRB INDEX BOUNCES OFF 200-DAY LINE
by John Murphy,
Chief Technical Analyst, StockCharts.com
BUYING CYCLICALS ... On Tuesday I showed the Materials Select SPDR (XLB) breaking through its summer high to achieve a bullish breakout. Materials were today's second strongest group just behind energy. Although there may be some inflationary meaning behind the new buying in these stocks, there's a...
READ MORE
MEMBERS ONLY

SEMIS AND SMALL CAP BREAKOUTS GIVE NEW LIFE TO MARKET -- NIKKEI CLEARS 15,000 -- YES, THE HUI IS THE UNHEDGED GOLD INDEX
by John Murphy,
Chief Technical Analyst, StockCharts.com
SMALL CAP BREAKOUT ... Earlier in the week I suggested that the fourth quarter market advance was being stalled partially by the inability of small cap stocks to break through their summer highs. That inability is being corrected today. Charts 1 and 2 show the S&P 600 Small Cap...
READ MORE
MEMBERS ONLY

FOURTH QUARTER RALLY MAY BE READY FOR PAUSE AS MARKET LOOKS OVER-EXTENDED
by John Murphy,
Chief Technical Analyst, StockCharts.com
DOW IS OVER-EXTENDED ... Yesterday I wrote about the Dow Industrials running into some selling along its early 2005 peak just below 11,000. I also mentioned it being over-extended. That can be plainly see in the 9-day RSI line which is well into overbought territory over 70....
READ MORE
MEMBERS ONLY

STEEL LEADS STRONG MATERIAL SECTOR -- US STEEL NEARS BULLISH BREAKOUT -- NEWMONT MINING TESTS $48 AS GOLD TOUCHES $500
by John Murphy,
Chief Technical Analyst, StockCharts.com
MATERIALS SPDR TURNS UP ... Basic material stocks are the day's strongest sector. Chart 1 shows the XLB having already broken through its summer high to reach the highest level in seven months. The relative strength ratio, which peaked in March, has also bottomed. Most of today's...
READ MORE
MEMBERS ONLY

RETAILERS AND SMALL CAPS PULL MARKET LOWER -- DOW BACKS OFF FROM 11K -- OIL STOCKS WEAKEN -- GOLD NEARS $500
by John Murphy,
Chief Technical Analyst, StockCharts.com
HEAVY RETAIL SELLING... With the holiday shopping season upon us, all eyes are focused on retailers. For today at least, investors weren't impressed with what they've seen so far. As a result, the Retail Holders were one of the day's biggest losers. To make...
READ MORE
MEMBERS ONLY

DOLLAR IS UP AGAINST RESISTANCE AT SPRING 2004 HIGHS AND IS OVERBOUGHT -- INTEREST RATE DIFFERENTIALS MAY START SHIFTING AGAINST THE DOLLAR
by John Murphy,
Chief Technical Analyst, StockCharts.com
MONTHLY DOLLAR INDEX CHART ... To get a better idea of where the dollar stands in relation to its long-term trend, it's a good idea to start with the monthly chart. The monthly bars in Chart 1 show the Dollar Index peaking at the start of 2002 and...
READ MORE
MEMBERS ONLY

SOX NEARS BULLISH BREAKOUT -- MARKET SHRUGS OFF OIL BOUNCE -- WHEN BEING OVERBOUGHT MAY NOT MEAN MUCH
by John Murphy,
Chief Technical Analyst, StockCharts.com
SEMICONDUCTOR INDEX TESTING 2005 HIGHS ... After some hesitation earlier this morning owing to a jump in energy prices, the market moved into new ground this afternoon to resume its uptrend. A lot of the credit for the afternoon strength comes from the semiconductor group which was second only to energy...
READ MORE
MEMBERS ONLY

OIL IS BOUNCING OFF 200-DAY AVERAGE WHILE OIL STOCKS RALLY -- OIL SERVICE HOLDERS TEST RECENT HIGH -- CRB INDEX IS ALSO BOUNCING OFF ITS 200-DAY LINE
by John Murphy,
Chief Technical Analyst, StockCharts.com
CRUDE OIL BOUNCES OFF SUPPORT LINES... After losing more than 20% since the end of August, crude oil prices are starting to bounce off two lines of potential chart support. One is the horizontal line in Chart 1 which is drawn under the July lows. The other is the 200-...
READ MORE
MEMBERS ONLY
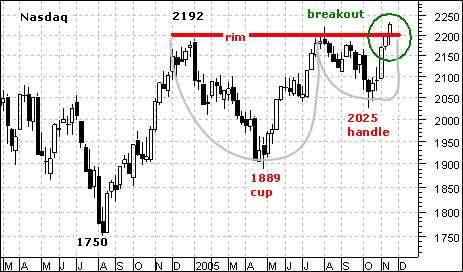
NASDAQ CUP-WITH-HANDLE BREAKOUT
The Nasdaq's breakout at 2200 confirms a bullish cup-with-handle pattern and targets a move to around 2500. Until there is evidence to the contrary, this is the dominant chart pattern and further gains should be expected.
William O'Neil of Investor's Business Daily...
READ MORE
MEMBERS ONLY
MARKET BECOMING OVERBOUGHT IN ALL TIME FRAMES
When a stock is above a moving average it is considered bullish, and the stock can be considered to be in a rising trend for that time frame. A good way to determine the market's overall condition (overbought/oversold) across a range of time frames is to analyze...
READ MORE
MEMBERS ONLY
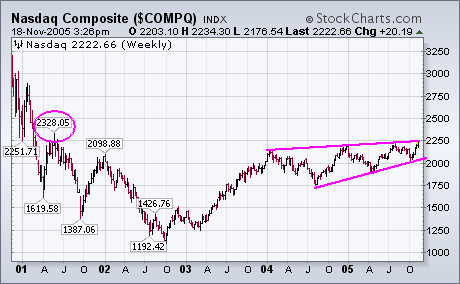
NASDAQ HITS FOUR-YEAR HIGH
The chart below shows the Nasdaq Composite having hit a new four-year high this week. It's now trading at the highest level since the spring of 2001. There's another shelf of potential resistance to watch at 2328 (see circle), but the action has been impressive....
READ MORE
MEMBERS ONLY
Hello Fellow ChartWatchers!
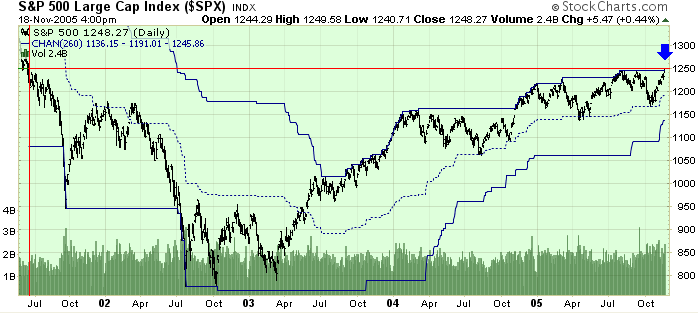
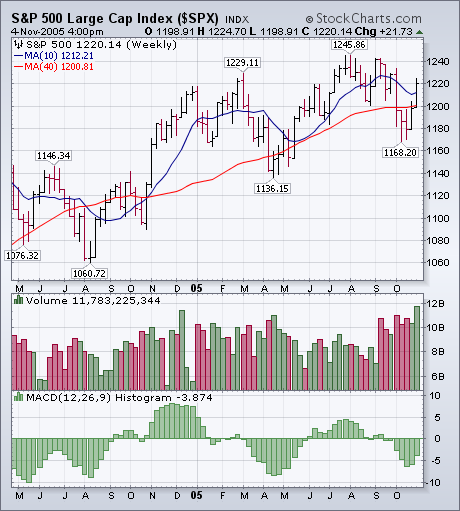
This week the markets have started pushing into bullish territory. John, Carl and Arthur all dig into these new events in more detail, but first let's have a look at the S&P 500 Index:
The blue arrow shows where the latest close, just below 1250, has...
READ MORE
MEMBERS ONLY

NASDAQ COMPOSITE: MAJOR BULLISH BREAKOUT OR RISING WEDGE?
by John Murphy,
Chief Technical Analyst, StockCharts.com
NASDAQ HITS FOUR-YEAR HIGH ... Chart 1 shows the Nasdaq Composite having hit a new four-year high this week. It's now trading at the highest level since the spring of 2001. There's another shelf of potential resistance to watch at 2328 (see circle), but the...
READ MORE
MEMBERS ONLY

YAHOO BREAKS OUT AND THE NASDAQ ISN'T FAR BEHIND -- WHY GOLD AND THE NIKKEI ARE BREAKING OUT TOGETHER -- WHY PULLBACK IN BOND YIELDS IS BOOSTING GOLD
by John Murphy,
Chief Technical Analyst, StockCharts.com
SHIFT FROM DEFLATION TO INFLATION ... Gold and the Japanese market are breaking out to new highs together. I don't think that's a coincidence. Back on September 29 I wrote an article entitled "New Japanese Leadership May Be Signaling Shift To Global Inflation" (September 29,...
READ MORE
MEMBERS ONLY

GOLD NEARS A NEW RECOVERY HIGH -- NEXT TARGET IS $500 -- GOLD STOCKS REASSERT MARKET LEADERSHIP
by John Murphy,
Chief Technical Analyst, StockCharts.com
GOLD SOARS $9.00... Gold prices have risen $9.00 today and are on the verge of a new multi-year high. That's putting a strong bid under gold stocks which are up 4% and the day's strongest stock group. Chart 1 shows the Gold ETF...
READ MORE
MEMBERS ONLY

FINANCIALS AND RETAILERS PULL OVERBOUGHT MARKET LOWER
by John Murphy,
Chief Technical Analyst, StockCharts.com
DOW AND S&P 500 PULL BACK FROM RESISTANCE ... Yesterday I wrote about some of the major market averages being up against chart resistance and in an overbought condition. That combination probably helped lead to today's profit-taking in the overall market. Chart 1 shows theDow Industrials...
READ MORE
MEMBERS ONLY

MARKET AVERAGES NEAR RESISTANCE BARRIERS AND ARE LOOKING OVERBOUGHT
by John Murphy,
Chief Technical Analyst, StockCharts.com
DOW INDUSTRIALS REACH 10700 BARRIER ... Some of the major market averages have reached important resistance levels which represents a moment of truth for the market. The Dow is a good example. It's trading over 10,700 today which puts it right up against the highs formed from July...
READ MORE
MEMBERS ONLY

WEAKNESS IN ENERGY CONTINUES ROTATION INTO AIRLINES, BANKS, AND RETAILERS -- FOURTH QUARTER RALLY CONTINUES -- WHERE WE ARE AFTER THAT
by John Murphy,
Chief Technical Analyst, StockCharts.com
ENERGY STOCKS SELLOFF ON WEAK OIL ... With crude oil falling to a three-month low, energy stocks are coming under heavy selling pressure. On Monday, I showed the Energy Sector SPDR (XLE) falling back below its 50-day moving average. It's fallen even further since then. Chart 1...
READ MORE
MEMBERS ONLY

HOMEBUILDERS WEIGH ON MARKET -- HOUSING INDEX PEAKED IN JULY -- DOUBLE TOP IN BOND PRICES SIGNALS END OF FIVE-YEAR HOUSING BOOM
by John Murphy,
Chief Technical Analyst, StockCharts.com
HOMEBUILDERS PEAKED IN JULY ... A negative forecast from Toll Brothers that housing demand was weakening pushed that stock and other homebuilders sharply lower today. In turn, that caused some profit-taking in the broader market. The idea that the housing sector might be peaking isn't new. If you...
READ MORE
MEMBERS ONLY

ENERGY SELLING BOOSTS MARKET -- INTEL AND CITIGROUP LEAD DOW -- ETF LEADERS INCLUDE JAPAN, RETAILERS, AND REGIONAL BANKS
by John Murphy,
Chief Technical Analyst, StockCharts.com
OIL BACK BELOW $60 AS ENERGY STOCKS FALL ... The price of crude oil fell $1.11 today to close back below the $60 level. Chart 1 shows, however, that crude is nearing its 200-day moving average at 57.39. It remains to be seen if that long-term support...
READ MORE
MEMBERS ONLY
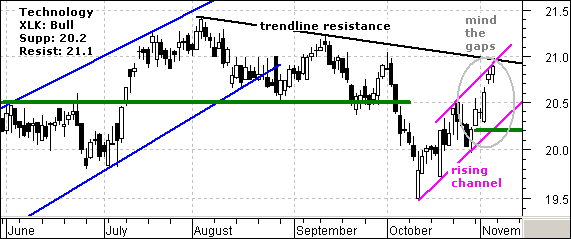
MIND THE GAPS
The Information Technology SPDR (XLK) broke support in early October, bottomed in mid October and surged over the last few weeks. This surge featured two gaps last week and these hold the key to recent strength. The stock gapped up on Monday and again on Thursday (gray oval). Gaps show...
READ MORE
MEMBERS ONLY
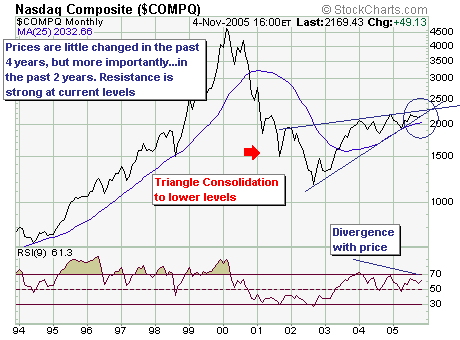
LOWER PRICES AHEAD FOR NASDAQ?
On a longer-term monthly basis, the Nasdaq Composite is very clearly forming a rather bearish "wedge" pattern. Resistance between 2080 and 2220 is quite strong, and rallies back into this zone are becoming weaker and weaker. Ultimately - and we think rather soon, this pattern will lead to...
READ MORE
MEMBERS ONLY
HURRICANE DONATIONS, CHARTSCHOOL UPDATE
OUR PROBLEMS ARE PUNY IN COMPARISON - While our weekend power problems were unusual, we realize that they were nothing compared to the problems faced by residents of the gulf coast in the aftermath of Hurricanes Katrina and Rita. For the past two months, StockCharts.com has pledged $5 of every...
READ MORE
MEMBERS ONLY
S&P TREND IMPROVES -- SOX REGAINS 200-DAY LINE
The weekly bars in Chart 1 show the improvement in the S&P 500 this past week. Not only did it close back over its (red) 40-week average, but it closed above its (blue) 10-week average as well. Even more impressive was the heavy upside volume. That...
READ MORE
MEMBERS ONLY
Hello Fellow ChartWatchers!
While last week was a really good week for the markets - Dow up 3%, Nasdaq up over 5% - it was a really lousy week for StockCharts.com. As most of you know, the site had problems creating charts on Thursday and again on Friday and then we were also down...
READ MORE
MEMBERS ONLY

DOLLAR BREAKOUT RESULTS FROM HIGHER INTEREST RATES, BUT PUTS DOWNSIDE PRESSURE ON COMMODITIES
by John Murphy,
Chief Technical Analyst, StockCharts.com
DOLLAR INDEX BREAKS SUMMER HIGH ... The U.S. Dollar broke through its summer high today and closed above 91 for the first time in eighteen months. The daily bars in Chart 1 show the short-term bullish breakout. The weekly bars in Chart 2 show that the USD is trading...
READ MORE
MEMBERS ONLY

TRANSPORTATION AVERAGE HITS ALL-TIME HIGH -- AIRLINES, BANKS, AND RETAILERS ARE TOP OCTOBER PERFORMERS -- NASDAQ ALSO SHOWS NEW LEADERSHIP
by John Murphy,
Chief Technical Analyst, StockCharts.com
TRANSPORTS HIT ALL-TIME HIGH ... I've written several times over the last few weeks about how the drop in energy prices during October was giving a big boost to the fuel-sensitive transportation stocks. With crude continuing to trade below $60, the Dow Transportation Average has broken through...
READ MORE
MEMBERS ONLY

GLOBAL MARKETS BOUNCE OFF 200-DAY LINES -- JAPANESE AND LATIN AMERICAN LEADERSHIP
by John Murphy,
Chief Technical Analyst, StockCharts.com
INTERNATIONAL STOCKS RISE... Following on the heels of Friday's strong stock market gains in the U.S., international stock markets opened the week on a powerful note. The major European stock markets gained about 2% while Japan did about the same. That got our market off to a...
READ MORE
MEMBERS ONLY

S&P 500 TESTING TOP OF SHORT-TERM TRADING RANGE -- A MOVING AVERAGE CROSSOVER SYSTEM -- ENERGY AND UTILITY BUYING HELPS STABILIZE MARKET
by John Murphy,
Chief Technical Analyst, StockCharts.com
NO CHANGE IN SHORT-TERM TREND... Last Friday I showed the S&P 500 trading between support at its 400-day (80-week) moving average (blue line) and resistance at the red 200-day (40-week) line. I also suggested that the S&P needed a decisive close...
READ MORE
MEMBERS ONLY

BOND YIELD SURGE TO SIX-MONTH HIGHS UNDERMINES MARKET BOUNCE -- ENERGY PRICES SELLOFF ON INVENTORY DATA
by John Murphy,
Chief Technical Analyst, StockCharts.com
NEW SIX MONTH HIGHS ... Long-term interest rates surged today in the T-bond and T-note markets. Charts 1 and 2 show the 10-year T-note (TNX) and the 30-year T-bond yield (TYX) surging to the highest levels in more than six months. This upward trend...
READ MORE
MEMBERS ONLY

OIL SERVICE LEADS ENERGY REBOUND AS CRUDE OIL APPEARS TO HAVE BOTTOMED -- THAT MAY HELP YEAREND BOUNCE
by John Murphy,
Chief Technical Analyst, StockCharts.com
OIL MAY HAVE BOTTOMED ... It looks like the fourth quarter correction in crude has probably ended. After dipping briefly below $60, crude oil jumped more than $2 yesterday and looks to have bottomed. The Commodity Channel (CCI) Index (on top of the chart) is turning up from oversold condition after...
READ MORE
MEMBERS ONLY

SHORT-TERM S&P INDICATORS IMPROVE -- TRANSPORTS SHOW LEADERSHIP -- ENERGY CORRECTION MAY BE NEARLY OVER
by John Murphy,
Chief Technical Analyst, StockCharts.com
TRANSPORTS HAVE ANOTHER STRONG DAY... On Friday I wrote that one of the places that any fourth quarter bounce would start would be the transports. That's because they're among the main beneficiaries of the recent slide in oil prices. [Earlier in the week I also listed...
READ MORE
MEMBERS ONLY

WATCHING S&P MOVING AVERAGE LINES -- NEGATIVE WEEKLY INDICATORS
by John Murphy,
Chief Technical Analyst, StockCharts.com
CAUGHT BETWEEN TWO LINES ... There's good and bad news on the daily S&P 500 bar chart. The bad news has to do with the fact that the S&P is still trading below its red 200-day moving average line. Although not every break of...
READ MORE
MEMBERS ONLY

TRANSPORTS BENEFIT FROM OIL SLIDE -- LEADERS ARE CNF, EXPD, AND LUV
by John Murphy,
Chief Technical Analyst, StockCharts.com
TRANSPORTS ARE SHOWING RESILIENCY... Earlier in the week I wrote that falling energy prices should benefit certain market groups more than others. I also suggested that any fourth quarter rally would most likely be led by financials (mainly banks), retailers, technology, and transports. I've already shown some early...
READ MORE
MEMBERS ONLY

JAPAN HOLDS UP THE BEST DURING OCTOBER ALTHOUGH YEN HAS BEEN FALLING -- JAPANESE MUTUAL FUND HOLDS UP OK
by John Murphy,
Chief Technical Analyst, StockCharts.com
JAPAN IS TOP OCTOBER MARKET ... A number of readers have asked for an update on the Japanese market. My October 11 message entitled "Why Japan is a Good Global Value" (October 11, 2005) showed the low correlation between Japan and the U.S. over the last fifteen years,...
READ MORE
