MEMBERS ONLY

MARKET BOUNCES ON DECENT VOLUME AND MAY HAVE MADE SHORT-TERM BOTTOM -- BANKS, INTERNET, AND RETAILERS LEAD RALLY -- GOLD CORRECTS

by John Murphy,
Chief Technical Analyst, StockCharts.com
OVERSOLD NYSE BOUNCES ON STRONG VOLUME... A lot has been written about the 200-day moving average lately. That's because a market that breaks that long-term support line -- and then stays below it -- can be in trouble. Several market indexes have broken that support line over the...
READ MORE
MEMBERS ONLY

ENERGY STOCKS REMAIN IN FOURTH QUARTER CORRECTION -- WHY THAT'S NOT NECESSARILY GOOD FOR THE STOCK MARKET
by John Murphy,
Chief Technical Analyst, StockCharts.com
OIL SERVICE HOLDERS STILL IN CORRECTION ... On September 14 I wrote an article showing that the energy sector had moved into a long-range overbought condition. That article, however, allowed for more short-term buying until the short-term trend also became overbought. On September 23, I wrote that oil...
READ MORE
MEMBERS ONLY

WHY LONG-TERM TREND FAVORS GOLD -- STOCKS IN LOW-VOLUME OVERSOLD BOUNCE
by John Murphy,
Chief Technical Analyst, StockCharts.com
WHY NEXT TARGET FOR GOLD IS $500 ... After reaching $700 in 1980, the price of gold fell for the next twenty years before hitting bottom at $250 in late 1998. Bullion started to rise in early 2002 and is close to doubling in price. One of the ways to arrive...
READ MORE
MEMBERS ONLY
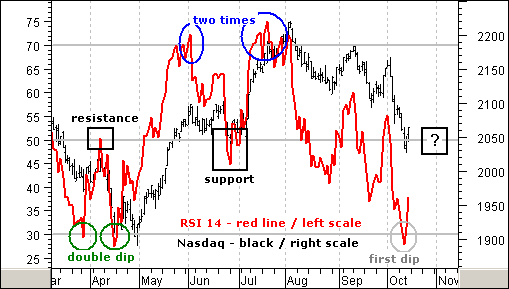
RSI AND THE NASDAQ
This week 14-day RSI for the Nasdaq became oversold (below 30) for the first time since April (gray oval). Even though securities can become oversold and remain oversold, the odds of a bounce increase with oversold conditions. The question is not whether there will be a bounce or not,...
READ MORE
MEMBERS ONLY
MARKET IS OVERSOLD AND DANGEROUS
The Price Momentum Oscillator (PMO) is an expression of internal strength for a given price index. In the chart above we summarize three important PMO characteristics for the individual stocks in the S&P 500 -- the percentage of PMOs rising (very short-term), the percentage of PMOs on crossover...
READ MORE
MEMBERS ONLY
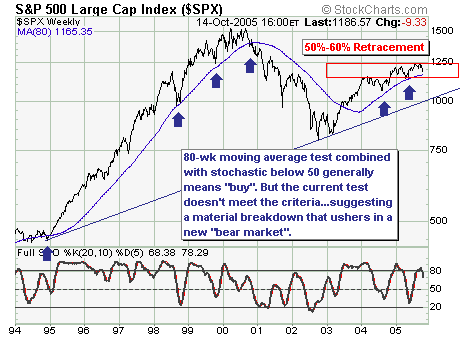
WEAKNESS AHEAD FOR THE S&P500?
Today, the simple technical picture is breaking down in our opinion. If we look back to 1994, we find the 80-week moving average has been an excellent swing trading tool as it holds the data as near perfect as can be expected. Our concern focuses upon the current decline...
READ MORE
MEMBERS ONLY
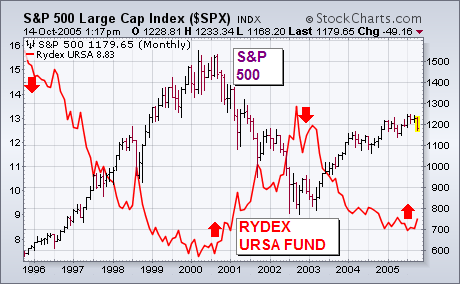
WHY BEAR FUNDS ARE TRADING VEHICLES
My Wednesday message on bear funds wrote that they should be used as trading vehicles and not as a long-term investment. One of our readers asked why. That's because the market has a history of rising more often that it falls. To hold a bear fund in...
READ MORE
MEMBERS ONLY
Hello Fellow ChartWatchers!
The markets are getting very interesting these days! Last week saw some big declines that were mostly erased by Friday's rally.
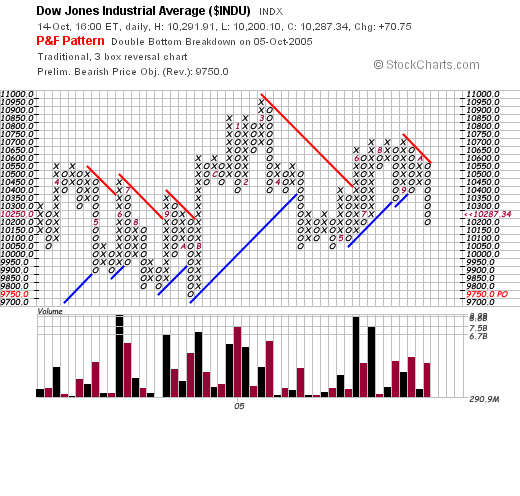
If you're looking for bearish signals, look no further than our Dow Jones Industrials Index P&F chart:
I draw your attention to the...
READ MORE
MEMBERS ONLY

NYSE BULLISH PERCENT INDEX TESTS IMPORTANT SUPPORT -- S&P 500 IS TESTING 80-WEEK AVERAGE WHICH IS STILL HOLDING -- WHY BEAR FUNDS SHOULDN'T BE USED AS A LONG-TERM INVESTMENT
by John Murphy,
Chief Technical Analyst, StockCharts.com
NYSE BULLISH PERCENT INDEX AT CRITICAL SUPPORT... I've been asked to update my views on the NYSE Bullish Percent Index (BPNYA). The BPNYA is the percent of stocks in the NYSE Index that are on point & figure buy signals. On September 26 I reported that the BPNYA...
READ MORE
MEMBERS ONLY

A LOOK AT SOME BEAR MARKET FUNDS
by John Murphy,
Chief Technical Analyst, StockCharts.com
INVERSE FUNDS ... One of our readers asked which indicators to use when analyzing bear mutual funds. The answer is to use the exact same indicators that we use in the stock market. Bear funds are simply inverse funds. They're designed to move in the opposite direction of the...
READ MORE
MEMBERS ONLY

REITS AND HOMEBUILDERS FALL BELOW 200-DAY LINES AS BOND YIELDS BREAKOUT
by John Murphy,
Chief Technical Analyst, StockCharts.com
BOND YIELDS EXCEED AUGUST HIGH... Yields on the 10-year T-note and the 30-Year T-bond closed over their August highs today. I've explained before that I'm focusing more on the 30-year bond because I believe that's where the most reliable...
READ MORE
MEMBERS ONLY

NASDAQ COMPOSITE CLOSES UNDER 200-DAY AVERAGE -- SELLING IN BIOTECHS, INTERNET, AND SEMICONDUCTORS WEAKENS MARKET
by John Murphy,
Chief Technical Analyst, StockCharts.com
BIOTECH AND INTERNET INDEXES BREAK 50-DAY LINES... Two former leadership groups in the Nasdaq market have undergone short-term trend damage. Chart 1 shows the Biotechnology Index (BTK) trading beneath its 50-day average for the last four trading days. Its relative strength line (versus the Nasdaq) is starting...
READ MORE
MEMBERS ONLY

WHY JAPAN IS A GOOD GLOBAL VALUE
by John Murphy,
Chief Technical Analyst, StockCharts.com
JAPAN CONTINUES TO LEAD GLOBAL MARKETS... I've written some recent articles on my belief that the Japanese market represents the best global value at this point in time. Part of that reasoning is tied to the idea that Japan is benefiting from the global swing from deflation to...
READ MORE
MEMBERS ONLY

OCTOBER GETS OFF TO A BAD START -- MARKET INDEXES ARE TESTING 200-DAY AVERAGES -- WEEKLY MACD LINES HAVE TURNED BEARISH
by John Murphy,
Chief Technical Analyst, StockCharts.com
DAILY CHARTS ... October is trying to live up to its reputation as one of the year's most dangerous months. All of the market averages fell sharply and on rising volume. That's a bad combination. Many of them undercut initial chart support at their August lows and...
READ MORE
MEMBERS ONLY

EURO JUMPS ON TALK OF RATE HIKES -- DOLLAR BACKS OFF FROM RESISTANCE -- GOLD NEARS UPSIDE BREAKOUT -- ROTATION OUT OF ENERGY AND HOUSING INTO GOLD CONTINUES
by John Murphy,
Chief Technical Analyst, StockCharts.com
EURO BOUNCES OFF JULY LOW ... The Euro is bouncing strongly off chart support at its July low as shown in Chart 1. Aside from technical considerations, there were two main catalysts behind today's jump. One is a statement from the president of the European Central Bank that it...
READ MORE
MEMBERS ONLY

ENERGY LEADS MARKET DECLINE -- S&P 500 BREAKS 200-DAY AVERAGE -- HOMEBUILDERS AND REAL ESTATE CONTINUE TO FALL
by John Murphy,
Chief Technical Analyst, StockCharts.com
BREAKS AUGUST LOW ... Earlier today I wrote that the S&P 500 was at a critical chart point as it neared a test of its August low and its 200-day moving average. It failed on both counts. Chart 1 shows the S&P closing below both support...
READ MORE
MEMBERS ONLY

BASIC MATERIALS WEIGHED DOWN BY CHEMICALS -- THEY'RE ALSO CYCLICAL IN NATURE -- GOLD IS OVERBOUGHT BUT STILL BULLISH -- HOW TO BUY RISING RATES
by John Murphy,
Chief Technical Analyst, StockCharts.com
BASIC MATERIALS ETF IS UNDERACHIEVING ... With all the recent talk about basic material prices moving up, a lot of readers have asked if this a good time to put money into the Materials Select Sector SPDR. I don't think so. Although it may seem counter-intuitive, the XLB...
READ MORE
MEMBERS ONLY

MARKET DROP CONTINUES -- S&P 500 NEARS TEST OF RECENT LOWS -- ENERGY STOCKS LEAD MARKET DECLINE
by John Murphy,
Chief Technical Analyst, StockCharts.com
STOCK MARKET INDEXES WEAKEN FURTHER ... The stock market slide that started yesterday afternoon is continuing this morning. Yesterday's selling on rising volume raised bearish concerns along with the fact that moving average lines were broken as well. The Dow Diamonds (DIA) in Chart 1 have fallen back below...
READ MORE
MEMBERS ONLY

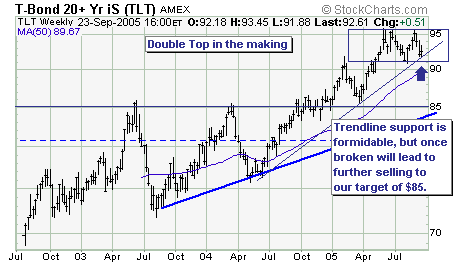
BIG JUMP IN MATERIAL PRICES HURTS BONDS -- 30 -YEAR T-BOND YIELD IS BREAKING OUT -- BOND ETF FORMING DOUBLE TOP
by John Murphy,
Chief Technical Analyst, StockCharts.com
MATERIAL PRICES HAVE BIG JUMP ... Long-term rates continue to rise in the face of rising inflation pressures. Over the last month, manufacturers reported the biggest jump in fifteen years in the prices they pay for materials. That means that upside pressures are building in the inflation pipeline. As you...
READ MORE
MEMBERS ONLY

BEARISH PATTERNS FOR THE RUSSELL 2000 ETF
The Russell 2000 ETF (IWM) has two potentially bearish patterns working that would be confirmed with a support break at 64 (645 for the Russell 2000). Confirmation is the key with both patterns. In fact, confirmation is the key to most patterns. Until confirmation, these are only potentially bearish patterns...
READ MORE
MEMBERS ONLY
GOLD APPROACHING RESISTANCE
This chart of gold has some interesting technical features. First, there is the parabolic rise to $850 in 1980, which culminated in the inevitable blowoff and collapse.
After a parabolic collapse, prices most often return to the original base, which in the case of gold is somewhere below $100 and...
READ MORE
MEMBERS ONLY
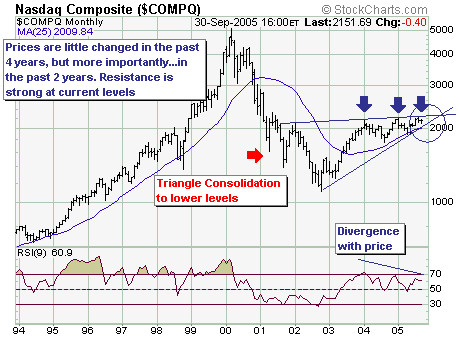
"TRIANGLE CONSOLIDATION" FOR THE NASDAQ
Taking a long-term gander at the Nasdaq Composite, I think is very clear that the time is running out for prices to rise much further than they have at present. The reason is that prices are winding their way through the "triangle consolidation"; which means two scenarios...
READ MORE
MEMBERS ONLY
HURRICANE RELIEF
HURRICANE RELIEF FROM STOCKCHARTS - Thanks to the support of our subscribers, StockCharts.com is donating over $20,000.00 to the Red Cross for its hurricane relief efforts for the month of September. We have also pledged a similar amount for the month of October - $5.00 for every subscription...
READ MORE
MEMBERS ONLY
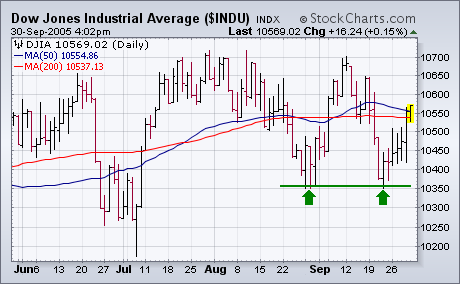
MARKET ENDS SEPTEMBER ON A STRONG NOTE
MARKET AVERAGES CLOSE BACK OVER 50-DAY LINES... The market had a lot thrown at it this month. A spike in energy prices, plunging consumer confidence, and rising long-term interest rates. It also had the month of September to deal with which has traditionally been the worst month of...
READ MORE
MEMBERS ONLY
Hello Fellow ChartWatchers!
This week, John reviews the market's recent performance in light of all the economic changes we've been seeing, Richard breaks out a new triangle pattern, Carl takes an in-depth look at gold, and Arthur Hill looks at the Russell 2000. Here we go......
READ MORE
MEMBERS ONLY

MARKET ENDS SEPTEMBER ON A STRONG NOTE -- PULLBACK IN ENERGY COMPLEX HELPS
by John Murphy,
Chief Technical Analyst, StockCharts.com
MARKET AVERAGES CLOSE BACK OVER 50-DAY LINES... The market had a lot thrown at it this month. A spike in energy prices, plunging consumer confidence, and rising long-term interest rates. It also had the month of September to deal with which has traditionally been the worst month of...
READ MORE
MEMBERS ONLY

NEW JAPANESE MARKET LEADERSHIP MAY BE SIGNALING SHIFT TO GLOBAL INFLATION
by John Murphy,
Chief Technical Analyst, StockCharts.com
JAPAN CONTINUES TO LEAD GLOBAL MARKETS ... I've written several bullish articles on Japan over the last few months. The last one on September 9 carried the headlines: "Japan Hits Four Year High" and "Japanese Market Leads Global Rally". The last paragraph in that article...
READ MORE
MEMBERS ONLY

NATURAL GAS IS NEW ENERGY LEADER -- NATURAL GAS STOCKS ARE PLAYING CATCHUP -- MUTUAL FUNDS OFFER BEST WAY TO DO SOME ENERGY SWITCHING
by John Murphy,
Chief Technical Analyst, StockCharts.com
A COMPARISON OF NAT GAS AND OIL... It's becoming increasingly clear that natural gas is now the strongest part of the oil patch. Part of the reason why can be seen in the following charts. The first two charts compare the ten-year history of crude oil (Chart...
READ MORE
MEMBERS ONLY

SEPTEMBER HEALTHCARE BREAKOUT IN DOUBT -- PHARM HOLDERS RETEST AUGUST LOW
by John Murphy,
Chief Technical Analyst, StockCharts.com
HEALTHCARE ETF IS SLIPPING ... On September 7 I wrote a positive story on the healthcare sector which was based on good chart action combined with relative strength (September 07, 2005). Although the group hasn't done that badly since then, it hasn't done that well either. So...
READ MORE
MEMBERS ONLY

BOUNCE IN OIL SPOILS EARLY MARKET RALLY -- RISING GOLD PULLING BOND YIELDS HIGHER -- NYSE BULLISH PERCENT INDEX TURNS DOWN
by John Murphy,
Chief Technical Analyst, StockCharts.com
30-YEAR T-BOND YIELD TESTS 200-DAY LINE ... I recently started to look at the 30-year T-bond yield to help determine the direction of long-term rates. That's because the 10-year T-note yield has given some false signals over the last year. Chart...
READ MORE
MEMBERS ONLY
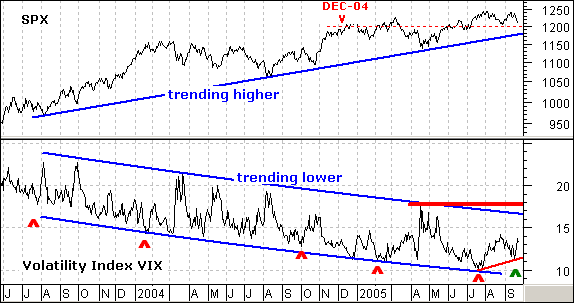
FEAR CREEPS IN
Fear is creeping into the market as the S&P 500 Volatility Index ($VIX) forms a higher low. And you thought the VIX was dead! Well, actually, it is pretty dead as volatility slows to a crawl. The VIX has been spot-on when it comes to calling market...
READ MORE
MEMBERS ONLY
NEW HIGHS AND NEW LOWS SIGNAL CAUTION
Since the beginning of July, 52-week new highs have been contracting with each new NYSE Composite price high, demonstrating that fewer and fewer stocks are participating in the rally. Contracting new highs by themselves are not always problematic, and can merely be a sign of an approaching correction in...
READ MORE
MEMBERS ONLY
SHORT POSITIONS IN LONG-END BOND
With both Hurricane Katrina and Rita now in the history books, local, state and federal government to issue more debt will need to issue debt for reconstruction efforts and so forth. This bearish fundamental coupled with the yield curve not inverting any longer suggest the risk-reward of short positions...
READ MORE
MEMBERS ONLY
HELP FOR HURRICANE VICTIMS
- If you are a victim of either of the gulf coast hurricanes and have been unable to access your StockCharts.com account since the storms hit, please let us know and we will credit your account for the time you have been away from the Internet. In addition, for every...
READ MORE
MEMBERS ONLY
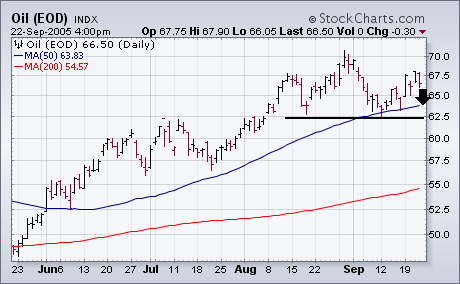
OIL MAY BE FORMING SHORT-TERM TOP ...
Today's selloff in oil of more than two dollars may be completing a right shoulder in a short-term head and shoulders top in the key commodity. The September bounce has fallen well short of the late-August peak (the head) and is about equal to the early...
READ MORE
MEMBERS ONLY
Hello Fellow ChartWatchers!
Forces of nature have conspired to prevent the stock market from rising significantly since our last visit, however the markets have showed suprising strength considering the impact on the US economy that these storms are having. The storms are also on the minds of our regular columnists. John Murphy reviews...
READ MORE
MEMBERS ONLY

MARKET AVERAGES ARE TESTING KEY SUPPORT LEVELS -- LONG TERM TREND OF THE MARKET STILL LOOKS TOPPY
by John Murphy,
Chief Technical Analyst, StockCharts.com
PULLBACK IN OIL MAY BE HELPING ... Everywhere we look we see essentially the same chart picture. The major stock indexes are struggling to hold at the first key support levels drawn under their August lows. Chart-watchers know that's a very important test. Even before the recent hurricanes...
READ MORE
MEMBERS ONLY

ENERGY STOCKS PULL BACK FROM OVERBOUGHT CONDITION -- CRUDE MAY BE PUTTING IN SHORT-TERM TOP
by John Murphy,
Chief Technical Analyst, StockCharts.com
HIGH VOLUME REVERSAL IS A CONCERN ... On September 14 I used weekly charts to show why I believed that the the long-term trend of the energy sector had reached overbought territory (September 14, 2005). [The monthly charts are also overbought]. I allowed, however, for higher prices since the short-...
READ MORE
MEMBERS ONLY

BANK STOCKS ARE LEADING FINANCIAL SECTOR LOWER -- WHY REITS ARE BEING SOLD ON FEARS OF RISING INFLATION
by John Murphy,
Chief Technical Analyst, StockCharts.com
BANK INDEX HITS FIVE-MONTH LOW ... Heavy selling in bank stocks is pulling the entire financial sector lower today. Chart 1 shows the PHLX Bank Index (BKX) falling to a new four-month low. Part of the financial selling may be coming from heightened fears of inflation which encourages the...
READ MORE
MEMBERS ONLY

STAYING WITH GOLD STOCKS -- MARKET INDEXES BREAK MOVING AVERAGES ON RISING VOLUME -- ROTATING FROM HOUSING TO GOLD
by John Murphy,
Chief Technical Analyst, StockCharts.com
GOLD SHARES REACH TOP OF TRADING RANGE... On September 14 I wrote that the next upside target for the Gold & Silver (XAU) would be the top of a two-year trading range in the 111-113 zone (September 14, 2005). The XAU has reached that zone and is pulling...
READ MORE
