MEMBERS ONLY

HURRICANE FEARS CAUSE ENERGY SPIKE -- CONSUMER DISCRETIONARY STOCKS LEAD MARKET DECLINE -- CHIPS LEAD TECH SELLING

by John Murphy,
Chief Technical Analyst, StockCharts.com
CONSUMER STOCKS ARE UNDERPERFORMING ... The latest consumer confidence report showed the biggest drop in years. While that may have been an over-reaction to the shock of Hurricane Katrina, consumer confidence has been dropping all year. We can tell that by looking at the relative performance of consumer discretionary stocks....
READ MORE
MEMBERS ONLY

IT MAY BE TIME TO ROTATE FROM OIL TO GOLD -- 30-YEAR T-BOND YIELD IS JUMPING -- THAT'S BAD FOR HOUSING AND REAL ESTATE
by John Murphy,
Chief Technical Analyst, StockCharts.com
GOLD IS BREAKING OUT ... With everyone talking about oil, the gold market is breaking out to the highest level in seventeen years while oil is starting to slip. I'm going to make a case here for moving some money out of the energy sector and into gold stocks....
READ MORE
MEMBERS ONLY

GOLD AND BOND YIELDS RISE ON INFLATION EXPECTATIONS -- RETAIL HOLDERS ARE THREATENING THEIR 200-DAY AVERAGE
by John Murphy,
Chief Technical Analyst, StockCharts.com
GOLD CONTINUES TO CLIMB... Gold jumped another $4 today to reach another 2005 high. Gold stocks are rising as well. Chart 1 shows the Gold ETF (GLD) reaching $454 today which puts it within striking distance of the high reached late last year. With bullion on the rise, gold stocks...
READ MORE
MEMBERS ONLY

LONG-TERM OIL TREND IS OVER-EXTENDED -- NEXT UPSIDE TARGET FOR THE XAU -- VOLUME PATTERN FOR MARKET IS NEGATIVE
by John Murphy,
Chief Technical Analyst, StockCharts.com
ENERGY TREND IS STILL UP ... I've received a number of questions on some of my recent market messages that I'll try to answer herein. One has to do with my comment on Monday that "the trend in the energy sector is still up ,but very-...
READ MORE
MEMBERS ONLY

LOWER OIL CONTINUES TO SUPPORT MARKET -- DOW AND S&P 500 ARE TESTING AUGUST HIGHS
by John Murphy,
Chief Technical Analyst, StockCharts.com
CRUDE NEARS TEST OF LOW 60s ... Energy futures fell again today and continued to lend short-term support to the rest of the market. Crude oil fell 75 cents to close at $63.34. Last Tuesday, I wrote that crude appeared headed for a test of initial support near $63....
READ MORE
MEMBERS ONLY
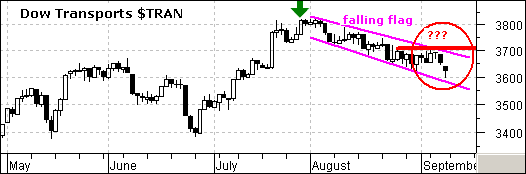
TRANSPORTS LAG INDUSTRIALS
Dow Theory stipulates that the Dow Industrials and Dow Transports should confirm each other to validate weakness or strength. Most recently, both Averages recorded new reaction highs in late July (green arrows) and this provided a Dow Theory confirmation of strength. Both Averages corrected in August, but only one surged...
READ MORE
MEMBERS ONLY
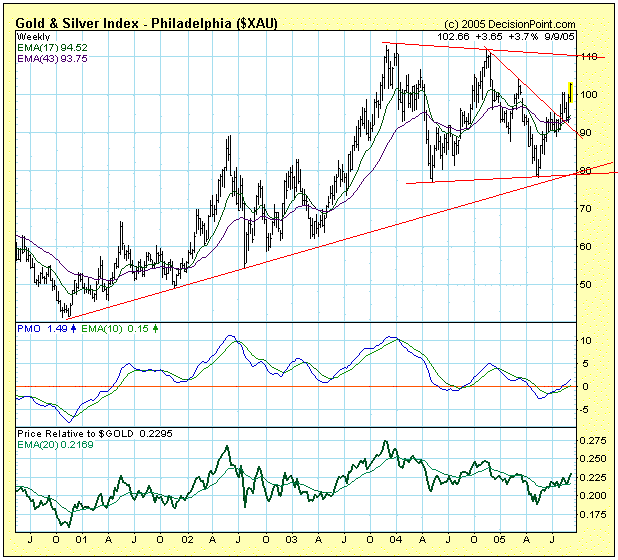
GOLD STOCKS APPROACHING RESISTANCE, POSSIBLE BREAKOUT
The May low for the Philadelphia Gold and Silver Index (XAU) provided us with the second data point necessary to establish the bottom of a trading range that is about two years old. The XAU is now approaching the top of the range, and we can expect that the current...
READ MORE
MEMBERS ONLY
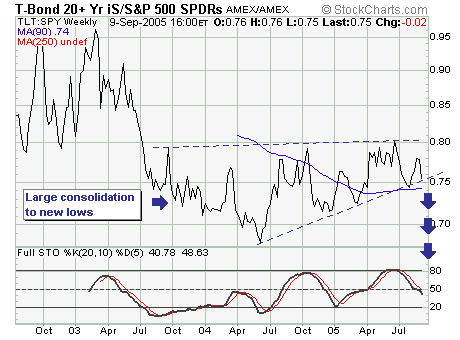
EFFECTS OF KATRINA
With the passing of Hurricane Katrina, we want to hone our focus in upon the TLT:SPY ratio relationship. This is simply due to the enormous amount of local, state and federal debt issuance that will materialize due to the substantial nature cost of clean-up and reconstruction efforts of...
READ MORE
MEMBERS ONLY
NEW BOOK FROM STOCKCHARTS' OWN GREG MORRIS!
- Now is your chance to pre-order Greg Morris' new book, "The Complete Guide to Market Breath Indicators". This completely new book is a compilation of all the major (and most of the minor) market breadth indicators that are in use today. Be the first on your...
READ MORE
MEMBERS ONLY
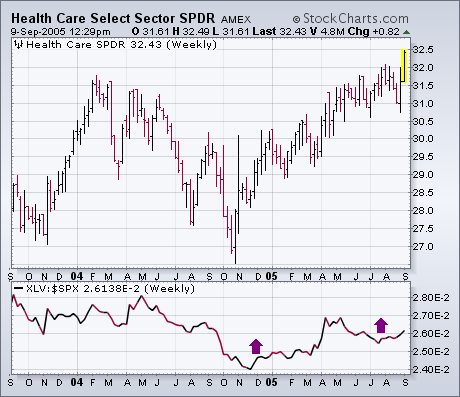
FRIDAY BLOOMBERG INTERVIEW ...
Some of you may have watched my 7:10 am interview on Bloomberg TV Friday. I discussed the upside breakout in the healthcare sector that I wrote about earlier in the week. For those of you who missed it, however, I'd like to show the same charts that...
READ MORE
MEMBERS ONLY
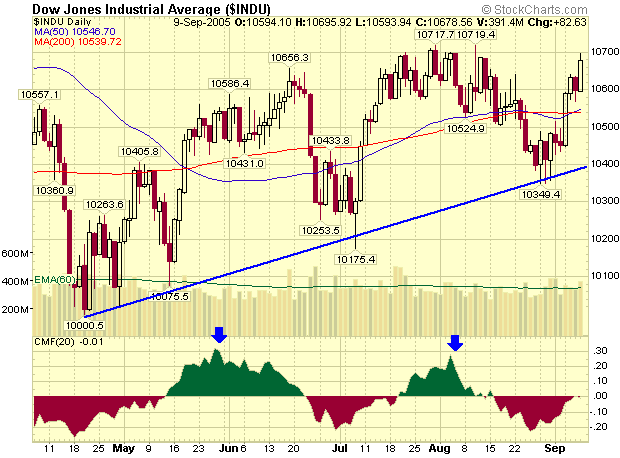
Hello Fellow ChartWatchers!
At the end of August, a very promising thing happened on the Dow Jones Industrials chart. Did you see it?
Last Thursday the index reversed around the 10,350 level. That confirmed the intermediate term uptrend (blue line) that goes back to the 10,000 low from last April. During...
READ MORE
MEMBERS ONLY

MORE ON HEALTHCARE INTERVIEW
by John Murphy,
Chief Technical Analyst, StockCharts.com
FRIDAY BLOOMBERG INTERVIEW ... Some of you may have watched my 7:10 am interview on Bloomberg TV this morning. I discussed the upside breakout in the healthcare sector that I wrote about here earlier in the week. For those of you who missed it, however, I'd like to...
READ MORE
MEMBERS ONLY

FALLING DOLLAR CONTINUES TO BOOST GOLD AND FOREIGN ETFS -- GOLD IS BREAKING OUT -- JAPAN HITS NEW FOUR-YEAR HIGH
by John Murphy,
Chief Technical Analyst, StockCharts.com
WEAKER DOLLAR BOOSTS GOLD AND JAPAN ... I've written several earlier articles on my belief that a weakening dollar would boost gold shares and foreign ETFs. As recently as August 22, I posted an article on why a falling dollar boosted foreign ETFs and highlighted the Japanese market which...
READ MORE
MEMBERS ONLY

HEALTHCARE LEADERS INCLUDE SOME DRUGS -- PHARM HOLDERS TURN UP -- PFE AND JNJ ARE BOUNCING -- BUT SGP AND WYE ARE LEADING
by John Murphy,
Chief Technical Analyst, StockCharts.com
NEW HEALTHCARE LEADERSHIP ... Yesterday I showed the Health Care Select SPDR (XLV) hitting a new high for the year and referred to the group as defensive in nature. I'd like to build on both themes today since healthcare is one of today's sector leaders and is...
READ MORE
MEMBERS ONLY

FALLING OIL GIVES MARKET A LIFT -- DOW CLEARS MOVING AVERAGE LINES -- HEALTHCARE ETF HITS NEW HIGH
by John Murphy,
Chief Technical Analyst, StockCharts.com
OVERBOUGHT CRUDE OIL BACKS OFF FROM $70 ... Crude oil fell another $1.61 today and gave a boost to the stock market. With all the concern over Hurricane Katrina last week, it was easy to lose sight of the fact that crude oil was probably ready for a correction anyway....
READ MORE
MEMBERS ONLY

GLOBAL MARKETS LEAD US HIGHER
by John Murphy,
Chief Technical Analyst, StockCharts.com
GLOBAL ETFS HIT NEW HIGHS ... While the U.S. took Labor Day off, the rest of the world continued to trade. And they were buying. Most of the world's stock markets gained ground on Monday (and again today) which is giving the U.S. market a boost. Chart...
READ MORE
MEMBERS ONLY

MARKET ENDS WEEK ON A QUIET NOTE -- PULLBACK IN CRUDE STABILIZES MARKETS
by John Murphy,
Chief Technical Analyst, StockCharts.com
SHORT-TERM MARKET TREND IMPROVES ... After a turbulent week dominated by Hurricane Katrina, the stock market appears to be ending the week on a more positive note. Wednesday's upside turnaround was the most important day of the week. As Chart 1 shows, the S&P 500 moved...
READ MORE
MEMBERS ONLY

WEAKER DOLLAR BOOSTS GOLD -- YIELD CURVE WIDENS A BIT -- WILL THE FED PAUSE?
by John Murphy,
Chief Technical Analyst, StockCharts.com
GOLD JUMPS SHARPLY AS DOLLAR FALLS ... Yesterday I showed the Gold ETF (GLD) and the Gold (XAU) Index stabilizing at their moving average lines, and suggested that both were starting to benefit from a falling dollar. With the dollar falling even further today, gold prices have gained more than $9....
READ MORE
MEMBERS ONLY

DROP IN BOND YIELDS HINT AT SLOWER ECONOMY -- FLATTENING YIELD CURVE IS HURTING BANKS -- SLOWER GROWTH LOWERS DOLLAR -- CRB INDEX HITS 25-YEAR HIGH
by John Murphy,
Chief Technical Analyst, StockCharts.com
CRB INDEX SOARS ON HURRICANE ... Energy prices aren't the only ones being pushed higher by the recent hurricane. The CRB Index has climbed to the highest level in twenty-five years. Most of this week's gains have been seen in those commodities directly related to problems...
READ MORE
MEMBERS ONLY

HURRICANE DAMAGE PUSHES ENERGY TO NEW RECORDS -- RETAILERS AND TRANSPORTS ARE HIT THE HARDEST -- MARKET CAN'T REGAIN 50-DAY AVERAGES
by John Murphy,
Chief Technical Analyst, StockCharts.com
OIL SERVICE HOLDERS ARE CLIMBING AGAIN ... Yesterday's late selloff in crude oil proved temporary. Reports of heavy hurricane damage in the Gulf Coast has pushed energy prices at or close to record highs today -- including crude oil, gasoline, and natural gas. That's giving another boost to...
READ MORE
MEMBERS ONLY

OIL SPIKE BACKS OFF FROM $70 AS STOCKS RECOVER EARLY LOSSES -- AUGUST ROTATIONS SHOW A MORE DEFENSIVE MARKET
by John Murphy,
Chief Technical Analyst, StockCharts.com
ENERGY RALLY FADES... The threat from Hurricane Katrina caused an early spike in oil prices to $70 which caused early selling in stocks. As the day wore on, however, crude gave back most of its early gains to close up $1.15 at $67.20. The late pullback helped stabilize...
READ MORE
MEMBERS ONLY

LONGER TERM INDICATORS SHOW THAT THE BULL MARKET MAY BE NEARING COMPLETION -- SEASONAL TRENDS HAVE TURNED NEGATIVE -- WHY THE FOUR-YEAR CYCLE HAS ME WORRIED
by John Murphy,
Chief Technical Analyst, StockCharts.com
SHORT-TERM SLIPPAGE... Wednesday's price action pushed the S&P 500 below its 50-day moving average on a closing basis for the first time since mid-May and confirmed recent signs of weakening in its short-term trend. The SPY also closed back below its March...
READ MORE
MEMBERS ONLY

HOMEBUILDERS WEIGH ON MARKET -- HOUSING INDEX LOOKS TOPPY
by John Murphy,
Chief Technical Analyst, StockCharts.com
HOMEBUILDERS CONTINUE TO FALL ... I've written before about the fact that homebuilders (and REITs) were among the market's worst performers during August. That trend continued again today. But this time there was some tangible evidence that the housing boom might finally be slowing. July home resales...
READ MORE
MEMBERS ONLY

HOW A FALLING DOLLAR BOOSTS FOREIGN ETFS -- LAND OF THE RISING STOCK MARKET
by John Murphy,
Chief Technical Analyst, StockCharts.com
EAFE ISHARES ARE HAVING A STRONG AUGUST... I've written several pieces recently -- and again today -- about how a weakening dollar was helping foreign ETFs outperform the U.S. market. That's been especially true since the start of August. Chart 1 helps to show the effect the...
READ MORE
MEMBERS ONLY

JAPAN ISHARES HIT 2005 HIGH -- FOREIGN ETFS LEAD AUGUST RANKINGS -- FOREIGN CURRENCIES ARE GAINING
by John Murphy,
Chief Technical Analyst, StockCharts.com
EXCEED MARCH HIGH ... Last Monday I wrote a bullish story on the Japanese stock market. At the time, the Nikkei 225 was breaking out to a new four-year high. I suggested that Japan iShares (EWJ) were about to do the same. They're almost there. Chart 1 shows...
READ MORE
MEMBERS ONLY

RYDEX CASH FLOW RATIO FAVORS BULLS
There is growing evidence that a bull market top is finally in place, but not all the evidence supports that scenario. For example, the Rydex Cash Flow Ratio shows that bearish sentiment is again approaching record levels, indicating that another run at new price highs could be in the cards....
READ MORE
MEMBERS ONLY
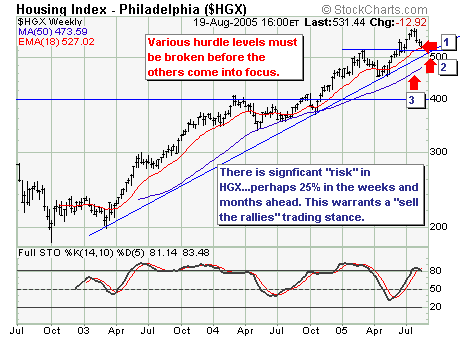
HOUSING INDEX ($HGX) COMING INTO CLEAR FOCUS
The current broader market decline has brought the Housing Index ($HGX) into clear focus; magazine after newspaper after TV show are talking about whether housing is overvalued and ready for a decline. We will save our thoughts for this for another time, but we do have some technical thoughts on...
READ MORE
MEMBERS ONLY
JOHN MURPHY'S BACK FROM VACATION
- After a week off, John's back at his perch, watching the markets like a hawk and reporting the technical developments to his subscribers. John reports that his trip to Yellowstone National Park and the Grand Tetons was spectacular and very relaxing although he did confess to sneaking a...
READ MORE
MEMBERS ONLY
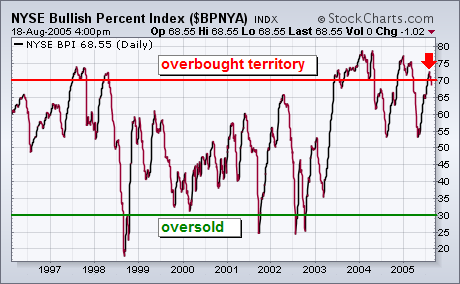
NYSE BULLISH PERCENT INDEX IS OVERBOUGHT ...
One of the ways to determine if the stock market is in a long-term overbought or oversold area is to chart the NYSE Bullish Percent Index which is shown in the chart below. The BPNYA measures the percent of stocks that are on point & figure buy signals. The...
READ MORE
MEMBERS ONLY
Hello Fellow ChartWatchers!
The Dow continues to oscillate around 10,600 without much direction right now - sometimes getting near 10,700 - other times falling as low as 10,500. Now that the two major moving averages (50-day and 200-day) have essentially "merged" near the 10,550 mark, they should...
READ MORE
MEMBERS ONLY

OIL PATCH BOUNCES BACK -- RETAILERS HURT BY RISING GASOLINE PRICES -- NYSE BULLISH PERCENT INDEX TOOKS TOPPY
by John Murphy,
Chief Technical Analyst, StockCharts.com
ENERGY SPDR BOUNCES OFF 50-DAY LINE ... After selling off throughout the week, crude oil jumped sharply on Friday and gave a big boost to the energy sector. It's too soon to tell if today's bounce marked the end of the recent downside correction, but it...
READ MORE
MEMBERS ONLY

MARKET AVERAGES SHOW NO TREND CHANGES -- AUGUST TRADING RANGE IS STILL INTACT -- FALLING OIL IS HELPING TO STABILIZE MARKET
by John Murphy,
Chief Technical Analyst, StockCharts.com
DOW DIAMONDS BOUNCE OFF 50-DAY LINE ... Little has happened to the major market averages since my Monday message. Chart 1 shows the Dow Diamonds bouncing off their 50-day average again. That's usually the first line of important support during a pullback or consolidation. The daily MACD...
READ MORE
MEMBERS ONLY

HOUSING AND REAL ESTATE STOCKS HAVE SOLD OFF ON THREAT OF RISING BOND YIELDS
by John Murphy,
Chief Technical Analyst, StockCharts.com
HOUSING AND REAL ESTATE ARCHIVES... One of our readers asked yesterday if I had any thoughts on the housing sector. In fact, I've written several articles on housing over the last month. An August 5 headline read: "Real Estate Has A Bad Week". An August 4...
READ MORE
MEMBERS ONLY

HEAVY SELLING IN ENERGY AS OIL FALLS $2 -- CRB INDEX BACKS OFF FROM MARCH PEAK -- ALCOA AND NEWMONT MINING WEAKEN
by John Murphy,
Chief Technical Analyst, StockCharts.com
CRUDE DROP HURTS ENERGY SHARES... On Monday I wrote about energy shares looking over-extended and vulnerable to some profit-taking. They've been the weakest part of the market over the last two days. Not surprisingly, crude oil dropped more than $2.00 today as well. That'...
READ MORE
MEMBERS ONLY

MAJOR MARKET AVERAGES ARE CONSOLIDATING OVER SUPPORT LEVELS
by John Murphy,
Chief Technical Analyst, StockCharts.com
DOW DIAMONDS HOLD 50-DAY LINE ... The Dow Diamonds have been moving sideways since the start of August. Despite their loss of upside momentum, there hasn't been much chart damage either. Chart 1 shows the Dow Diamonds surviving a test of their 50-day moving average at the...
READ MORE
MEMBERS ONLY

GOLD SHARES RISE, BUT ARE OVERBOUGHT AS ARE ENERGY SHARES -- THAT'S GIVING A BOOST TO THE REST OF THE MARKET
by John Murphy,
Chief Technical Analyst, StockCharts.com
GOLD SHARES HAVE STRONG WEEK ... Among industry groups, gold stocks catapulted to the top spot last week. Chart 1 shows the Gold & Silver (XAU) Index breaking through a major down trendline and its 200-day moving average. A lot of that had to do with a weaker dollar. [I...
READ MORE
MEMBERS ONLY

JAPAN LEADS GLOBAL ETFS DURING AUGUST -- EWJ ON VERGE OF MULTI-YEAR BREAKOUT -- NIKKEI HITS FOUR-YEAR HIGH
by John Murphy,
Chief Technical Analyst, StockCharts.com
JAPAN ETF CHALLENGES 2005 HIGH ... At the start of August, I wrote that a weaker dollar was giving a big boost to foreign Exchange Traded Funds which were outperforming the U.S. That's because foreign ETFs benefit from rising stocks and rising foreign currencies. There have been some...
READ MORE
MEMBERS ONLY

GUEST COMMENTARY: MURPHY REVIEW - CHIP ANDERSON
by John Murphy,
Chief Technical Analyst, StockCharts.com
JOHN'S ON VACATION THIS WEEK...... John's taking a well deserved break from watching the markets. If everything is going to schedule, he should be enjoying the sights at Yellowstone National Park right about now. In the meantime, I thought we'd take a look back...
READ MORE
MEMBERS ONLY
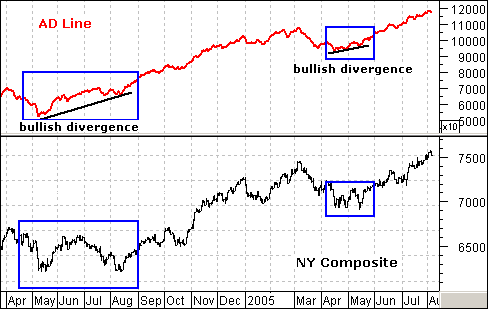
BREADTH REMAINS STRONG
Bullish and bearish divergences in the AD Line often precede significant bottoms and tops. Even though reversals are certainly possible when the AD Line is keeping pace, they are the exception rather than the rule. (Note: The Advance Decline Line is a cumulative measure of advancing issues less declining issues)...
READ MORE
MEMBERS ONLY
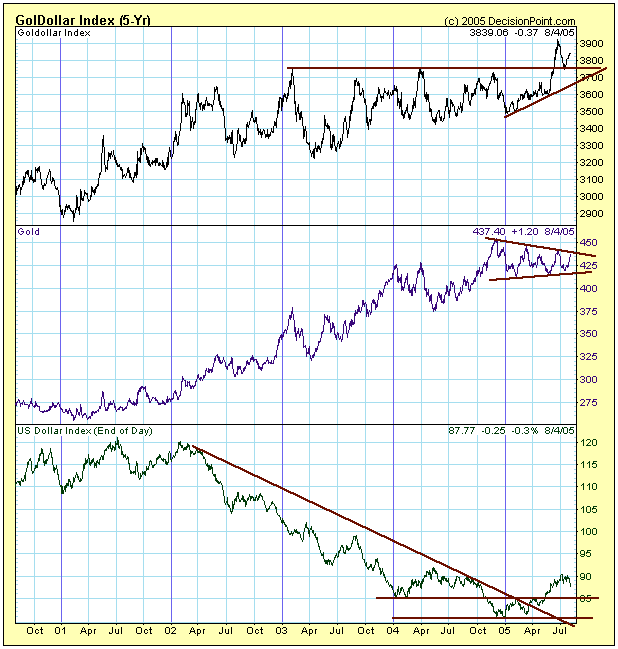
GOLDOLLAR INDEX SHOWS GOLD'S STRENGTH
Generally speaking, gold and the dollar have an inverse relationship -- a rising dollar causes the price of gold to decline and vice versa; however, supply and demand pressures also influence the price of gold, but it is often difficult to see them. For this we use the GolDollar Index.
The...
READ MORE
