MEMBERS ONLY
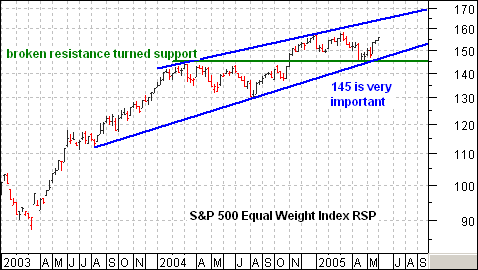
ABOUT THE RYDEX EQUAL WEIGHT S&P 500 INDEX (RSP)
As its name implies, the Rydex Equal Weight S&P 500 Index (RSP) treats all component equal, regardless of market capitalization. This means that ExxonMobile (XOM). with market cap of $369 billion, counts the same as Teco Energy TE), which has a market cap of just $3.64 billion....
READ MORE
MEMBERS ONLY
ENERGY SECTOR CASH FLOW IS TEPID
Decision Point tracks actual cash flowing into and out of Rydex mutual funds, and, while cash flow normally runs parallel to price, divergences can often appear ahead of price reversals. For example, let's look at Rydex Energy and Rydex Energy Service Funds.
During the last four weeks of...
READ MORE
MEMBERS ONLY
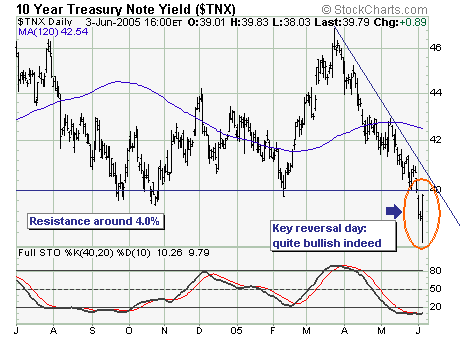
BOND REVERSAL MEAN MOVE FOR INTEREST RATES?
Rarely do they ring a 'bell' at the bottom, but Friday's reversal higher in bond yields argues strongly for a sustained move higher in interest rates. Quite simply, Friday's employment report was clearly on the 'weak side'; with the 10-year note...
READ MORE
MEMBERS ONLY
SHARPCHARTS 2 NEWS
- We took a big step forwards last week behind-the-scenes with our SharpCharts2 Beta program. Because SharpCharts2 is much more powerful, we've been working hard on making sure that our computer systems can support the additional load we will see once SharpCharts2 is officially released. Part of...
READ MORE
MEMBERS ONLY
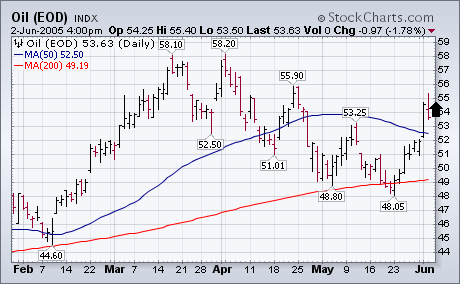
OIL ISN'T DEAD YET
...
A lot of recent optimism on the stock market and the economy has been predicated on the view that the historic rise in oil prices has probably ended. A lot of economists have also declared the major bull market in commodities over. Both of those predictions may prove to have...
READ MORE
MEMBERS ONLY
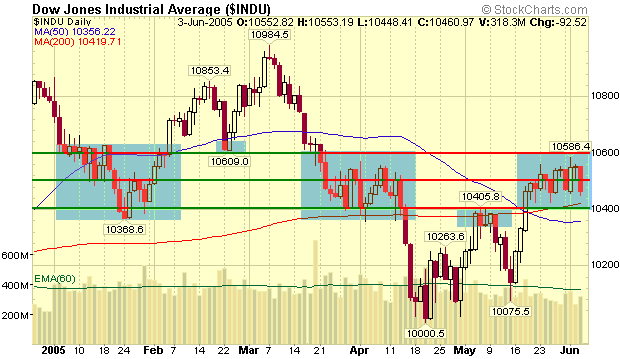
Hello Fellow ChartWatchers!
This week saw the markets move "violently sideways" as large up-days were immediately followed by similarly large down-days. Essentially, the Dow is continuing to lurch around inside of its 10,400 to 10,600 trading range. Check out how much time the Dow has spent in...
READ MORE
MEMBERS ONLY

RISING OIL MAY BE STARTING TO WORRY THE MARKET -- FALLING BOND YIELDS MAY BE THE REASON WHY GOLD AND GOLD STOCKS ARE BOUNCING OFF SUPPORT LEVELS

by John Murphy,
Chief Technical Analyst, StockCharts.com
OIL ISN'T DEAD YET ... A lot of recent optimism on the stock market and the economy has been predicated on the view that the historic rise in oil prices has probably ended. A lot of economists have also declared the major bull market in commodities over. Both of...
READ MORE
MEMBERS ONLY

OIL SURGES 5% TO BOOST ENERGY SECTOR -- PLUNGING BOND YIELDS SUPPORT MARKET RALLY LED BY RATE-SENSITIVE SHARES -- NASDAQ INDEXES REACH INITIAL TARGETS
by John Murphy,
Chief Technical Analyst, StockCharts.com
CRUDE OIL SURGES 5% ... After surviving a recent test of its 200-day moving average, crude oil surged $2.63 (5%) today. That puts the key commodity back over its 50-day average, its early May high, and breaks a two-month down trendline. That strong price action puts crude...
READ MORE
MEMBERS ONLY

MAY DATA PUSHES BOND YIELDS BELOW 4% AND SPARKS BOND AND STOCK BUYING
by John Murphy,
Chief Technical Analyst, StockCharts.com
PLUNGE IN PRICE DATA PUSHES YIELDS LOWER... This morning's report that prices paid by manufacturers during May saw the biggest drop since the early 1970's helped push bond yields well below 4% and to the lowest level in a year. Chart 1 shows the 10-year...
READ MORE
MEMBERS ONLY

EURO PLUNGES TO SEVEN-MONTH LOW -- GOLD AND OIL RECOVER MOST OF EARLY LOSSES -- OVERBOUGHT MARKET PULLS BACK
by John Murphy,
Chief Technical Analyst, StockCharts.com
EURO FALLS ON FRENCH VOTE... The Euro tumbled to the lowest level in seven months after the French voted against the European constitution over the weekend. Needless to say, that gave the dollar a big boost, but pushed gold prices lower. By day's end, however, gold regained some...
READ MORE
MEMBERS ONLY

NASDAQ APPROACHES NEXT TARGET AT 2100 -- LIGHT VOLUME IS A CONCERN -- UPTURN IN ENERGY PATCH MAY CAUSE SOME SHORT-TERM PROFIT-TAKING NEXT WEEK
by John Murphy,
Chief Technical Analyst, StockCharts.com
LACK OF VOLUME IS A CONCERN ... The last time I showed the Nasdaq Composite market I wrote that it's next upside target was its spring high at 2100. Friday's close put it very close to that initial upside target. It's daily oscillators also show...
READ MORE
MEMBERS ONLY

SEMICONDUCTOR HOLDERS PULLED HIGHER BY INTEL AND TEXAS INSTRUMENTS
by John Murphy,
Chief Technical Analyst, StockCharts.com
SEMICONDUCTOR HOLDERS NEAR 2005 HIGH ... As a follow-up to my earlier message on the improving performance by the semiconductor group, I'm going to focus this report on the Semiconductor Holders and a couple of big stocks pulling it higher. Chart 1 shows the Semiconductor Holders (SMH) trading...
READ MORE
MEMBERS ONLY

SEMICONDUCTORS CONTINUE TO SHOW NEW LEADERSHIP -- WHY THAT'S GOOD FOR THE REST OF THE MARKET
by John Murphy,
Chief Technical Analyst, StockCharts.com
THE SOX IS NEARING TEST OF MAJOR RESISTANCE ... On May 16 I wrote about new signs of leadership coming from the semiconductor group. That was predicated on the move by the SOX Index back over its moving average lines and, more importantly, an upturn in its relative strength line. That...
READ MORE
MEMBERS ONLY

NYSE BULLISH PERCENT INDEX IS HOLDING AT SUPPORT, BUT HASN'T BOUNCED MUCH
by John Murphy,
Chief Technical Analyst, StockCharts.com
THE NYSE BULLISH PERCENT INDEX... I've written about using the Bullish Percent Indexes with point & figure charts. As useful as that is, you can also produce line charts on the various Bullish Percent Indexes. And they can yield some interesting market information. Chart 1 shows the NYSE...
READ MORE
MEMBERS ONLY

LONG-TERM RATES ARE TESTING 4.00% LEVEL -- HOLDERS OF REITS AND HOUSING STOCKS MIGHT WANT TO PAY CLOSE ATTENTION
by John Murphy,
Chief Technical Analyst, StockCharts.com
10-YEAR T-NOTE TESTS FEBRUARY LOW ... After spiking higher from mid-February to mid-March, long-term rates have been dropping. No one is sure exactly why they've been dropping, but they have. Chart 1 shows, however, that the yield on the 10-year T-note (TNX)...
READ MORE
MEMBERS ONLY

OIL CLIMBS BACK OVER $51 -- OIL SERVICE LEADS ENERGY SECTOR HIGHER
by John Murphy,
Chief Technical Analyst, StockCharts.com
CRUDE OIL BOUNCES OFF 200-DAY AVERAGE... Today's $1.58 gain in crude oil pushes it more than a dollar over the psychological $50 level and may represent a successful test of its 200-day moving average. That's giving a boost to energy stocks which have...
READ MORE
MEMBERS ONLY

A LOOK AT BOLLINGER BANDS IN THREE DIFFERENT TIME DIMENSIONS
by John Murphy,
Chief Technical Analyst, StockCharts.com
A TRIBUTE TO JOHN BOLLINGER ... In honor of John Bollinger's having received the MTA Annual Award this past weekend, I thought it an appropriate time to write about his greatest invention which are aptly called Bollinger bands. Chart 1 shows the bands applied to a daily chart of...
READ MORE
MEMBERS ONLY
THOUGHTS AND IMPRESSIONS FROM THE MARKET TECHNICIANS WEEKEND MEETING -- JOHN BOLLINGER GETS MTA AWARD
by John Murphy,
Chief Technical Analyst, StockCharts.com
WHAT TOP TECHNICIANS ARE THINKING ... The Market Technicians Associations annual seminar held this past weekend in New York gave me a great opportunity to get a glimpse of what some of the top technical analysts are thinking right now. I was relieved that they were also a little puzzled by...
READ MORE
MEMBERS ONLY

GOLD AND OIL STOCKS ARE TESTING MAJOR SUPPORT LEVELS -- THEIR RECENT WEAKNESS HAS BEEN DUE TO A RISING DOLLAR AND HAS HELPED STOCKS RALLY
by John Murphy,
Chief Technical Analyst, StockCharts.com
OIL SERVICE INDEX TESTING 200-DAY AVERAGE... Oil service stocks, which have corrected downward with the price of crude oil, continue to test important chart support. Chart 1 shows the OSX trying to bounce off its 200-day moving average. The Commodity Channel (CCI) Index shows that the OSX is...
READ MORE
MEMBERS ONLY
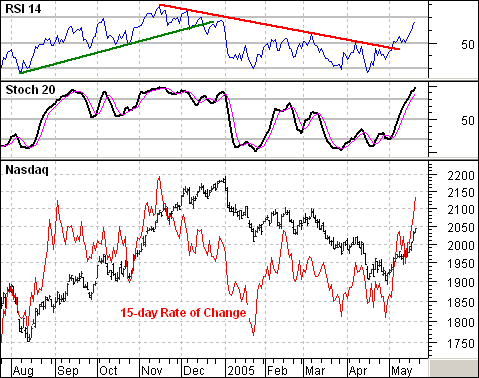
NASDAQ OVERBOUGHT, BUT NOT BEARISH
The current rally is the strongest of the year and is unlikely to disappear over night. This strength is confirmed by price movement as well as two momentum indicators. First, the 15-day Rate-of-Change surged to levels not seen since early September and mid November. Second, 15-day...
READ MORE
MEMBERS ONLY
INITIATION CLIMAX?
One of Decision Point's proprietary indicators is the Participation Index (PI). It measures extreme (climactic) activity within a short-term price envelope. When a large number of stocks are participating in a particular price move (up or down), we recognize that such high levels of participation are unsustainable...
READ MORE
MEMBERS ONLY
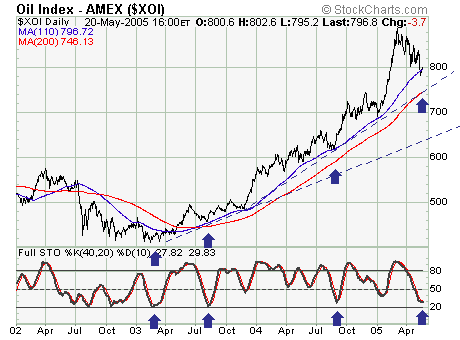
RECENT DECLINE IN XOI CORRECTIVE
Quite simply, the recent decline in the AMEX Oil Index (XOI) appears corrective in nature; and thus one would want to be long these shares at this time as the risk-reward parameters are now favorable.
If past is prelude, and although it is not perfecta simple rhyme will do;...
READ MORE
MEMBERS ONLY
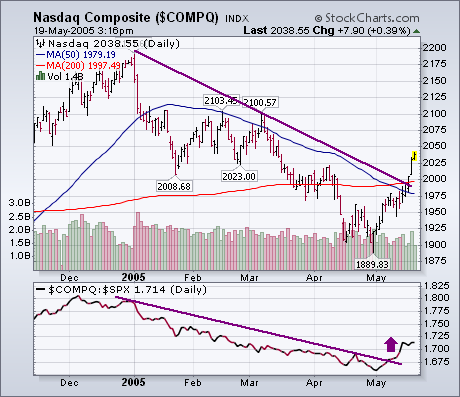
NASDAQ LEADS MARKET HIGHER...
In my view, the most significant improvement has taken place in the technology-dominated Nasdaq market. The Nasdaq Composite Index broke through its 200-day average on Tuesday and has broken its 2005 down trendline. Its relative strength line has turned up relative to the S&P 500 . That&...
READ MORE
MEMBERS ONLY
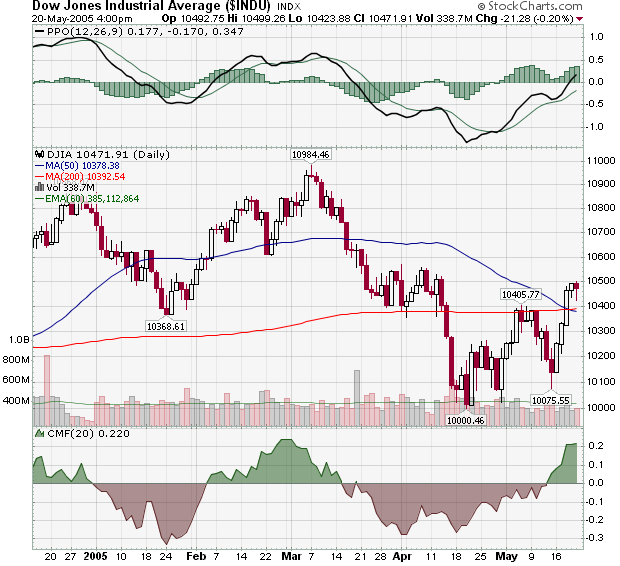
Hello Fellow ChartWatchers!
It took a couple of big days to get the Dow back above the 10,400 level but last week's reaction rally has managed to do the trick and allowed the Dow to finish at 10,471. But will it last? The technical signs aren't convincing:...
READ MORE
MEMBERS ONLY
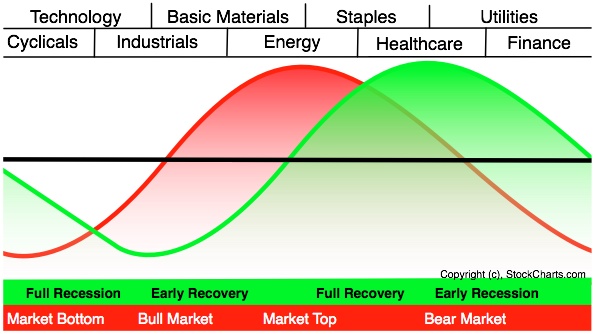
SECTOR ROTATIONS INDICATE A COMPRESSED CYCLE -- WHY SECTOR ROTATIONS HAVE TURNED POSITIVE -- MARKET INDEXES NOW JUSTIFY NEW LONGS
by John Murphy,
Chief Technical Analyst, StockCharts.com
SECTOR ROTATION MODEL... The diagram in chart 1 shows the sector rotations that normally occur at different stages of a market (red line) and business cycle (green line). When we talk about a business cycle, we're normally talking about the traditional four-year cycle. That means that these...
READ MORE
MEMBERS ONLY

MARKET TAKES TURN FOR THE BETTER -- FINANCIALS, RETAILERS, AND TECHS LEAD MARKET HIGHER -- MAJOR INDEXES EXCEED MOVING AVERAGES
by John Murphy,
Chief Technical Analyst, StockCharts.com
SECTOR ROTATIONS TURN POSITIVE ... Over the last couple of days, I've been writing about sector rotations that normally take place in a market upturn that's often accompanied by falling energy prices. Earlier in the week I wrote about how semiconductors were leading the technology-dominated Nasdaq...
READ MORE
MEMBERS ONLY

CRUDE OIL TESTS 200-DAY AVERAGE -- ENERGY STOCKS ARE ALSO TESTING LONG-TERM SUPPORT LINES
by John Murphy,
Chief Technical Analyst, StockCharts.com
CRUDE IS STILL TESTING 200-DAY AVERAGE ... The last time I showed the chart of crude oil, it was testing major support at its 200-day moving average. That's still the case. Chart 1 (plotted through Monday) shows that crude is also testing the low hit in early...
READ MORE
MEMBERS ONLY

WHY TECHNOLOGY LEADERSHIP IS IMPORTANT -- MORE ON SECTOR ROTATONS AT DIFFERENT STAGES OF THE BUSINESS CYCLE
by John Murphy,
Chief Technical Analyst, StockCharts.com
WHY TECHNOLOGY LEADERSHIP IS IMPORTANT... I wrote yesterday about the technology-dominated Nasdaq market starting to show better relative strength than the S&P 500. I've also written many times that upside technology leadership is a vital ingredient in any serious stock market rally. I'll...
READ MORE
MEMBERS ONLY

MONEY IS ROTATING OUT OF BASIC MATERIALS AND ENERGY INTO SEMICONDUCTORS
by John Murphy,
Chief Technical Analyst, StockCharts.com
MATERIALS AND ENERGY ARE WEEK'S WORST ... There appears to be some group rotations going on in the market that's been sparked by the recent drop in commodity-related groups like basic materials and energy. Gold stocks have also fallen sharply. In fact, those were last week&...
READ MORE
MEMBERS ONLY

UTILITIES LOSE SAVE HAVEN STATUS -- DOW COMPOSITE INDEX BREAKS 200-DAY LINE
by John Murphy,
Chief Technical Analyst, StockCharts.com
UTILITY PLUNGE ENDS SAFE HAVEN STATUS ... With the market apparently starting another downleg, even the safe haven status of utilities appears to have ended. Chart 1 shows why. The Dow Utilities plunged over 13 points earlier today to shatter their 50-day moving average. That puts all three Dow averages...
READ MORE
MEMBERS ONLY

RECENT DOWNTURN SUGGESTS BEAR MARKET BOUNCE MAY HAVE ENDED -- NYSE RETESTING 200-DAY AVERAGE
by John Murphy,
Chief Technical Analyst, StockCharts.com
DOW AND RUSSELL 2000 STILL BELOW 200-DAY LINES ... Despite the recent market bounce (which may be ending), the market still has major bearish bias. Charts 1 and 2 show the Dow Industrials (Chart 1) and the Russell 2000 Small Cap Index (Chart 2) unable to exceed their January lows...
READ MORE
MEMBERS ONLY

WHY A RISING DOLLAR ISN'T GOOD FOR COMMODITIES AND STOCKS AND MAY MEAN A WEAKER GLOBAL ECONOMY
by John Murphy,
Chief Technical Analyst, StockCharts.com
DOLLAR INDEX ACHIEVES BULLISH BREAKOUT ... The US Dollar Index broke out on Thursday to a new 2005 high. It also broke through its 200-day moving average. I discussed a more positive outlook for the dollar's intermediate-term trend on Wednesday and some ripple effects an upside breakout...
READ MORE
MEMBERS ONLY

MARCH TRADE DEFICIT NARROWS AS DOLLAR TESTS TOP OF 2005 TRADING RANGE -- WHY AN UPSIDE BREAKOUT WOULDN'T BE GOOD FOR STOCKS OR COMMODITIES
by John Murphy,
Chief Technical Analyst, StockCharts.com
FOREIGN CURRENCIES FALL... The U.S. trade deficit for March was much narrower than expected. That's giving a boost to the U.S. dollar and is pushing foreign currencies lower. Charts 1 and 2 show the Canadian Dollar and the Euro in danger of falling below their 200-...
READ MORE
MEMBERS ONLY

MAKING A BULLISH CASE FOR HEALTHCARE -- BIOTECHS ARE FINALLY TURNING HIGHER
by John Murphy,
Chief Technical Analyst, StockCharts.com
HEALTHCARE IS TOP APRIL GAINER ... Last Monday I wrote about healthcare being the top sector gainer for the month of April (May 02, 2005). I've also written several bullish articles on the revival of this group over the last couple of months. I believe that healthcare is the...
READ MORE
MEMBERS ONLY
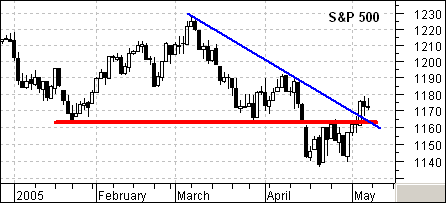
THE LEADERS AND THE LAGGARDS
The S&P 500 can do it, but the Nasdaq and the Small-caps can't do it. Or at least not just yet. Led by Finance, the S&P 500 broke above its late April high and resistance at 1165. However, the Nasdaq and S&...
READ MORE
MEMBERS ONLY
VOLATILITY STILL HISTORICALLY LOW
The CBOE Volatility Index (VIX) is a measure of the implied volatility of SPX index options. (According to the CBOE web site, "volatility is a measure of the fluctuation in the market price of the underlying security.") As a practical matter, the VIX measures the amount of fear...
READ MORE
MEMBERS ONLY
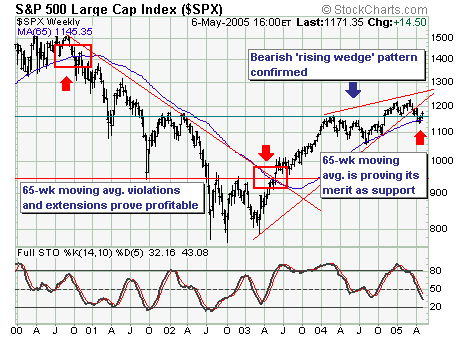
A SIMPLE ROADMAP
From a structural and fundamental point-of-view, things are bearish right now; however, the technical and sentiment action surrounding recent price gains is quite constructive; thus a larger rally appears underway. We are bullish but only insofar as the 65-week moving average of the S&P 500...
READ MORE
MEMBERS ONLY
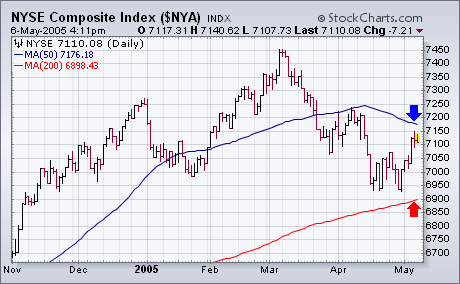
A LOOK AT THE NYSE COMPOSITE INDEX ...
Every time I write about a certain stock market index, I'm asked why I don't write about some of the others. I generally try to spread my coverage around to all the major stock indexes, but can't cover them all at once. I also...
READ MORE
MEMBERS ONLY
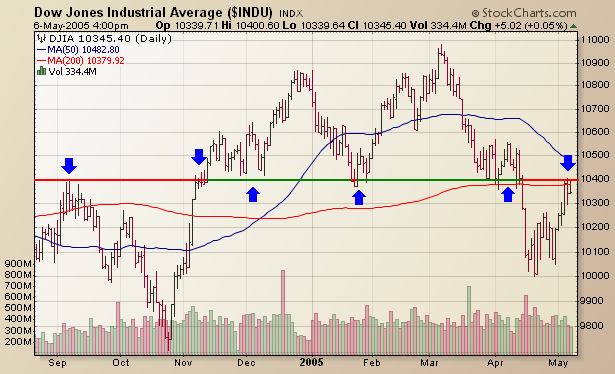
Hello Fellow ChartWatchers!
After its big drop in mid-April, the Dow has rallied back to a classic resistance level now: 10400. Just look at the chart:
This is one of those "support-becomes-resistance" levels that has had a big impact on the market in the past (blue arrows) and...
READ MORE
MEMBERS ONLY

ANOTHER LOOK AT BULLISH PERCENTAGE READINGS -- DOW AND S&P TEST MAJOR SUPPORT -- NASDAQ IN DOWNTREND
by John Murphy,
Chief Technical Analyst, StockCharts.com
FIRST A LOOK AT THE NYSE COMPOSITE INDEX ... Every time I write about a certain stock market index, I'm asked why I don't write about some of the others. I generally try to spread my coverage around to all the major stock indexes, but can'...
READ MORE
