MEMBERS ONLY

THE S&P 500 FROM THREE TIME DIMENSIONS -- SHORT-TERM TREND IS NEUTRAL WHILE LONG-TERM SIGNALS ARE MIXED

by John Murphy,
Chief Technical Analyst, StockCharts.com
DAILY CHART SHOWS NEUTRAL TREND ... In order to understand why the market is caught in a lot of cross-currents right now, it's necessary to look at it from different time perspectives. It's not enough to just consult the daily chart. It's necessary to...
READ MORE
MEMBERS ONLY

FINANCIALS LEAD MARKET RALLY -- MARKET INDEXES EXCEED INITIAL RESISTANCE LEVELS -- LIGHTEN UP ON BEAR POSITIONS
by John Murphy,
Chief Technical Analyst, StockCharts.com
FINANCIAL SPDR EXCEEDS 200-DAY LINE ... I've written several times recently that if the market were going to stage a rally, one of the groups that would lead it higher would be the financials. And that's what happened today. In a strong market day, financials were...
READ MORE
MEMBERS ONLY

FED TIGHTENS AS EXPECTED -- MARKET STILL TESTING OVERHEAD RESISTANCE -- DROP IN OIL WEIGHS ON ENERGY SECTOR
by John Murphy,
Chief Technical Analyst, StockCharts.com
CRUDE NEARING TEST OF 200-DAY AVERAGE ... Crude oil prices fell over a dollar today and ended back under the $50 level. That continues the short-term downtrend that started in mid-March. Chart 1 shows that crude is nearing a test of its 200-day moving average. It bounced...
READ MORE
MEMBERS ONLY

HEALTHCARE TAKES TOP SPOT IN APRIL -- DRUG STOCKS GET BETTER -- DNA EXAGGERATES BIOTECH BOUNCE -- ABI BREAKS OUT -- WATCHING RESISTANCE LEVELS
by John Murphy,
Chief Technical Analyst, StockCharts.com
HEALTHCARE SPDR MOVES AHEAD OF UTILITIES... Chart 1 shows the performance of the nine sector SPDRs for the month of April relative to the S&P 500 which is the zero line. Healthcare moved slightly ahead of the utilities as the best sector performer for April. Financials and consumer...
READ MORE
MEMBERS ONLY

WEAK GDP REPORT HURTS STOCKS BUT HELPS BONDS -- TIPS LEAD BOND RALLY -- WHY COMMODITY DOWNTURNN IS BAD FOR STOCKS -- LOSS OF ENERGY LEADERSHIP ISN'T GOOD EITHER UNTIL SOMETHING ELSE TURNS UP
by John Murphy,
Chief Technical Analyst, StockCharts.com
FIRST QUARTER GDP CONFIRMS WEAKENING ECONOMY ... The economic news keeps getting worse. Consumer confidence is falling as are durable goods orders, while inventories are building. The drop in consumer confidence suggests a drop in consumer spending (which is two-thirds of the economy). The drop in durable good orders reveals...
READ MORE
MEMBERS ONLY

DROP IN BOND YIELDS BOOSTS RATE-SENSITIVE STOCKS LIKE UTILITIES AND REITS -- OVERSOLD FINANCIALS ARE REBOUNDING
by John Murphy,
Chief Technical Analyst, StockCharts.com
BOND YIELDS CONTINUE TO DROP ... Two things happened today that help explain the continuing drop in bond yields -- and another jump in bond prices. One is the plunge in crude oil futures, which is anti-inflationary. Another is the big drop in durable goods orders, which is more evidence of...
READ MORE
MEMBERS ONLY

ENERGY STOCKS DROP WITH OIL -- OIL SERVICE INDEX UP AGAINST LONG-TERM RESISTANCE
by John Murphy,
Chief Technical Analyst, StockCharts.com
CRUDE DROPS HEAVILY... A big buildup in crude oil inventories has pushed the key commodity down by $1.85 in afternoon trading. Chart 1 shows crude slipping back under its 50-day moving average. It's still above its mid-April low, however, at $51. The drop in crude...
READ MORE
MEMBERS ONLY

GOLD SHARES BREAK LONG-TERM SUPPORT LINES AS NEWMONT TUMBLES
by John Murphy,
Chief Technical Analyst, StockCharts.com
GOLD STILL OVER 200-DAY LINE, BUT XAU ISN'T ... A bounce in the U.S. dollar is starting to put some downward pressure on the price of gold. The last time I looked at the gold market was on April 18 when it was bouncing off its 200-...
READ MORE
MEMBERS ONLY

MARKET SELLS OFF ON RISING VOLUME -- TECHNICAL BOUNCE COULD BE ENDING
by John Murphy,
Chief Technical Analyst, StockCharts.com
NASDAQ 100 DROPS ON HEAVIER VOLUME... Last evening I wrote about the lack of upside progress by the Nasdaq market and also the lack of upside volume, which has been a problem for the entire market. Things took a turn for the worse today. The Nasdaq 100 Shares (QQQQ) helped...
READ MORE
MEMBERS ONLY

RUSSELL 2000 CAN'T GET BACK OVER ITS 200-DAY LINE - RECENT MARKET BOUNCE LOOKS LIKE A BEAR FLAG AND A WAVE 4 WHICH MAY BE ABOUT OVER
by John Murphy,
Chief Technical Analyst, StockCharts.com
HEALTH CARE HOLDING UP OK ... One of our readers asked if the healthcare group was still holding up. The answer is yes. Chart 1 shows the Health Care Sector SPDR (XLV) still trading over its 50-day moving average. Its relative strength line just recently hit a new high for...
READ MORE
MEMBERS ONLY

NASDAQ NOT SHOWING MUCH BOUNCE -- SO FAR THE MARKET REBOUND HASN'T BROKEN ANY RESISTANCE BARRIERS AND HAS TAKEN PLACE ON LOW VOLUME
by John Murphy,
Chief Technical Analyst, StockCharts.com
NASDAQ STILL HOLDS A KEY TO THE MARKET ... The technology-dominated Nasdaq has been a real problem for the broader stock market. The relative weakness in the Nasdaq since the end of the last year has been one of the big negative factors weighing on the market. If the market...
READ MORE
MEMBERS ONLY

YEN JUMPS TO TWO-MONTH HIGH ON JAPANESE APOLOGY AND GREENSPAN COMMENTS ON THE YUAN -- WHY A HIGHER YUAN MIGHT NOT BE THAT GOOD FOR THE U.S.
by John Murphy,
Chief Technical Analyst, StockCharts.com
JAPANESE APOLOGY BOOSTS YEN... Over the last week I wrote about the U.S. Dollar starting to roll over from its 2005 high and its 200-day moving average. At the same time, the Euro was bouncing from its 200-day moving average. I took that to mean that the...
READ MORE
MEMBERS ONLY

KEY CHART LEVELS ON DAILY S&P 500 CHART -- WEEKLY CHART IS STILL NEGATIVE -- MONTHLY CHART HASN'T GIVEN MAJOR SELL SIGNAL, BUT IT'S GETTING CLOSE
by John Murphy,
Chief Technical Analyst, StockCharts.com
KEEP YOUR EYE ON THE KEY CHART LEVELS ... It's important to keep your eyes on the key chart levels. That helps keep things in their proper perspective. It also prevents us from getting too caught up in day-to-day market swings and conflicting signals from short-term...
READ MORE
MEMBERS ONLY

HIGH CORE CPI INFLATION WEAKENS MARKET -- BROKERAGE INDEX BREAKS 200-DAY AVERAGE -- SOX RALLY FADES -- TIPS RALLY -- OVERSOLD DOESN'T MEAN MUCH IN A FALLING MARKET
by John Murphy,
Chief Technical Analyst, StockCharts.com
CORE CPI HITS HIGHEST LEVEL IN TWO YEARS ... Inflation starts to build in three stages. The first stage occurs when raw materials (commodities) start to rise. That started a couple of years ago. The second stage occurs with the Producer Price Index (which is what companies pay to buy those...
READ MORE
MEMBERS ONLY

SOX RALLY FADES -- BROKERAGE INDEX TESTING 200-DAY AVERAGE -- S&P 500 MEETING RESISTANCE AT 200-DAY AVERAGE --
by John Murphy,
Chief Technical Analyst, StockCharts.com
SOX RALLY FADES... Despite a strong opening in Intel, the bounce in the Semiconductor (SOX) Index hasn't been very impressive. In fact, it's currently down for the day. Chart 1 puts the SOX in some perspective. The good news is that it's bouncing off...
READ MORE
MEMBERS ONLY

MARKET MANAGES MODEST BOUNCE BUT ON LOW VOLUME -- DOLLAR DROP BOOSTS GOLD AND OTHER COMMODITIES
by John Murphy,
Chief Technical Analyst, StockCharts.com
SEMICONDUCTOR HOLDERS BOUNCE ON LIGHTER VOLUME... Technology analysts read a lot into today's bounce in the semiconductor group. Chart 1 shows part of the reason why. The Semiconductor Holders (SMH) bounced off their January low. The problem is they did it on lower volume. That's not...
READ MORE
MEMBERS ONLY

FALLING BOND YIELDS REFLECT MONEY MOVING OUT OF STOCKS AND INTO BONDS -- FALLING RATES ALSO HURT THE DOLLAR AND ARE HELPING GOLD -- REITS ARE ALSO ATTRACTING NEW MONEY
by John Murphy,
Chief Technical Analyst, StockCharts.com
BOND YIELDS CONTINUE TO DROP ... Whether or not it's based on fears of a slowing economy -- or today's relatively benign core PPI inflation report -- bond yields are falling sharply as bond prices rise. Chart 1 shows the 10-year T-note yield falling further beneath its...
READ MORE
MEMBERS ONLY

GLOBAL MARKETS USUALLY FALL TOGETHER -- JAPAN TAKES THE BIGGEST HIT -- A FALLING YEN HAS ALSO HURT THE EWJ
by John Murphy,
Chief Technical Analyst, StockCharts.com
NO DIVERSIFICATION ON THE DOWNSIDE ... Over the last few years, foreign markets have done a bit better than the U.S. market primarily because of the falling dollar. Having said that, however, global stock markets have been and remain highly correlated. The three lines in Chart 1 make that point....
READ MORE
MEMBERS ONLY

DOLLAR PULLS BACK FROM TOP OF TRADING RANGE -- GOLD AND EURO BOUNCE OFF 200-DAY LINES -- XAU TESTING LONG-TERM TRENDLINE SUPPORT -- BOND YIELDS AND GLOBAL MARKETS DROP
by John Murphy,
Chief Technical Analyst, StockCharts.com
DOLLAR INDEX BACKS OFF FROM RESISTANCE... The U.S. Dollar has established an intermediate-term trading range since the start of 2005 within a long-term downtrend. Chart 1 shows the Dollar Index (plotted through Friday) starting to back off from a test of its 200-day moving average and...
READ MORE
MEMBERS ONLY
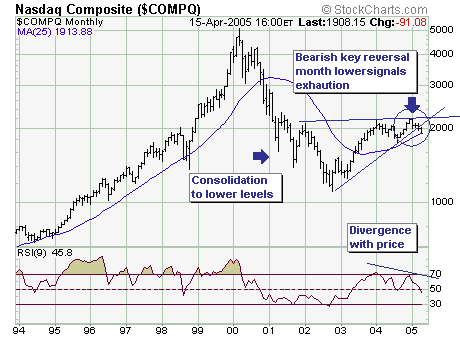
DOWNSIDE TARGET FOR THE NASDAQ
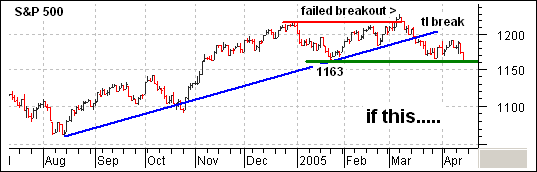
The current pattern at work in the Nasdaq looks quite similar to prior patterns for the S&P 500 and Dow Transports. Both of these indices had extended advances, failed to hold a breakout to new highs, broke trendline support and then continued to support from the prior low...
READ MORE
MEMBERS ONLY
S&P 600 SMALL-CAP NEW HIGHS and NEW LOWS
At DecisionPoint.com we have recently added a chart of S&P 600 Small-Cap 52-week new highs and new lows (NHNL). (We also have NHNL charts of the S&P 500, S&P 400 Mid-Cap, NYSE, and Nasdaq). This allows us to examine and...
READ MORE
MEMBERS ONLY
"MINI-CRASH" FOR THE NASDAQ
From Tuesday's close last week; the Nasdaq Composite ($COMPQ) has declined in mini-crash' fashion: down -4.8%. The question is whether there are further declines ahead or whether a sustainable rally will develop back towards the highs or even new highs. An instructive chart to this...
READ MORE
MEMBERS ONLY
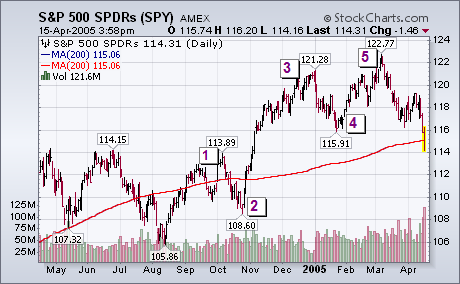
HOW FAR DOWN?
After this week's breakdown, there can be little doubt that the cyclical bull market that started in October 2002 has ended. The question now is how far down can the market drop. The daily bars in the chart below show the S&P 500 SPDR breaking its...
READ MORE
MEMBERS ONLY
Hello Fellow ChartWatchers!
With the markets down for the past three days, the Internet is all abuzz with predictions and prognostications about what's going to happen next. As you try to sort it all out, remember that charts don't lie. Charts don't have an agenda. And charts...
READ MORE
MEMBERS ONLY

HEALTHCARE INVESTORS ARE THE ONLY ONES FEELING GOOD -- MARKET AVERAGES BREAK DOWN -- VIX BREAKS OUT -- NEXT DOWNSIDE TARGET IS AUGUST LOW
by John Murphy,
Chief Technical Analyst, StockCharts.com
HEALTHCARE INVESTORS SHOULD BE FEELING BETTER... While the rest of the market broke down this week, the only sector to end up in the black was healthcare. Chart 1 shows the Health Care SPDR (XLV) ending the week at a new recovery high. Its rising relative strength line also shows...
READ MORE
MEMBERS ONLY

BEAR MARKET FUNDS ARE BREAKING OUT TO THE UPSIDE -- THEY OFFER THE BEST WAY TO PROFIT IN A BEAR MARKET
by John Murphy,
Chief Technical Analyst, StockCharts.com
REVISITING RYDEX URSA ... Back on April 5 I wrote a piece on bear funds (April 05, 2005). Part of the headline was that no major buy signal had taken place. That's no longer true. Last Friday I recommended buying (or adding to) any bear fund that closed over...
READ MORE
MEMBERS ONLY

CYCLICAL BREAKDOWN IS BEARISH FOR THE MARKET AND THE ECONOMY -- WHY CHARTS WORK BETTER THAN ECONOMIC ANALYSIS -- DOW FALLS TO 2005 LOW ON RISING VOLUME -- BEAR MARKET FUNDS SHOULD LOOK GOOD
by John Murphy,
Chief Technical Analyst, StockCharts.com
CYCLICAL STOCKS TAKE A BEATING ... One of the best ways to predict the direction of the economy is to follow the trend of major market averages. That's because the market is one of the best economic indicators of all. Since the start of 2005, those market averages have...
READ MORE
MEMBERS ONLY

TRANSPORTS AND CYCLICALS LEAD MARKET LOWER -- DOW HITS NEW 2005 LOW -- THAT'S GOOD FOR BEAR FUNDS
by John Murphy,
Chief Technical Analyst, StockCharts.com
TRANSPORTS TUMBLE 3% ... Last Friday I wrote about the Dow Transports falling beneath their 50-day moving average and being pulled down by rails and truckers. I also warned about how weakness in the transports was a negative sign for both the stock market and the economy. As for the...
READ MORE
MEMBERS ONLY

CHIPS AND MATERIALS LEAD MARKET LOWER
by John Murphy,
Chief Technical Analyst, StockCharts.com
CHIPS CONTINUE TO FALL ... Earlier today I wrote about the need to rotate existing funds already in the stock market -- as opposed to putting new money into the market. I wrote that I favored the former (rotating) but not the latter (new money). I wrote a week ago that some...
READ MORE
MEMBERS ONLY

ENERGY ETFS BREAK 50-DAY LINES -- MARKET GIVES BACK YESTERDAY'S GAINS -- WHY FALLING COMMODITIES MAY NOT HELP STOCKS
by John Murphy,
Chief Technical Analyst, StockCharts.com
NO FOLLOW-THROUGH FROM YESTERDAY ... When a market records an up day like yesterday -- especially on heavy volume -- it's important to watch for upside follow through. In fact, the market gave back most of yesterday's gains. The only positive factor (and it's a weak...
READ MORE
MEMBERS ONLY

ANOTHER LOOK AT SOME INDIVIDUAL DRUG LEADERS -- BMY HITS NEW 52-WEEK HIGH -- NEW MONEY VERSUS ROTATING MONEY
by John Murphy,
Chief Technical Analyst, StockCharts.com
BRISTOL MYERS SQUIBB HITS 52-WEEK HIGH ... Last Tuesday I wrote a piece on the revival of drug stocks and the healthcare sector which were starting to show market leadership April 05, 2005. Part of that was due to their generally defensive qualities. One of the three drug leaders that...
READ MORE
MEMBERS ONLY

DRUGS AND HEALTHCARE ARE BREAKING OUT
by John Murphy,
Chief Technical Analyst, StockCharts.com
MEDICAL ETFS HIT SIX-MONTH HIGHS ... The Pharm Holders (PPH) are the day's top Exchange Traded Fund. Chart 1 shows the PPH breaking through its recent highs to reach the highest level in six months. Some of the day's top percentage gainers are Merck, Lilly, Schering...
READ MORE
MEMBERS ONLY

200-DAY MOVING AVERAGES HOLD -- MARKET SCORES UPSIDE REVERSAL ON BIG VOLUME -- DROP IN RATES AND OIL ALSO HELP
by John Murphy,
Chief Technical Analyst, StockCharts.com
FED MINUTES PUSH BOND YIELDS LOWER... The Fed minutes from its last meeting calmed the financial markets and led to an impressive rebound in the stock market. Two of the intermarket factors that turned the market around in the afternoon were a drop in bond yields and crude oil. Chart...
READ MORE
MEMBERS ONLY

TRANSPORTS TUMBLE -- RUSSELL 2000 SMALL CAP INDEX LEADS MARKET LOWER -- MARKET INDEXES TURN DOWN AT 50-DAY AVERAGES -- TAKE A LOOK AT BEAR FUNDS
by John Murphy,
Chief Technical Analyst, StockCharts.com
TRANSPORTS LOSE 3% AND BREAK SUPPORT LINE... The market lost another one of its leaders -- the transportation group. The Dow Transports tumbled more than 3% today and was the day's worst group. What's worse the transportation index tumbled beneath its 50-day moving average in very...
READ MORE
MEMBERS ONLY

ALCOA LEADS MATERIALS HIGHER WHILE WAL MART LEADS RETAILERS LOWER -- THOSE TWO THINGS ARE LINKED -- PFIZER DROP SHOWS VALUE OF DIVERSIFICATION
by John Murphy,
Chief Technical Analyst, StockCharts.com
ALCOA GAPS HIGHER WHILE WAL MART FALLS... Rising aluminum prices have given a big boost to the shares of Alcoa. A positive earnings report is pushing the big aluminum producer over a dollar higher in morning trading. It's also one of the big board's most actively...
READ MORE
MEMBERS ONLY

RISING ENERGY AND FALLING TECHNOLOGY WEIGH ON MARKET -- LOW VOLUME MARKET BOUNCES AREN'T A SIGN OF STENGTH -- USING EQUIVOLUME TO COMPARE PRICE AND VOLUME
by John Murphy,
Chief Technical Analyst, StockCharts.com
S&P SPDR TESTING 50-DAY AVERAGE ON LOW VOLUME... I recently wrote about the possibility of a short-term bounce in the S&P 500 to its 50-day moving average. Chart 1 shows the S&P 500 SPDR (SPY) touching that resistance barrier twice over...
READ MORE
MEMBERS ONLY

CHARTING BEAR FUNDS WITH PROFUNDS CARPET -- CHARTING A COUPLE OF ULTRASHORT FUND LEADERS -- A LONGER LOOK AT RYDEX URSA FUND -- NO MAJOR BUY SIGNAL YET IN BEAR MARKET FUNDS
by John Murphy,
Chief Technical Analyst, StockCharts.com
WHERE TO FIND PROFUND BEAR FUNDS... I promised yesterday to look at a couple of ProFunds Bear funds today. To find them, click on Market Carpets (on main menu) and then ProFunds Carpet. Click on Inverse (at the bottom left) and you'll see eight different bear funds. Chart...
READ MORE
MEMBERS ONLY

CHARTS OF STRONGEST DRUG STOCKS -- PFIZER ISN'T ONE OF THEM -- JOHNSON & JOHNSON IS -- SO IS ABT AND BMY
by John Murphy,
Chief Technical Analyst, StockCharts.com
FIRST PFIZER ... Because of its large size, Pfizer carries a lot of weight in the drug and healthcare groups. That's why its price jump today is helping to spark buying in both groups. But, in my opinion, it's not one of the more attractive drug stocks...
READ MORE
MEMBERS ONLY

PFIZER SPARKS BUYING IN DRUGS AND HEALTHCARE WHICH ARE DAY'S TOP ETFS -- ANOTHER DEFENSIVE GROUP TO CONSIDER
by John Murphy,
Chief Technical Analyst, StockCharts.com
PHARM HOLDERS ARE DAY'S TOP ETF... Pfizer's prediction of double digit growth next year (based on some serious cost-cutting) has sparked some serious buying in pharmaceutical stocks and the healthcare sector. As a result, Pharm Holders (PPH) are the day's top performing ETF....
READ MORE
MEMBERS ONLY

RYDEX URSA BEAR FUND TESTS JANUARY HIGH -- SO DOES THE VIX -- OEX BOUNCES OFF JANUARY LOW AS OIL PULLS BACK -- DOLLAR NEARS TEST OF FEBRUARY HIGH -- GOLD STILL ON THE DEFENSIVE
by John Murphy,
Chief Technical Analyst, StockCharts.com
RYDEX URSA TESTING JANUARY HIGH ... On Friday I repeated an earlier idea of buying a bear market mutual fund to actually benefit from a falling stock market. The chart of a bear market fund is just the inverse of a chart of the market. With the Dow and the S&...
READ MORE
