MEMBERS ONLY
GOLD STOCKS STILL TESTING LONG-TERM SUPPORT - TAKING WHAT THE MARKET GIVES US
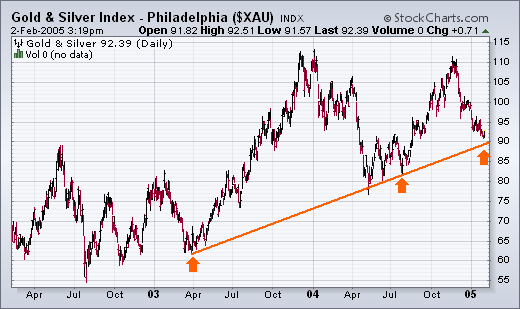
GOLD INDEX STILL TESTING TRENDLINE SUPPORT... Back on January 10, I wrote about the Gold & Silver Index (XAU) being in a support zone defined by the rising trendline shown in Chart 1. The trendline starts in April 2003 and is drawn under the April/July 2004 lows (see arrows)...
READ MORE
MEMBERS ONLY
Hello Fellow ChartWatchers!
Today we have a special mid-week edition of ChartWatchers for you. Yesterday, John Murphy published a column and the long term outlook for Gold and the Market as a whole. The column received a very large number of positive comments from his subscribers and we thought we'd...
READ MORE
MEMBERS ONLY

THE DOLLAR INDEX IS RALLYING FROM LONG-TERM SUPPORT AND OVERSOLD CONDITION -- IT'S NEARING A TEST OF MAJOR RESISTANCE AT 85

by John Murphy,
Chief Technical Analyst, StockCharts.com
DOLLAR INDEX NEARS LONG-TERM CHART SUPPORT... I've gotten a lot of requests to update my views on the dollar. Before doing that, however, I need to point out that nothing that the dollar has done since the start of the new year has been a surprise. In...
READ MORE
MEMBERS ONLY

GOLD STOCKS STILL TESTING LONG-TERM SUPPORT, BUT HAVEN'T GIVEN P&F BUY SIGNAL YET -- TAKING WHAT THE MARKET GIVES US
by John Murphy,
Chief Technical Analyst, StockCharts.com
GOLD INDEX STILL TESTING TRENDLINE SUPPORT... Back on January 10, I wrote about the Gold & Silver Index (XAU) being in a support zone defined by the rising trendline shown in Chart 1. The trendline starts in April 2003 and is drawn under the April/July 2004 lows (see arrows)...
READ MORE
MEMBERS ONLY

MATERIALS ETF CLEARS 50-DAY LINE -- ROHM AND HAAS SURGES -- MORE OIL INDEXES BREAKOUT -- GOLD STOCKS STILL FLAT
by John Murphy,
Chief Technical Analyst, StockCharts.com
MATERIALS ETF HITS MONTHLY HIGH ... Second only to energy, basic material stocks are showing good relative strength. Chart 1 shows the Materials Select Sector SPDR (XLB) trading back over its 50-day average and also at the highest level since the first week of January. Its relative strength line along...
READ MORE
MEMBERS ONLY

S&P 500 BOUNCES OFF 100-DAY LINE -- IT LOOKS LIKE A FIFTH WAVE UP IS STARTING
by John Murphy,
Chief Technical Analyst, StockCharts.com
S&P 500 CLEARS 50-DAY AVERAGE ... After breaking through its January down trendline earlier in the day, the S&P 500 also managed to close just over its 50-day moving average today. Combined with a pickup in trading volume on the big board, it was a...
READ MORE
MEMBERS ONLY

MARKET BREADTH IS STARTING TO IMPROVE
by John Murphy,
Chief Technical Analyst, StockCharts.com
NYAD LINE MAINTAINS ITS UPTREND, NEW HIGHS ARE OUTPACING NEW LOWS AGAIN... The NYSE Advance-Decline line has been rising for several months. That's normally a good sign for the market. Historically, the AD line usually peaks before the market does. During January, the AD line started to...
READ MORE
MEMBERS ONLY

SMALL AND MIDCAPS ARE LEADING RALLY ATTEMPT -- S&P 500 BREAKS JANUARY DOWN TRENDLINE
by John Murphy,
Chief Technical Analyst, StockCharts.com
S&P 500 IS BREAKING DOWN TRENDLINE... The market's attempt to stage an oversold rally is beginning to gain more traction. The S&P 500 Large Cap Index is breaking through its January down trendline which was one of the first tasks it had to accomplish...
READ MORE
MEMBERS ONLY

MARKET BOUNCE ATTRACTS LITTLE VOLUME -- OIL CLOSES A DOLLAR HIGHER AFTER EARLY SETBACK -- ENERGY SECTOR RECOVERS
by John Murphy,
Chief Technical Analyst, StockCharts.com
OIL RECOVERS FROM EARLY SELLOFF... Crude oil opened sharply lower today and put energy stocks under early selling pressure. The drop in oil also gave an early boost to the stock market. By the afternoon, however, crude had turned a big loss into a dollar gain. Chart 1 shows that...
READ MORE
MEMBERS ONLY

MARKET ATTEMPTS REBOUND FROM OVERSOLD CONDITION -- SPY AND QQQQ EXCEED INITIAL RESISTANCE LEVELS
by John Murphy,
Chief Technical Analyst, StockCharts.com
S&P SPDR OPENS ABOVE RESISTANCE... Yesterday's Iraq election -- and a drop in crude oil this morning -- led to a higher open today. A short-term oversold condition also helped. The 30 minute bars in Chart 1 show the S&P 500 SPDRs (SPY) opening at...
READ MORE
MEMBERS ONLY

MONTHLY MARKET TREND IS STILL UP, BUT JUST BARELY -- WEEKLY MACD LINES TURN NEGATIVE
by John Murphy,
Chief Technical Analyst, StockCharts.com
MONTHLY AND WEEKLY SIGNALS ARE MORE IMPORTANT THAN DAILIES... I've been emphasizing daily (and hourly) charts recently to study the January downturn. While daily charts show the short-term trend, weekly and monthly charts are the ones that determine the major trend of a market. To study that...
READ MORE
MEMBERS ONLY

BIOTECHS AND DRUGS ARE WEAKENING
by John Murphy,
Chief Technical Analyst, StockCharts.com
DRUG ETF BACK UNDER 50-DAY LINE ... Drug stocks are coming under heavy selling pressure late in the week. As a result, the Pharm Holders (PPH) have fallen well beneath its 50-day moving average. [That's one reason to consider doing some selling -- or, at the very least,...
READ MORE
MEMBERS ONLY

SLOWER ECONOMY IN FOURTH QUARTER HELPS BONDS BUT HURTS STOCKS -- DOLLAR IS MIXED AS GOLD HOLDS STEADY
by John Murphy,
Chief Technical Analyst, StockCharts.com
BOND YIELDS FALL AS PRICES RISE... Today's report that growth in the U.S. economy slowed to 3.1% in the fourth quarter is having a predictable effect on bonds and stocks today. It's helping bonds and hurting stocks. Chart 1 shows the Ten year T-...
READ MORE
MEMBERS ONLY

STOCK INDEX ETFS ARE STILL HOLDING ABOVE SUPPORT LEVELS AND ARE OVERSOLD -- WATCHING THE QQQQ FOR SIGNS OF A BOTTOM
by John Murphy,
Chief Technical Analyst, StockCharts.com
STOCK INDEX ETFS STILL HOLDING ABOVE SUPPORTS... The three stock index ETFs shown below are in short-term oversold conditions. In addition, all three are still above important support levels which I'm defining as their September/October peaks. As long as those supports hold, there's room...
READ MORE
MEMBERS ONLY

WHY OIL SERVICE IS MY FAVORITE GROUP AND WHY IT REPRESENTS THE BEST ENERGY VALUE
by John Murphy,
Chief Technical Analyst, StockCharts.com
OIL SERVICE STOCKS LOOK CHEAPER... I wrote yesterday that energy was my favorite market sector for the year and that oil service was my favorite group within that sector. Here's why. The three charts below show the three energy indexes that I track. The AMEX Oil Index (XOI)...
READ MORE
MEMBERS ONLY

ENERGY, STAPLES, AND UTILITY LEADERS
by John Murphy,
Chief Technical Analyst, StockCharts.com
DOW UTILITIES HIT NEW RECOVERY HIGH ... Since the start of the new year, I've written about new leadership by consumer staples and energy. More recently, I wrote that utilities should be next in line to start showing upside leadership. All three groups are among today's leaders...
READ MORE
MEMBERS ONLY

2005 DOESN'T LOOK LIKE A GOOD YEAR
by John Murphy,
Chief Technical Analyst, StockCharts.com
2005 ANNUAL FORECAST MEETING... I'm heading into New York this afternoon to be a panelist for the 2005 Annual Forecast Meeting which is held each year by the Market Technicians Association. Some of the topics discussed will be: Where do we stand in the presidential cycle? Will 2005...
READ MORE
MEMBERS ONLY

EARLY BOUNCE FADES -- VERY LITTLE HAS CHANGED
by John Murphy,
Chief Technical Analyst, StockCharts.com
S&P 500 SPDRS FADE... Although the S&P 500 SPDRs closed higher today, they ended well off their earlier high. The increase in volume was pretty much concentrated in the first hour of trading. After that, trading trailed off. In my view, very little changed in the...
READ MORE
MEMBERS ONLY

JOHNSON & JOHNSON LEADS DOW HIGHER AND NEARS 2002 HIGH -- SARA LEE LOSES 7%
by John Murphy,
Chief Technical Analyst, StockCharts.com
SARA LEE FALLS 7% ... Since the start of December, I've highlighted the relatively strong performance of Sara Lee as a leader in the consumer staples group. Just last Thursday I showed the stock breaking out to a new four-year high. Although its quarterly profit came in higher,...
READ MORE
MEMBERS ONLY
WHO STARTED THIS MESS ANYWAY?
January and 2005 have not been good for the bulls. After a strong finish in 2004, stocks were hit with strong selling pressure to begin the year and have yet to recover. A look into November and December reveals early weakness in two key groups. More importantly, traders can turn...
READ MORE
MEMBERS ONLY
OEX PUT/CALL RATIO SAYS BOTTOM NEAR
The Equity and OEX Put/Call Ratios generally signal overbought and oversold conditions that help identify price tops and bottoms; however, sometimes the OEX Put/Call Ratio will invert relative to the Equity Put/Call Ratio. At these times the inversion signals the opposite of what we would normally expect....
READ MORE
MEMBERS ONLY
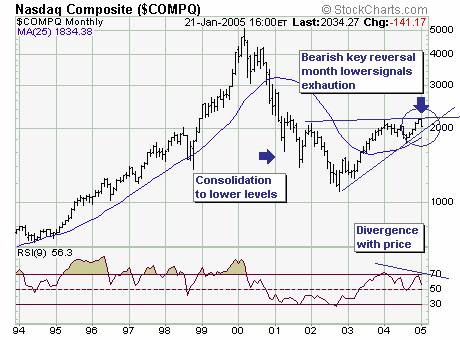
JANUARY DECLINE GAINING IMPORTANCE
The January decline to date is gaining in importance; if prices remain at current to lower levels through the next six trading sessions then a bearish key reversal month' will form. This would signal exhaustion' of the uptrend, with any and all rallies considered selling opportunities. The last...
READ MORE
MEMBERS ONLY
THE BUILD OUT CONTINUES
THE BUILD OUT CONTINUES - In 2004, StockCharts.com spent over $750,000 on improving our technology infrastructure - things like servers, routers, switches, data, and all the things it takes to get you the best charts on the web as quickly as possible. We're not done yet however. You...
READ MORE
MEMBERS ONLY
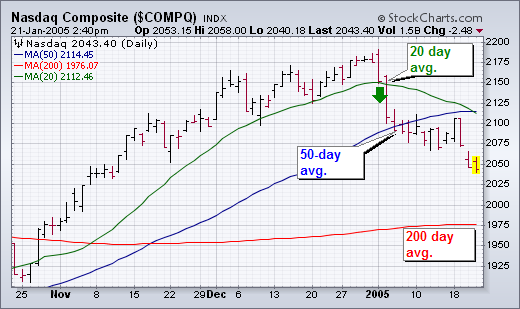
WHY I PREFER THE 50-DAY AVERAGE ...
The 20-day average is usually too short for my purposes which is to spot bigger trend changes (although it is the period used in Bollinger Bands). At the same time, the 200-day average is too long. Imagine holding a long position in the market waiting to see if...
READ MORE
MEMBERS ONLY
Hello Fellow ChartWatchers!
The market finished last week with three big down days. So far this year, the Nasdaq is down 6.5%. Much of the fall has been driven by Small Cap stocks as the S&P 500 Large Caps is only down 3.6% during the same period. As John...
READ MORE
MEMBERS ONLY

DOW AND S&P 500 GIVE SELL SIGNALS -- NEXT SUPPORT IS AT 200-DAY AVERAGES -- WHY 1140 IS IMPORTANT SUPPORT FOR THE S&P 500
by John Murphy,
Chief Technical Analyst, StockCharts.com
NASDAQ HEADED TO 200-DAY AVERAGE ... The Nasdaq market has suffered the most technical damage of all the major stock indexes. Yesterday I showed the Nasdaq market having broken a five-month up trendline drawn under its August/October lows. It's now headed toward its 200-day moving...
READ MORE
MEMBERS ONLY

MOVING AVERAGES MEASURE DIFFERENT TRENDS -- WHY I PREFER A 50-DAY MOVING AVERAGE
by John Murphy,
Chief Technical Analyst, StockCharts.com
MOVING AVERAGE TRENDS ... I use moving averages quite a bit in my chart analysis. That's because they're a simple way of telling which way market trends are moving. The three that I watch are the 20-day, the 50-day, and the 200-day. Each one...
READ MORE
MEMBERS ONLY

OVERBOUGHT DOLLAR IS DROPPING AS FOREIGN CURRENCIES REBOUND -- THAT'S GIVING A BOOST GOLD, OIL AND OTHER COMMODITIES -- GOLD AND OIL STOCKS ARE STRONG
by John Murphy,
Chief Technical Analyst, StockCharts.com
CRUDE RESUMES UPTREND -- ENERGY STOCKS LEAD... Crude oil is rallying more than a dollar today and appears to be resuming its recent uptrend. Chart 1 shows that this week's minor pullback in oil found support along its mid-December peak at 46.65. That's what should...
READ MORE
MEMBERS ONLY

NASDAQ BREAKS SIX-MONTH TRENDLINE -- SARA LEE IS BREAKING OUT -- UTILITIES ARE NEXT AFTER STAPLES -- BOND FUNDS ARE GAINING
by John Murphy,
Chief Technical Analyst, StockCharts.com
SARA LEE REACHES FIVE-YEAR HIGH ... With the market continuing to slide, consumer staples were once again the day's top sector performer. The standout chart belongs to Sara Lee. Its daily chart shows the stock breaking through resistance at 24.50. Its green volume bar shows rising volume...
READ MORE
MEMBERS ONLY

NO MAJOR BUY SIGNAL YET IN BEAR MARKET FUND -- GUIDELINES FOR SHORT SELLING
by John Murphy,
Chief Technical Analyst, StockCharts.com
BEAR MARKET FUND HASN'T GIVEN MAJOR BUY SIGNAL YET ... I've received a number of questions about buying a bear market fund to profit from a falling stock market. I've also been asked to write more about short selling in general. Let's start...
READ MORE
MEMBERS ONLY

CONSUMER STAPLES AND ENERGY ARE TOP PERFORMERS FOR 2005 -- TECHNOLOGY IS THE WORST -- THAT'S NOT GOOD FOR THE REST OF THE MARKET -- HOW TO SPOT STAPLE LEADERS
by John Murphy,
Chief Technical Analyst, StockCharts.com
JANUARY 2005 RELATIVE PERFORMANCE ... The performance bars shown in Chart 1 plot the relative ranking of the nine market sectors since the start of the new year. The sector bars are placed in descending order through last evening (Tuesday). Starting from the left, the only two sectors in the black...
READ MORE
MEMBERS ONLY

CISCO AND MOTOROLA PULL TECHNOLOGY LOWER-- IBM WEIGHS ON DOW WHILE P&G GAINS -- NASDAQ 100 LEADS MARKET LOWER
by John Murphy,
Chief Technical Analyst, StockCharts.com
CISCO HELPS DRAG NASDAQ LOWER... Because of its large size, Cisco has an important influence on the Nasdaq market. Recently, that influence has been to the downside. Chart 1 shows the big networker tumbling to the lowest level in two months -- and on rising volume. That puts the stock dangerously...
READ MORE
MEMBERS ONLY

UNDERLYING SUPPORT LEVELS ARE STILL HOLDING -- GOLD STOCKS HAVEN'T GIVEN BUY SIGNAL YET -- BUT OIL STOCKS HAVE
by John Murphy,
Chief Technical Analyst, StockCharts.com
SUPPORT LEVELS ARE STILL HOLDING... Despite the fact that the market had another losing week, there wasn't much technical damage done. The only negative was the fact that all of the indexes closed below their 50-day moving averages. All of the other support levels that I showed...
READ MORE
MEMBERS ONLY

A REFRESHER ON RELATIVE STRENGTH -- USING MARKET CARPETS TO FIND MARKET LEADERS
by John Murphy,
Chief Technical Analyst, StockCharts.com
RELATIVE TO WHAT?... Judging from some of the feedback I've gotten recently, I think I need to discuss the concept of relative strength a bit more. The type of questions I've received, for example, is what happened to the defensive qualities of biotechs and drugs -- not...
READ MORE
MEMBERS ONLY

THE SEMICONDUCTOR/OIL SERVICE RATIO IS FALLING AGAIN WHICH IS USUALLY BAD FOR THE MARKET -- NEW ENERGY LEADERSHIP ISN'T GOOD FOR THE MARKET EITHER
by John Murphy,
Chief Technical Analyst, StockCharts.com
SOX/OSX RATIO REVISITED... Semiconductors have been falling this week while oil service stocks have been rising. The relationship between the two industry groups can be examined by plotting a ratio of the two. Which brings us back to the Semiconductor (SOX) Index/Oil Service ($OSX) ratio which is plotted...
READ MORE
MEMBERS ONLY

CRUDE BREAKOUT BOOSTS ENERGY SHARES -- OIL SERVICE STOCKS ARE LEADERS -- VALERO ENERGY IS TOP PERCENTAGE GAINER -- BAKER HUGHES AND EXXON MOBIL HAVE GIVEN P&F BUY SIGNALS.
by John Murphy,
Chief Technical Analyst, StockCharts.com
OIL COMPLETES "DOUBLE BOTTOM"... Earlier in the week, I wrote about crude oil tracing out a possible "double bottom" just above long-term support at $40. In mid-day trading, crude is up $1.78 and has hit a new six-week high at $48.15....
READ MORE
MEMBERS ONLY

UPS LEADS TRANSPORTS LOWER -- FINANCIALS WEAKEN -- ENERGY CONTINUES TO BOUNCE -- INTEL LEADS CHIPS HIGHER -- MARKET HAS RELIEF RALLY
by John Murphy,
Chief Technical Analyst, StockCharts.com
UPS TUMBLES 7% -- TRANSPORTS ON SELL SIGNAL ... UPS tumbled over 6 points today on monster volume. The weekly bars in Chart 1 show the technical damage that's been done to this transportation stock. It's weekly RSI and MACD lines are on the first sell signals in...
READ MORE
MEMBERS ONLY

RECORD TRADE DEFICIT SENDS DOLLAR LOWER -- BOOSTS GOLD AND CRB INDEX
by John Murphy,
Chief Technical Analyst, StockCharts.com
TRADE DEFICIT BOOSTS FOREIGN CURRENCIES... The U.S. November trade deficit came in higher than expected and reached a record high. That's pushing the U.S. dollar sharply lower -- and foreign currencies higher. Chart 1 shows the Euro climbing back over its 50-day average. The Commodity Channel...
READ MORE
MEMBERS ONLY

THE MARKET HAS ALREADY REACHED MAJOR UPSIDE TARGETS -- MORE 50-DAY AVERAGES ARE BROKEN -- SOX PULLS MARKET LOWER
by John Murphy,
Chief Technical Analyst, StockCharts.com
WILSHIRE 5000 TARGETS SUPERSEDE S&P 500 TARGETS... During the fourth quarter, I gave an upside target in the S&P 500 to the 1250 level. That was partially predicated on the fact that 1250 represented a 62% retracement of the 2000-2002 bear market. I later wrote...
READ MORE
MEMBERS ONLY

ENERGY BUYING IN NEW YEAR COULD ADD TO MARKET'S PROBLEMS -- GOLD AND OIL STOCKS HOLD UP WHILE REST OF MARKET WEAKENS
by John Murphy,
Chief Technical Analyst, StockCharts.com
CRUDE OIL RALLY FADES... Yesterday I showed crude oil trying to break through its late December peak and its 50-day moving average. After a good start, the commodity ended the day in the red. Although that doesn't change the long-term picture, it was enough to prevent...
READ MORE
