MEMBERS ONLY
A LONGER-TERM MARKET VIEW
Daily charts can be used to fine tune entry and exit points, but they should be interpreted within the context of what weekly charts and indicators tell us. For example, some shorter-term indicators show the market to be overbought, but the weekly chart implies that another leg of the...
READ MORE
MEMBERS ONLY
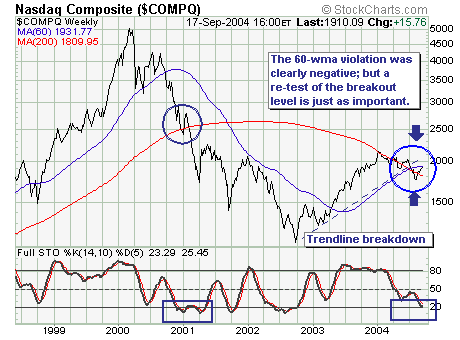
TIME TO SHORT TECH SHARES?
The current Nasdaq Composite rally is at an inflection point much in the same manner it was during the week of July 14th as prices slid to new yearly lows. The simple indicator we are looking at is the 60-week moving average, which in the past has an enviable...
READ MORE
MEMBERS ONLY
BUZZING ABOUT MURPHY
MURPHY SURVEY RESULTS - Last week we conducted a customer satisfaction survey for the Murphy Market Message. As a direct result of that survey, we've added a couple of new features to the "John Murphy" section of our site including a "Comments" box that allows...
READ MORE
MEMBERS ONLY
ON USING MOVING AVERAGES
WHY WE USE MOVING AVERAGES ... You've probably noticed that I rely very heavily on moving average lines. There are some good reasons for that. The main one is that they are one of the simplest ways to spot trend changes. But not all moving averages are equal. The...
READ MORE
MEMBERS ONLY

Hello Fellow ChartWatchers!
We had some good response to last issues do-it-yourself approach to analyzing the Dow chart so let's try it again. Ready? Study the chart below and decided for yourself if it is bullish or bearish and why:
My take is that this chart looks pretty bearish...
READ MORE
MEMBERS ONLY

NEW HIGH BY TRANSPORTS AND UTILITIES BODES WELL FOR INDUSTRIALS -- WEEKLY S&P CHART LOOKS BULLISH -- FOLLOW THE LEADERS

by John Murphy,
Chief Technical Analyst, StockCharts.com
DOW TRANSPORTS AND UTILITIES HIT 52-WEEK HIGHS... Two of the three Dow Averages reached a new 52-week high this week. Chart 1 shows the Dow Transports closing decisively over its summer high. Chart 2 shows the Dow Utilities in an even stronger climb. Interestingly, the utilities seem to...
READ MORE
MEMBERS ONLY

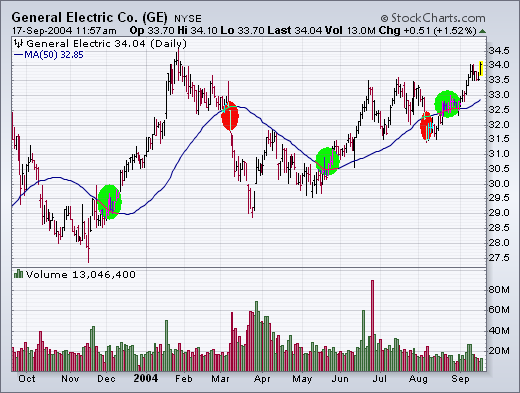
GENERAL ELECTRIC LEADS INDUSTRIAL SECTOR HIGHER WHICH BODES WELL FOR MARKET -- HOW TO USE MOVING AVERAGE LINES
by John Murphy,
Chief Technical Analyst, StockCharts.com
INDUSTRIAL ETF NEARS SUMMER HIGH ... So far this week I've written about relative strength in biotech, the Internet, and the consumer discretionary groups. In each case, I first found a sector index that was displaying rising relative strength combined with strong chart action. The chart action is usually...
READ MORE
MEMBERS ONLY

BOND YIELDS FALL ON LOW INFLATION NUMBER WHICH HELPS FINANCIALS -- BEST BUY AND BED BATH AND BEYOND LEAD CONSUMER DISCRETIONARY GROUP -- HOME DEPOT ACHIEVES ANOTHER BREAKOUT -- USING DIFFERENT TIME DIMENSIONS
by John Murphy,
Chief Technical Analyst, StockCharts.com
CONSUMER DISCRETIONARY ETF HITS THREE-MONTH HIGH ... On a day when the market experienced minor gains, one of the standout groups was consumer discretionary stocks. Chart 1 shows the AMEX Consumer Discretionary Select SPDR hitting a new three-month high today on big volume. Its relative strength ratio line has...
READ MORE
MEMBERS ONLY

BIOTECH BREAKOUT -- BUYING LEADERS OR LAGGARDS -- HOW TO USE SECTOR INFORMATION
by John Murphy,
Chief Technical Analyst, StockCharts.com
BIOTECH BREAKOUT ... Biotech stocks continue to show good chart action and good relative strength. The purpose of this market messsage is to update my August 27 piece on the biotech group, show the technical improvement since then, and also sugget a number of ways of taking advantage of this rallying...
READ MORE
MEMBERS ONLY

MARKET PULLS BACK FROM OVERBOUGHT CONDITION -- COKE AND XILINX FALL ON BIG VOLUME -- TRYING TO BALANCE SHORT AND LONG TERM VIEWS
by John Murphy,
Chief Technical Analyst, StockCharts.com
MARKET IS OVERBOUGHT SHORT-TERM ... Earnings warnings in Coke and Xilinx contributed to some profit-taking in the Nasdaq and the big board today. Two other reasons for today's setback is a short-term overbought condition and the closeness to some overhead resistance levels in the major stock...
READ MORE
MEMBERS ONLY

INTERNET LEADS TECH RALLY-- QQQ NEARS 200-DAY AVERAGE -- NYSE NEARS TEST OF SUMMER HIGH
by John Murphy,
Chief Technical Analyst, StockCharts.com
INTERNET INDEX CLEARS 200-DAY LINE... Although most of the talk in the recent technology revival has been about the SOX Index, Internet stocks are doing much better. Chart 1 shows the IIX Internet Index closing over its 200-day moving average for two consecutive days. [By comparison, the SOX...
READ MORE
MEMBERS ONLY

BIG DROP IN OIL HELPS FRIDAY CLOSE -- FINANCIALS AND TECHNOLOGY HAVE STRONG WEEK --- NASDAQ EXCEEDS 50-DAY AVERAGE
by John Murphy,
Chief Technical Analyst, StockCharts.com
NASDAQ EXCEEDS 50-DAY AVERAGE... In a continuation of Thursday's strong action, the Nasdaq led the rest of the market into a strong Friday close. As Chart 1 shows, the Nasdaq finally broke through its (blue) 50-day average at week's end for the first time...
READ MORE
MEMBERS ONLY

TEXAS INSTRUMENTS SPARKS SOX BUYING -- NASDAQ CLIMBS ON GOOD VOLUME
by John Murphy,
Chief Technical Analyst, StockCharts.com
TEXAS INSTRUMENTS SPARKS SOX BUYING ... A high-volume gain in Texas Instruments help lead a 5% gain in the Semiconductor (SOX) Index which had just hit a new 52-week low yesterday. Chart 1 shows TXN gapping up and through its 50-day moving average and reaching a new high...
READ MORE
MEMBERS ONLY

RAILS POWER TRANPORTS HIGHER -- NASDAQ RALLY STALLS AT 50-DAY AVERAGE -- SOX HITS NEW LOW -- LARGE CAP VALUE INDEX REACHES RESISTANCE
by John Murphy,
Chief Technical Analyst, StockCharts.com
NASDAQ MARKET HAS NO BOUNCE... One of the missing ingredients in the recent market rebound has been the lack of participation by the technology-dominated Nasdaq market. While the Dow and the S&P 500 have climbed over their 200-day moving averages, the Nasdaq indexes haven't...
READ MORE
MEMBERS ONLY

HOVNANIAN LEADS HOMEBUILDER BREAKOUT - BROKERS CATCHING UP IN STRONG FINANCIAL GROUP -- VERIZON LEADS TELECOM UPMOVE
by John Murphy,
Chief Technical Analyst, StockCharts.com
HOVNANIAN SPARKS HOME BUYING... Homebuilders are finally joining the rotation into rate-sensitive stocks groups -- like financials, utilities, and REITs. A high-volume breakout in Hovnanian Enterprises is today's main catalyst for the buying of homebuilders. Chart 1 shows HOV breaking through its summer high and its 200-...
READ MORE
MEMBERS ONLY

BIG DROP IN OIL BOOSTS MARKET -- FINANCIALS LEAD ON UPSIDE -- DOW STAYS OVER 200-DAY LINE
by John Murphy,
Chief Technical Analyst, StockCharts.com
CRUDE DROPS A DOLLAR -- GOLD UNDER $400 ... After recovering barely half of its August price decline, crude oil has fallen over a dollar today and is trading back under $43. That's giving a boost to the rest of the market. With oil falling, energy shares are seeing some...
READ MORE
MEMBERS ONLY
A "NEW AND IMPROVED" RYDEX RATIO
The Rydex Asset Ratio has been around for eight or ten years, and it is a favorite among sentiment indicators because it is based, not upon opinion polls, but upon where people are actually putting their money. It is calculated by dividing total assets in bear index and money market...
READ MORE
MEMBERS ONLY
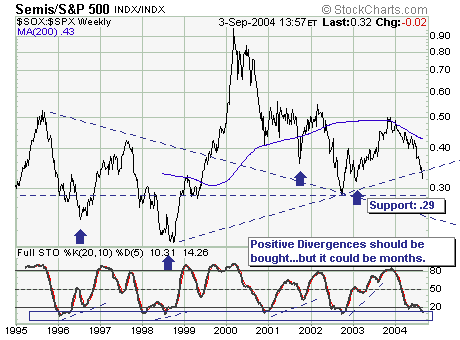
SEMIS NOT THE LEADERS THEY ONCE WERE
The recent carnage in the Semiconductor Index (SOX) moved to the forefront on Friday with INTC's poor guidance moving forward. Thus, we must look at the SOX within the context of its relationship with the S&P 500 (SPX), and for this we use the ratio of...
READ MORE
MEMBERS ONLY
NEW DATA FEED IS IN!
OUR NEW DATA FEED IS IN! - Well, there were some bumps in the road, but we've managed to get our new ThomsonONE data feed installed and working last week. To those of you that were patient with us while we fixed the problems, we say "Thanks!"...
READ MORE
MEMBERS ONLY
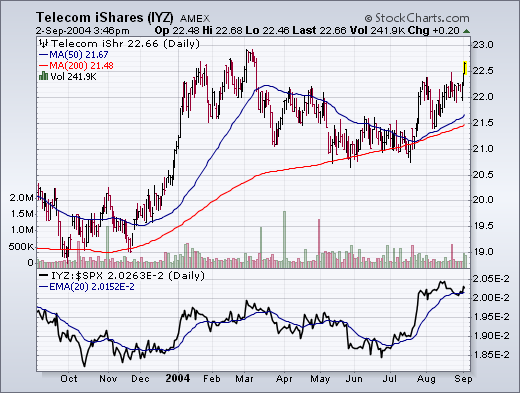
TELECOMM HAVE STRONG DAYS
Telecom stocks had a good chart day. The AMEX Telecom iShares (IYZ) broke out to a new six-month high today. Its relative strength line has been rising since late June. Two of the biggest reasons for today's strength were SBC and Verizon Communications which are two of...
READ MORE
MEMBERS ONLY
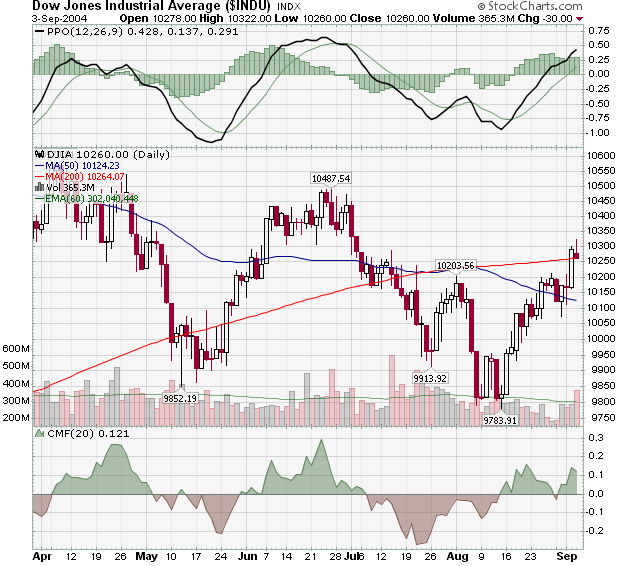
Hello Fellow ChartWatchers!
Thursday's big rally for the Dow Industrials was unexpected and significant. Check out the chart below and see if you can spot the reasons why:
As anticipated, the Dow faltered after hitting its 50-day moving average line. That line was also at the 10,200 resistance level...
READ MORE
MEMBERS ONLY

DOW AND S&P 500 CLEAR 200-DAY AVERAGES -- ALL SECTORS RALLY -- MATERIALS, RETAILERS, AND TELECOMM HAVE STRONG DAYS
by John Murphy,
Chief Technical Analyst, StockCharts.com
RETAILERS LEAD DAY'S ADVANCE... Our midday market message focused on the upturn in retail stocks that started this morning. By day's end, the retail stocks achieved big gains and helped lead an impressive stock market advance. Chart 1 shows the AMEX Retail Holders (RTH) jumping to...
READ MORE
MEMBERS ONLY

HOME DEPOT LEADS STRONG RETAIL BUYING
by John Murphy,
Chief Technical Analyst, StockCharts.com
MARKING UP RETAIL... Retail stocks are having an especially good day. Chart 1 shows the Retail Holders (RTH) jumping impressively over its 50-day average today on rising volume. Percentagewise, it's one of the day's strongest groups. The relative strength line bottomed in early August after...
READ MORE
MEMBERS ONLY

MARKET STAGES LATE TURNAROUND TO END AUGUST ON UPNOTE -- BUT SEPTEMBER IS NEXT
by John Murphy,
Chief Technical Analyst, StockCharts.com
AUGUST ENDS ON UPNOTE... After trading lower throughout most of the day, late buying pushed the market into positive territory -- thereby ending the month on an upnote. Volume remained below average. Chart 1 shows the S&P 500 closing a shade above its 50-day moving average. It remains...
READ MORE
MEMBERS ONLY

DROP IN CONSUMER CONFIDENCE HELPS BONDS, HURTS STOCKS -- SOX LEADS TECH LOWER -- RATE-SENSITIVE STOCKS ARE UP
by John Murphy,
Chief Technical Analyst, StockCharts.com
BOND YIELDS FALL TO NEW LOW... The August drop in consumer confidence is boosting bond prices today and, at the same time, pushing yields to a new five-month low (see Chart 1). Hints at economic weakness are causing investors to sell some stocks and buy some bonds. Falling bond...
READ MORE
MEMBERS ONLY

BIOTECHS AND DRUGS PULL HEALTHCARE HIGHER
by John Murphy,
Chief Technical Analyst, StockCharts.com
HEALTH CARE ETF EXCEEDS 50-DAY AVERAGE... Over the past week, we've shown some of the leading market sectors -- mainly financials and materials -- that were either breaking out to the upside or close to doing so. Today, we're taking a closer look at the one of...
READ MORE
MEMBERS ONLY

CHEMICALS LEAD BASIC MATERIALS HIGHER -- DOW AND EASTMAN CHEMICAL ARE GROUP LEADERS
by John Murphy,
Chief Technical Analyst, StockCharts.com
MATERIALS SECTOR SPDR NEARS UPSIDE BREAKOUT... One of the market's strongest sectors is basic materials. Chart 1 shows the Materials Select Sector SPDR close to breaking through its April/July peaks. That would be an impressive breakout if it occurs and would put the ETF at the highest...
READ MORE
MEMBERS ONLY

PLUNGE IN OIL BOOSTS STOCKS -- BANKS LEAD FINANCIALS -- JPM, BOEING, AND HERCULES BREAKOUT -- DOW EXCEEDS 50 DAY AVERAGE
by John Murphy,
Chief Technical Analyst, StockCharts.com
CRUDE BREAKS 20-DAY LINE... Crude oil continued its fall that started last Friday just shy of $50. It plunged $1.74 today to break its 20-day moving average for the first time in two months. Chart 1 shows the dotted 20-day average overlaid on the daily price...
READ MORE
MEMBERS ONLY

OIL DROPS SOME MORE -- REITS HAVE STRONG DAY
by John Murphy,
Chief Technical Analyst, StockCharts.com
SHORT-TERM TOP IN PLACE... The price of oil continues to drop. Last Friday I showed the 14-day RSI at the most overbought level (over 70) in three months and starting to weaken. Chart 1 plots the 14-day stochastic lines which have turned down from overbought territory over...
READ MORE
MEMBERS ONLY
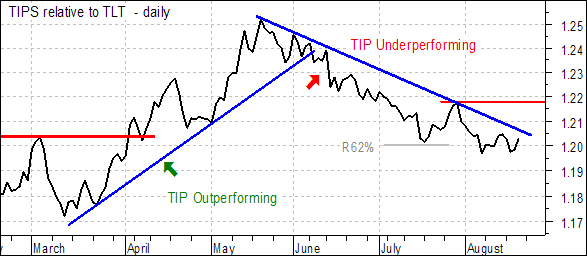
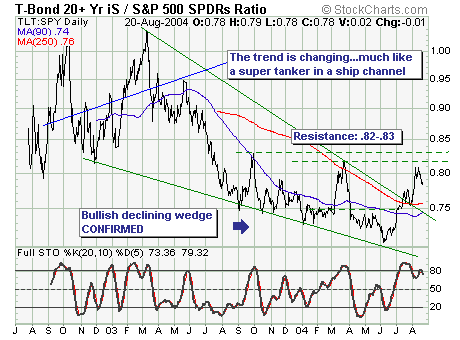
INFLATION EXPECTATIONS DOWN
The TIP/TLT price relative serves as a good proxy for inflationary fears or expectations. TIP is the iShares TIPS Bond (TIP), which is based on the US Treasury's inflation indexed bonds. TLT is the iShares 20+ Year Treasury Fund (TLT), which is not hedged against inflation.
Bonds...
READ MORE
MEMBERS ONLY
A MARKET BOTTOM FOR THE S&P?
We can't know the full potential of this rally, but there is abundant evidence that we have a solid bottom, and that we are seeing a rally that has at least the potential to move back to the top of the trading range.
First, there are positive divergences...
READ MORE
MEMBERS ONLY
ECONOMIC SLUMP FOR 2005?
This past week showed stocks higher; their largest weekly gain in nearly 10 months. And, it did so within the context of sharply higher oil prices. By and large, this has set the tone for stocks to potentially move to new highsor so we are to believe. In fact, there...
READ MORE
MEMBERS ONLY
DATA FEED MOVE THIS WEEK
STRAP ON YOUR HELMETS! - As we've been telling you, this coming week is our big change over to the ThomsonOne Data Feed. We've tested and simulated and fine-tuned things to death but starting on Monday we'll begin the changeover for real. Let us...
READ MORE
MEMBERS ONLY
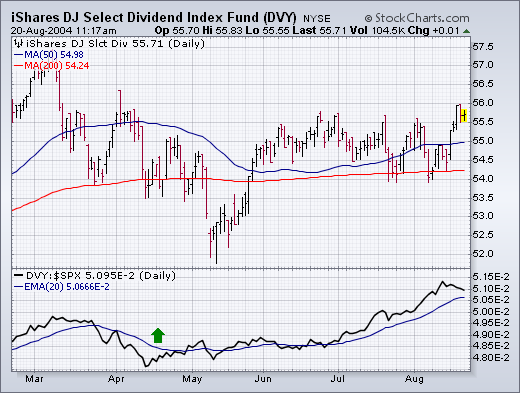
DIVIDEND STOCKS LOOK PROMISING, S&P LONG-TERM OUTLOOK MIXED
GOING FOR DIVIDENDS... A falling stock market -- along with falling bond yields -- should make dividend paying stocks more attractive. And that appears to be the case. Chart 1 plots the iShares Dow Jones Select Dividend Index Fund (DVY), which invests in large cap stocks that pay dividends. The Dividend ETF...
READ MORE
MEMBERS ONLY
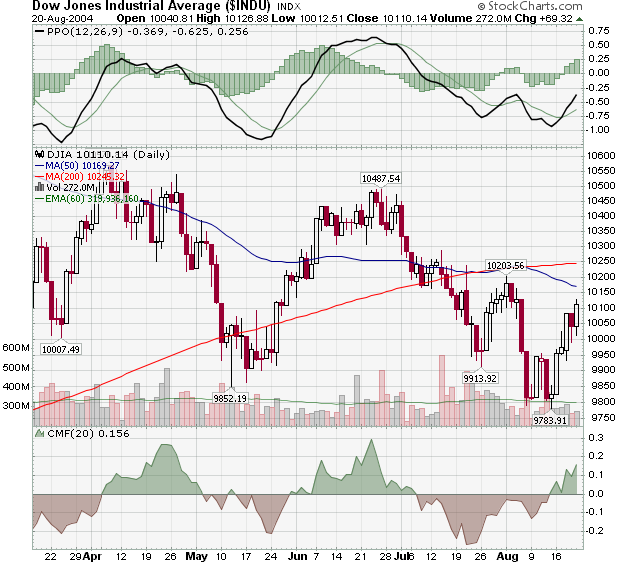
Hello Fellow ChartWatchers!
Since setting a new low of 9783 last Friday, the Dow moved higher during four of the last five days and is now approaching the 10203 peak that it set back at the start of August. This rally - and the successful IPO of Google - has greatly improved the general mood...
READ MORE
MEMBERS ONLY

GOLD BREAKS OUT -- SELLOFF IN CRUDE OIL BOOSTS MARKET AT WEEK'S END
by John Murphy,
Chief Technical Analyst, StockCharts.com
GOLD HITS FOUR-MONTH HIGH ... My Thursday Market Message focused on an impending bullish breakout in gold as it tested its July peak at $410. Bullion completed that bullish breakout today with a gain of $6.20 to put it at a new four-month high. The Gold & Silver...
READ MORE
MEMBERS ONLY

LOWER BOND YIELDS FAVOR RATE-SENSITIVE STOCKS -- LOWER DOLLAR HELPS COMMODITY-RELATED STOCKS -- LARGE CAP VALUE AND DIVIDEND STOCKS ATTRACT MONEY
by John Murphy,
Chief Technical Analyst, StockCharts.com
LOWER RATES HURT DOLLAR, BOOST CRB... Long-term rates have been dropping since June mainly due to signs of economic weakness resulting from rising energy prices. Chart 1 shows the 10-year T-note yield falling to the lowest level in four months and slipping beneath its 200-day moving...
READ MORE
MEMBERS ONLY

COMMODITIES ARE RISING AGAIN - CRB INDEX HITS THREE-MONTH HIGH -- BASIC MATERIALS ARE CLIMBING -- GOLD STOCKS JUMP
by John Murphy,
Chief Technical Analyst, StockCharts.com
GOLD STOCK JUMP OVER 4%... Our midday message showed gold challenging its July peak at $410. Gold closed the day at $409. With gold on the verge of a bullish breakout, the Gold & Silver Index (XAU) gained more than 4% and closed at a new four-month high. Chart...
READ MORE
MEMBERS ONLY

GOLD NEARS UPSIDE BREAKOUT -- NEWMONT MINING LEADS GOLD STOCKS HIGHER
by John Murphy,
Chief Technical Analyst, StockCharts.com
BULLION IS TESTING JULY HIGH... Continuing weakness in the U.S. Dollar is lighting a fuse under the gold market -- and gold-related stocks. Gold is trading up more than $3.00 today and is testing its July peak at $410. A close through that chart barrier would represent a...
READ MORE
MEMBERS ONLY

GUEST COMMENTARY: USING CARPETS TO GAUGE THE MARKET
by John Murphy,
Chief Technical Analyst, StockCharts.com
GUEST COMMENTARY BY CHIP ANDERSON... John is visiting family in the western US right now so Chip Anderson, president of StockCharts.com, is filling in for him. John should be back by Thursday.
MARKETCARPET DRILL DOWN... John has been a fan of our free MarketCarpet analysis tool for years and...
READ MORE
