MEMBERS ONLY

JUMP IN BOND YIELDS CONTRIBUTES TO AFTERNOON SELLOFF -- HOMEBUILDERS DROP -- QQQ BACKS OFF FROM RESISTANCE -- MARKET AWAITS THE FED

by John Murphy,
Chief Technical Analyst, StockCharts.com
INFLATION REPORT PUSHES YIELDS HIGHER... The market got an early boost today from Iraq and falling oil prices. By the end of the day, however, concern about rising rates pushed the major stock averages into negative territory. A big jump in consumer spending combined with a higher-than-expected inflation...
READ MORE
MEMBERS ONLY

DROP IN OIL GIVES MARKET A BOOST -- AIRLINES LEAD TRANSPORTS HIGHER
by John Murphy,
Chief Technical Analyst, StockCharts.com
CRUDE OIL DROPS $1.50 TO TWO-MONTH LOW... News that the Iraq transition took place two days early and a sharp drop in crude oil prices is giving the market a boost on Monday. Chart 1 shows crude oil dropping to the lowest level since late April. Not surprisingly,...
READ MORE
MEMBERS ONLY

WEAK DRUG GROUP PULLS DOW LOWER -- OTHER AVERAGES GAIN ON THE WEEK -- LEADERS ARE SMALL CAPS, MATERIALS, TECHNOLOGY, AND TRANSPORTATION
by John Murphy,
Chief Technical Analyst, StockCharts.com
DOW ENDS WEEK LOWER... Friday's Dow selloff put it in negative territory for the week. That loss was softened by the fact that the Nasdaq and the S&P 500 had weekly gains. Most of the Dow selling came from the drug group. Three of the Dow&...
READ MORE
MEMBERS ONLY

WEAK DURABLE GOODS REPORT SINKS DOLLAR -- PUSHES GOLD OVER $400 -- GOLD STOCKS RISE ABOVE 50-DAY AVERAGES -- CRB IS TURNING UP
by John Murphy,
Chief Technical Analyst, StockCharts.com
GOLD CLIMBS OVER $400... This morning's weaker than expected May durable goods report pushed the dollar lower against the Euro and the yen. That pushed gold prices $6.60 higher for the first move over $400 since mid-April. Gold stocks are rallying 3.7% and are the...
READ MORE
MEMBERS ONLY

MARKET IS FINALLY RISING ON VOLUME -- SUMMER RALLY APPEARS TO BE STARTING
by John Murphy,
Chief Technical Analyst, StockCharts.com
NASDAQ LEADS MARKET HIGHER... The Nasdaq market had the biggest percentage gain today and led an impressive market advance. This marks the second day of price gains accompanied by rising volume. That's something that's been missing for awhile. Chart 1 shows the Nasdaq Composite moving up...
READ MORE
MEMBERS ONLY

REVIEWING LAST WEEK'S OBSERVATIONS
by John Murphy,
Chief Technical Analyst, StockCharts.com
GUEST COLUMNIST - CHIP ANDERSON... John is travelling today and so Chip Anderson, President of StockCharts.com, is filling in. John should resume his commentary on Wednesday.
I thought it would be constructive to go back a review John's observations over the course of the past week and see...
READ MORE
MEMBERS ONLY
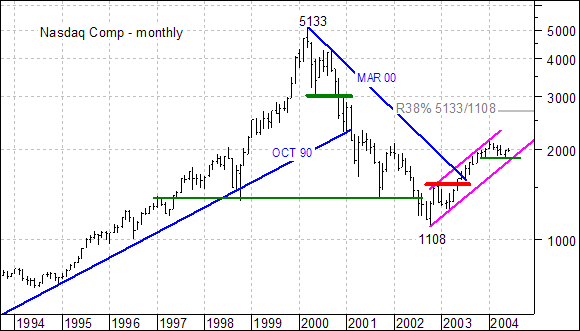
EVERYTHING IS RELATIVE
The advance since October 2002 is certainly impressive on its own merits, but pales when compared to the prior decline. The advance has not even retraced 38% of this decline and formed a rising price channel. As long as the lower trendline holds, the trend is firmly bullish and further...
READ MORE
MEMBERS ONLY

S&P 600 MID-CAP STOCKS ABOVE 200/50/20-EMA
I'm very pleased to announce that we now have a chart showing the S&P 600 Small-Cap stocks above their 200-EMA, 50-EMA, and 20-EMA. But wait! There's more! We also have this chart for the S&P 400 Mid-Cap,...
READ MORE
MEMBERS ONLY
FUNDAMENTALLY INTERESTING
From a fundamental perspective...the past several months shows US interest rates to have risen very sharply as US economic data continues to show strength - from employment to manufacturing to retail sales et al. Moreover, higher energy prices led by gasoline and crude oil have further thrown a "negative...
READ MORE
MEMBERS ONLY

FALLING DOLLAR MAY BE HELPING COMMODITIES
During the two years prior to 2004, a falling U.S. dollar pushed commodity prices to the highest level in more than a decade. During the first half of this year, a rebound in the dollar has coincided with a downside correction in commodities. That may be changing. Chart 1...
READ MORE
MEMBERS ONLY
Hello Fellow ChartWatchers!
Stocks moved sideways last week with most of the major averages finishing within 1% of where they started. The Amex was the big "winner" - up 1.7% - while the Nasdaq lost 0.6% and everyone else finished up somewhere in between. In this week's newsletter, John...
READ MORE
MEMBERS ONLY

BASIC MATERIALS AND CYCLICALS HAVE STRONG FRIDAY -- LEADERS ARE INDUSTRIAL METALS AND PAPERS -- FALLING DOLLAR MAY START BOOSTING COMMODITY PRICES
by John Murphy,
Chief Technical Analyst, StockCharts.com
FALLING DOLLAR MAY BE HELPING COMMODITIES... During the two years prior to 2004, a falling U.S. dollar pushed commodity prices to the highest level in more than a decade. During the first half of this year, a rebound in the dollar has coincided with a downside correction in commodities....
READ MORE
MEMBERS ONLY

BASIC MATERIALS AND GOLD LEAD FRIDAY BOUNCE -- DOLLAR FALLS ON RECORD TRADE DEFICIT
by John Murphy,
Chief Technical Analyst, StockCharts.com
RECORD TRADE DEFICIT HURTS DOLLAR -- HELPS GOLD... Chart 1 (plotted through Thursday) shows the U.S. Dollar Index meeting resistance at its moving average lines and showing signs of rolling over to the downside. This morning's report that the U.S. account deficit for the first quarter hit...
READ MORE
MEMBERS ONLY

SOXS PULLS NASDAQ LOWER -- JABIL TUMBLES -- GE AND MICROSOFT BOOST DOW -- HIGH PPI AND RISING OIL WORRY MARKET
by John Murphy,
Chief Technical Analyst, StockCharts.com
SOX HITS MONTHLY LOW... The Semiconductor (SOX) Index fell more than 3% today and pulled the technology sector down with it. Chart 1 shows the SOX hitting the lowest level in a month and also breaking a two-month up trendline. That opens up the possibility of a retest of...
READ MORE
MEMBERS ONLY

NATURAL GAS LEADS ENERGY SECTOR HIGHER -- OIL SERVICE INDEX EXCEEDS 50-DAY AVERAGE
by John Murphy,
Chief Technical Analyst, StockCharts.com
ENERGY ETF NEARS OLD HIGH... Energy stocks are rising again. In a mixed market, energy shares are especially strong. Chart 1 shows the Energy Select Sector SPDR moving up to challenge its April high. A close through that chart barrier would put the energy ETF at a new three-year...
READ MORE
MEMBERS ONLY

MARKET RALLIES ON INFLATION REPORT -- BOND YIELDS DROP -- MICROSOFT LEADS TECHS HIGHER -- CNF HITS MULTI-YEAR HIGH
by John Murphy,
Chief Technical Analyst, StockCharts.com
INFLATION REPORT SOOTHES BOND TRADERS... The much-awaited May CPI report showed an increase of 0.6%. Although that was the biggest number since January 2001, the core figure met consensus expectations of 0.2%. For the time being, that calmed bond traders who were afraid of a much higher...
READ MORE
MEMBERS ONLY

FINALLY SOME DECENT STOCK MARKET VOLUME
by John Murphy,
Chief Technical Analyst, StockCharts.com
MARKET BOUNCE ATTRACTS SOME VOLUME... A relatively benign inflation report and a sharp drop in bond yields pushed stock prices higher today. As a result, the three main indexes are still safely over their 50-day moving averages. The Nasdaq bounced off its 200-day line yesterday. Market breadth was...
READ MORE
MEMBERS ONLY

OVERBOUGHT MARKET PULLS BACK BEFORE INFLATION REPORTS -- BOND YIELDS NEAR TWO-YEAR HIGH
by John Murphy,
Chief Technical Analyst, StockCharts.com
MAJOR AVERAGES PULLING BACK ... Last Wednesday I showed Chart 1 to make the point that the S&P 500 SPDR was up against chart resistance near 115 (its April highs) and that the stochastic lines were in overbought territory over 80. That suggested that some short-term selling wouldn&...
READ MORE
MEMBERS ONLY

TRADING VOLUME REMAINS LIGHT -- BUT MARKET IS LOOKING A LOT STRONGER
by John Murphy,
Chief Technical Analyst, StockCharts.com
SHORT-TERM UPTREND LOOKS OVERBOUGHT... The market ended a shortened trading week with a Thursday bounce. The lack of trading activity continues to cast a pall over the recent price gains. In addition, daily stochastic lines remain in overbought territory over 80. A more positive picture is shown by the...
READ MORE
MEMBERS ONLY

NEW FOCUS ON RISING RATES BOOSTS DOLLAR AND HURTS GOLD AND STOCKS -- BIOTECH BREAKDOWN -- TELECOMS BOUNCE -- COSTO BREAKS OUT --
by John Murphy,
Chief Technical Analyst, StockCharts.com
GREENSPAN EFFECT... In a Wednesday speech in London, Mr. Greenspan talked about the possibility of the Fed having to raise rates more aggressively than planned if inflation pressures continue to build. Thursday's trading seems to be a delayed reaction to those remarks. Bond yields started rising again which...
READ MORE
MEMBERS ONLY

RAILS LEAD TRANSPORTATION BREAKOUT -- INDUSTRIAL ETF ALSO BREAKS OUT -- CISCO LEADS NASDAQ HIGHER -- QQQ AND SPY BREAK RESISTANCE LINES
by John Murphy,
Chief Technical Analyst, StockCharts.com
DOW TRANSPORTS EXCEED APRIL HIGH... The Dow Jones Transportation Average has broken through the previous peak formed during April, and is now on its way toward its January high. Its relative strength line has been rising since early March in another show of relative strength. Last week (June 2) I...
READ MORE
MEMBERS ONLY

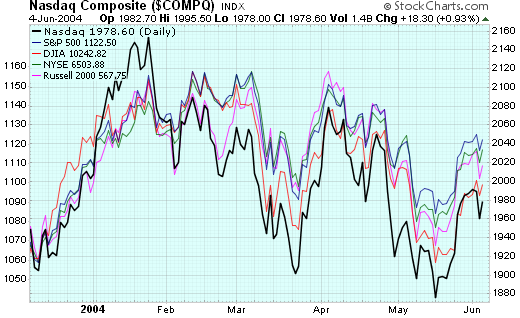
ELLIOT COUNT SUGGESTS A FIFTH WAVE HIGHER
There are two distinct advances and two declines on the weekly Nasdaq Composite chart with the fifth wave still to come.
The first advance started in October 2002 and ended in December 2002 to form Wave 1. The second advance from 1253 to 2154 is clearly the longest in both...
READ MORE
MEMBERS ONLY
A NEW RECORD FOR NYSE MEMBER BUYING
In the week ended May 15, 2004 NYSE Member Net Buy/Sell numbers hit a new, all-time high of net buying of +741,439,000 shares. There are only two other occasions of net buying that even come close to this -- +540,105,000 shares in the week ended...
READ MORE
MEMBERS ONLY
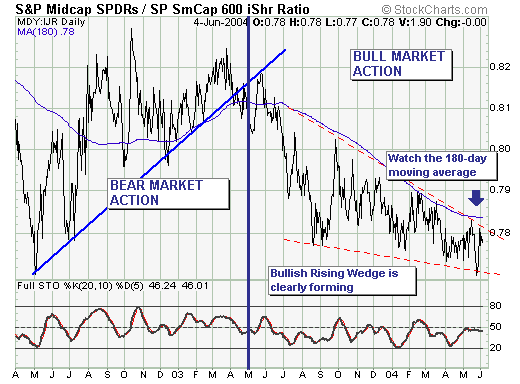
RISING WEDGE ON RATIO CHART BEARISH
Over the past two week's, sentiment has gone from "highly bearish" to "highly bullish" - a change in circumstances that shows confusion above all, but the fact remains the current rally in the major indices has reached the important 50%-60% retracement levels typical of...
READ MORE
MEMBERS ONLY

BOOKSTORE CHANGES
NEW BOOKSTORE DESIGN - We're very pleased with how our bookstore redesign project turned out and we think you will be too. Check out the new look and features of StockChartsBookStore.com and let us know what you think! The best selection and prices for online T/A books...
READ MORE
MEMBERS ONLY

ENERGY STOCKS MAY BE TOPPING
One of the principles of intermarket behavior is that commodity-related stocks usually peak before the commodity. That's why the next chart is so interesting. While energy prices hit a record high early this week, the Energy Select Sector SPDR peaked in late April. That created a negative...
READ MORE
MEMBERS ONLY
Hello Fellow ChartWatchers!
Last week saw the major markets put in another "lower high" for the current downtrend - the third major one since things started moving lower back in March. This three-point downtrend is easiest to see on the Nasdaq's chart, but it appears on most of the...
READ MORE
MEMBERS ONLY

MARKET BOUNCE STILL LACKS VOLUME -- DOLLAR FALL SHOULD BOOST COMMODITIES -- ENERGY STOCKS LOOK TOPPY
by John Murphy,
Chief Technical Analyst, StockCharts.com
S&P 500 REACHES RESISTANCE LINE... Friday turned out to be a pretty good day. A strong jobs report, a bounce in Intel and chip stocks, and another drop in oil prices set a positive tone from the opening bell. Unfortunately, the day turned out to much less impressive...
READ MORE
MEMBERS ONLY

DROP IN OIL DOESN'T HELP STOCKS -- MARKET INDEXES SLIP BACK UNDER 50-DAY AVERAGES -- EMPLOYMENT REPORT DUE TOMORROW
by John Murphy,
Chief Technical Analyst, StockCharts.com
OIL RISES -- THEN DROPS... It was a strange day to say the least. OPEC announced this morning the biggest production increase in seven years and oil prices rose. As a result, stocks opened lower. This afternoon, an increase in oil inventories pushed crude 75 cents lower to $39.21 -- and...
READ MORE
MEMBERS ONLY

OPEC ANNOUNCEMENT DISAPPOINTS MARKET -- DRUGS ARE UP - CHIPS ARE DOWN
by John Murphy,
Chief Technical Analyst, StockCharts.com
OIL TRADES HIGHER... OPEC announced this morning an increase in oil production of 2 million barrels a day. Although that was the biggest jump in seven years, crude oil has gained 46 cents and is back over $40. That's not what the stock market was hoping for. As...
READ MORE
MEMBERS ONLY

DOW CROSSES 50-DAY AVERAGE -- DROP IN OIL BOOSTS STOCKS -- TRANSPORTS ARE BIG WINNERS -- SOX WEAKENS
by John Murphy,
Chief Technical Analyst, StockCharts.com
DOW CLOSES OVER 50-DAY AVERAGE... For a change, today's leadership came from industrial stocks. As a result, the Dow Industrials managed a close over their 50-day moving average. That puts all the major stock averages over that key resistance line. A $2.40 drop in the...
READ MORE
MEMBERS ONLY

STOCK MARKET CLOSES HIGHER AFTER OIL SPIKE
by John Murphy,
Chief Technical Analyst, StockCharts.com
OIL SPIKE HELPS ENERGY -- HURTS AIRLINES... Crude oil prices jumped $2.50 today to close over $42 for the first time ever. As is usually the case when oil is rising, energy-related shares were the big winners. The Energy Select Sector SPDR gapped higher today -- although on lighter volume....
READ MORE
MEMBERS ONLY

DOLLAR DOWNTURN BOOSTS GOLD -- NASDAQ BOUNCES OFF YEARLONG SUPPORT LINE
by John Murphy,
Chief Technical Analyst, StockCharts.com
DOLLAR RALLY MAY BE OVER ... The U.S. Dollar Index has been in an intermediate term recovery since February. It ran into trouble, however, around its 200-day moving average. The Dollar Index rose above that long-term resisance line briefly at the start of May and even reached a...
READ MORE
MEMBERS ONLY

OIL DIP UNDER $40 GIVES MARKET A BOOST -- WEAKER DOLLAR HELPS GOLD AND MATERIALS -- S&P 500 TRADING OVER 50 DAY AVERAGE
by John Murphy,
Chief Technical Analyst, StockCharts.com
S&P EXCEEDS 50 DAY LINE... In a continuation of the rally that started on Tuesday, the market is trading higher today. Earlier in the week, the Nasdaq 100 was the first of the major stock indexes to exceed its 50-day average. The benchmark S&P 500...
READ MORE
MEMBERS ONLY

SHORT-TERM MARKET TREND STRENGTHENS -- LONG-TERM TREND IS OVERSOLD AS WELL
by John Murphy,
Chief Technical Analyst, StockCharts.com
NASDAQ 100 LEADING MARKET HIGHER... A number of positive chart things have happened this week. Tuesday's market rally came on good volume and very good breadth. It also came at a good time with so many market indexes testing major support at their 200-day moving averages. There...
READ MORE
MEMBERS ONLY

BIG JUMP IN ENERGY UNDERMINES RALLY ATTEMPT
by John Murphy,
Chief Technical Analyst, StockCharts.com
CRUDE OIL JUMPS $1.77... A planned increase in Saudi oil production didn't have the desired effect of pushing crude oil below $40. Instead, crude jumped $1.77 to close at $41.70 -- just pennies from a new all-time high. As a result, energy shares were especially...
READ MORE
MEMBERS ONLY

DROP IN ENERGY SECTOR GIVES MARKET A BOOST -- SO DOES A BOUNCE IN FINANCIALS -- GLOBAL MARKETS STILL TESTING 200-DAY LINES
by John Murphy,
Chief Technical Analyst, StockCharts.com
ENERGY ETF LOSING LEADERSHIP... A strange thing happened this week. Crude oil prices reached another all-time high. At the same time, energy shares dropped. Chart 1 shows the Energy Select Sector SPDR trading under its 50-day average for the last four days of the week. The previous week&...
READ MORE
MEMBERS ONLY

STOCK RALLY FADES ON RISING VOLUME-- HEALTHCARE IS DAY'S WEAKEST SECTOR -- WEAKER DOLLAR PRODUCES COMMODITY BOUNCE
by John Murphy,
Chief Technical Analyst, StockCharts.com
MAJOR AVERAGES CLOSE LOWER ON HIGHER VOLUME... What started out as an encouraging bounce turned into a bad technical day. After jumping this morning, all the major averages reversed to the downside on rising volume. That's a bad combination. Also bad is the fact that the Dow Diamonds...
READ MORE
MEMBERS ONLY

GLOBAL MARKETS ARE ALSO BOUNCING OFF 200-DAY LINES -- HEWLETT PACKARD LEADS MARKET HIGHER -- TECHNOLOGY SHOWING NEW LEADERSHIP
by John Murphy,
Chief Technical Analyst, StockCharts.com
GLOBAL RALLY ATTEMPT... I've been writing a lot about U.S. stock indexes bouncing off their 200-day averages. Those that have slipped under that long-term support line are climbing back above it today. It's important to recognize that the recent downside correction -- and the...
READ MORE
MEMBERS ONLY

RETAIL BUYING AND ENERGY SELLING GIVE MARKET A BOOST -- S&P 500 BOUNCES OFF 200 DAY AVERAGE
by John Murphy,
Chief Technical Analyst, StockCharts.com
RETAIL HOLDERS RISE ON VOLUME... A nice rebound in retail stocks gave a market a boost today. It came at a good time with major stock indexes like the S&P 500 bouncing off their 200-moving averages. At the same time, a $1.00 drop in crude oil...
READ MORE
