MEMBERS ONLY

STOCK INDEXES STILL TESTING 200-DAY AVERAGES

by John Murphy,
Chief Technical Analyst, StockCharts.com
NYSE AND S&P 500 BOUNCE OFF MOVING AVERAGE... Despite Monday's market selloff, several important stock indexes are still holding above their 200-day moving averages. Chart 1 shows the S&P 500 once again bouncing off its 200-day line at 1080. Its daily stochastic...
READ MORE
MEMBERS ONLY

VOLATILITY INDICES BREAK 200-DAY SMA's
Although there is more than one way to interpret volatility, the simple fact is that the S&P 100 Volatility Index (VIX) and the Nasdaq 100 (VXN) trend lower when the market trends higher and trend higher when the market trends lower. In other words, these indicators actually trend...
READ MORE
MEMBERS ONLY
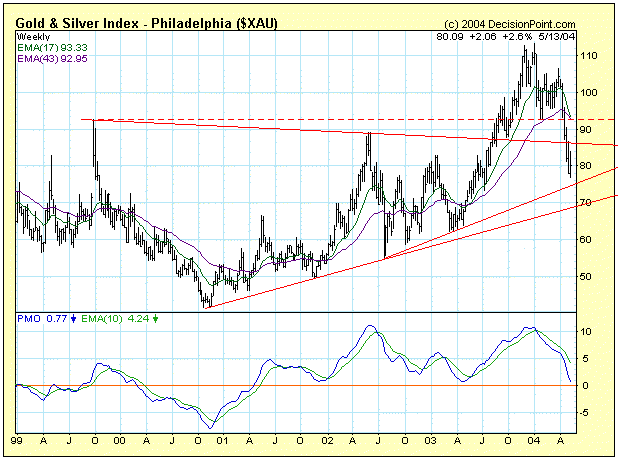
LOOKING FOR A BOTTOM IN GOLD STOCKS
At the end of April the XAU monthly Price Momentum Oscillator (PMO) -- not shown here -- topped at very overbought levels, rendering a long-term sell signal. This action confirmed the sell signal top on the weekly PMO a month earlier, shown on the chart above. Both the monthly and weekly...
READ MORE
MEMBERS ONLY
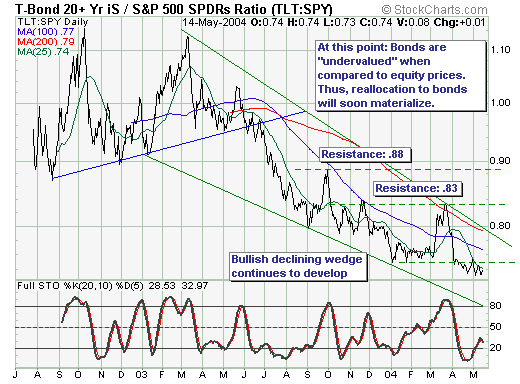
TAKING ADVANTAGE OF WEAKNESS IN BONDS
The recent capital market turmoil across the oceans and through all asset classes be it bonds or stocks or gold, has exacerbated certain risk-reward relationships between these asset classes as the "carry trade" is being unwound. And while these relationships may become even "more skewed"...
READ MORE
MEMBERS ONLY
SURPRISED BY SURPRISED ECONOMISTS
CPI AND PPI NUMBERS SURPRISE ECONOMISTS... The most frequently seen words in the financial press are "economists were surprised". It seems they're always being surprised by something. This week it was the "surprising" jump in the CPI and PPI inflation numbers. The fact that...
READ MORE
MEMBERS ONLY
Hello Fellow ChartWatchers!
At the height of last Wednesday's big decline all of the major averages except one had moved below their 200-day (40-week) moving averages. This was the first time that had happened since the start of 2003 and it is another important technical milestone that occurs as...
READ MORE
MEMBERS ONLY

ECONOMISTS FINALLY SEE INFLATION THREAT
by John Murphy,
Chief Technical Analyst, StockCharts.com
CPI AND PPI NUMBERS SURPRISE ECONOMISTS... The most frequently seen words in the financial press are "economists were surprised". It seems they're always being surprised by something. This week it was the "surprising" jump in the CPI and PPI inflation numbers. The fact that...
READ MORE
MEMBERS ONLY

AFTERNOON RALLY KEEPS SUPPORTS INTACT -- CRUDE OIL CLOSES OVER $40 -- BIOTECHS BOUNCE OFF 200-DAY AVERAGE -- TOBACCO TUMBLES
by John Murphy,
Chief Technical Analyst, StockCharts.com
MAJOR AVERAGES CLOSE HIGHER ... Selling throughout most of the day had major stock indexes in danger of breaking key support levels near their 200-day moving averages. A late-day rally, however, prevented that from happening. By day's end the Dow was back above the 10K level and...
READ MORE
MEMBERS ONLY

MARKET SEES RENEWED SELLING -- DOW IS BACK UNDER 10K -- CISCO AND SOX WEIGH ON NASDAQ
by John Murphy,
Chief Technical Analyst, StockCharts.com
DOW FALLS BACK UNDER 10K... A record trade deficit for the month of March is contributing to renewed selling in the stock market today. In morning trading, the Dow Industrials have fallen back under 10K and their 200-day moving average. In contrast to yesterday's bounce when technology...
READ MORE
MEMBERS ONLY

DELL, INTEL, AND YAHOO PUT NASDAQ IN NEW LEADERSHIP ROLE -- DOW CLOSES BACK OVER 10K -- CYCLICALS BOUNCE OFF 200-DAY AVERAGE
by John Murphy,
Chief Technical Analyst, StockCharts.com
NASDAQ LEADERS... Our midday Market Message talked about the Nasdaq showing new signs of upside leadership after pulling the rest of the market lower since January. For the first time in the new year, the technology-dominated Nasdaq market is holding up better than the rest of the market. That&...
READ MORE
MEMBERS ONLY

SOME ROTATION OUT OF CONSUMER STAPLES INTO TECHS MAY BE STARTING -- CHIPS AND INTERNET LEAD NASDAQ BOUNCE -- STOCK INDEXES ARE BOUNCING OFF 200-DAY AVERAGES
by John Murphy,
Chief Technical Analyst, StockCharts.com
NASDAQ 100 SHOWING BETTER RELATIVE STRENGTH ... The Nasdaq 100 peaked during January and has underperformed the S&P 500 since then. That relative weakness in the technology sector was an early warning that the market was running into trouble. The good news is that we're now seeing...
READ MORE
MEMBERS ONLY

GLOBAL MARKETS TUMBLE
by John Murphy,
Chief Technical Analyst, StockCharts.com
DOW CLOSES JUST UNDER 10K -- 200 DAY LINES IN JEOPARDY... The day started ugly in Asia and Europe and stayed ugly throughout the day. The stock selloff that started on Friday hit the global markets over the weekend before coming back to haunt the U.S. market. Percentagewise, the losses...
READ MORE
MEMBERS ONLY

UPSIDE BREAKOUT IN RATES PUNISHES STOCKS
by John Murphy,
Chief Technical Analyst, StockCharts.com
ADVANCE-DECLINE LINES PLUNGE EVEN FURTHER... At the end of last week, I showed the recent deterioration in the NYSE and the Nasdaq Advance-Decline lines. The Nasdaq AD line had already broken its 200-day moving average which reflected the greater deterioration in that technology-dominated market. At the...
READ MORE
MEMBERS ONLY

STRONG JOBS REPORT PUSHES BOND YIELD TO 20 MONTH HIGH -- FINANCIALS, HOMEBUILDERS, AND MATERIALS FALL THE HARDEST -- DRUGS AND TOBACCO ACT AS SAFE HAVENS
by John Murphy,
Chief Technical Analyst, StockCharts.com
YIELDS EXCEED 2003 PEAK ... Another very strong jobs report is having a predictable effect on interest rates. It's pushing them sharply higher. The weekly bars in Chart 1 shows the 10-year T-note yield breaking through the peak reached last summer and putting them at the highest...
READ MORE
MEMBERS ONLY

RETAILERS LEAD MARKET DROP --DRUGS AND CONSUMER STAPLES PLAY SAFE HAVEN ROLE --- NASDAQ 100 CLOSES OVER 200-DAY LINE
by John Murphy,
Chief Technical Analyst, StockCharts.com
HOME DEPOT AND WAL MART WEIGH ON DOW... Despite reporting solid numbers for the month of April, retailers got marked down today. It seems the prospect of higher interest rates is beginning to infect this group as well. After all, most retail items are bought on credit. Two of the...
READ MORE
MEMBERS ONLY

HEALTHCARE IS GETTING BETTER -- LILLY LEADS RISING DRUG GROUP -- OIL NEARING TEST OF $40
by John Murphy,
Chief Technical Analyst, StockCharts.com
HEALTH CARE IS TOP SECTOR... Healthcare was the day's top sector. Chart 1 shows the AMEX Health Care SPDR moving up toward its April high after bouncing off its 50-day line last week. Even more impressive is its relative strength line which has been moving up since...
READ MORE
MEMBERS ONLY

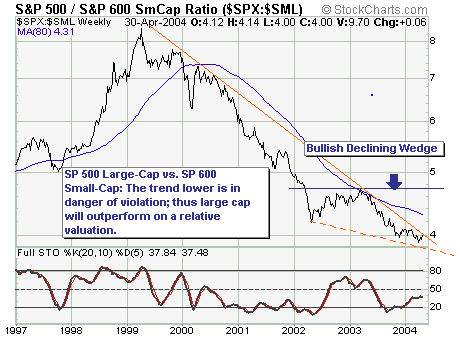
MARKET ATTEMPTS OVERSOLD BOUNCE -- NASDAQ STILL HOLDING OVER 200-DAY AVERAGE -- SMALL CAPS AND BANKS ALSO BOUNCE OFF SUPPORT
by John Murphy,
Chief Technical Analyst, StockCharts.com
LONG-TERM RATES MOVE HIGHER... The Fed did pretty much what everyone expected it to do today. It left rates unchanged but made it clear that short-term rates were eventually headed higher. Of course, everyone knows that already. That's why the 10-year T-note yield has...
READ MORE
MEMBERS ONLY
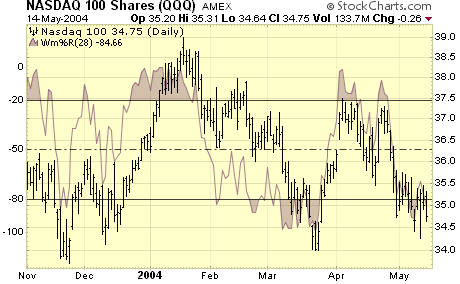
NASDAQ FAILING AND INDICATORS CONFIRMING
There are three ingredients to a downtrend: lower high, lower low and trendline break. The final ingredient (trendline break) is open for debate, but the lower low and lower high are not. With this week's failure to hold the big gains above 2030 (22-Apr) and break below...
READ MORE
MEMBERS ONLY

S&P 500 NEW HIGHS AND NEW LOWS
Here's a new chart we've just deployed on DecisionPoint.com, showing the 52-week new highs and new lows for just the stocks in the S&P 500 Index. I think this is useful because it shows what is happening with the stocks in the...
READ MORE
MEMBERS ONLY
CONSOLIDATION OR DISTRIBUTION?
Over the course of the past 4-months, price action in all of the indices have been "locked" within wide trading ranges. One question to be be answered is whether this is a "consolidation" to new highs; or a "distribution" to lower lows. If...
READ MORE
MEMBERS ONLY

CHART OVERLAYS COMING THIS WEEK
MURPHYMORRIS.COM TRANSITION COMPLETE - We have moved all of the MurphyMorris.com content from that website into the "John Murphy" section of StockCharts.com now. Subscribers to the Murphy Market Message should now click on the "John Murphy" tab at the top of our pages to...
READ MORE
MEMBERS ONLY
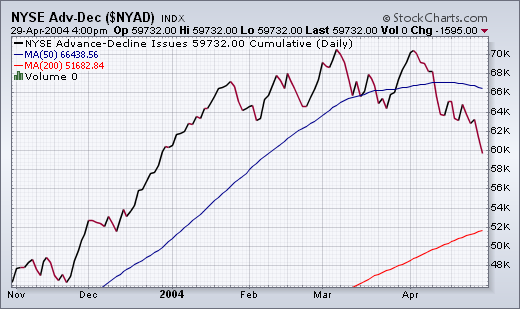
A-D LINE TURNS DOWN
LOWEST LEVEL IN MONTHS... It's been awhile since we've talked about the Advance-Decline lines in the various markets. The two charts below show why we're showing them now. The NYSE Advance-Decline line has fallen to the lowest level in four months. This...
READ MORE
MEMBERS ONLY
Hello Fellow ChartWatchers!
Rolling over. The short term technical picture shows the markets rolling over right now into a new down leg. The key test will be when the Nasdaq tries to move below 1900 this week. Right now, most technical signals point to much lower prices if that occurs. John Murphy and...
READ MORE
MEMBERS ONLY

ADVANCE-DECLINE LINES TURN DOWN -- THE DOLLAR IS TESTING ITS 200-DAY AVERAGE -- S&P AND NASDAQ ARE STALLED AT LONG-TERM RESISTANCE -- RISING RATES HURT FINANCIALS -- MONEY IS MOVING INTO CONSUMER STAPLES, ENERGY, AND HEALTHCARE
by John Murphy,
Chief Technical Analyst, StockCharts.com
RALLY MAY BE STALLING... The major downtrend in the U.S. Dollar Index was interrupted during first quarter when the greenback put in an intermediate term bottom. It moved over its 50-day average in mid-February which confirmed that the immediate trend had turned higher. As Chart 1 shows,...
READ MORE
MEMBERS ONLY

SIGNS OF INFLATION PUSH BOND YIELDS TO EIGHT MONTH HIGH -- SOX HITS SIX MONTH LOW AS TECHS LEAD MARKET SELLOFF -- CONSUMER STAPLES GAIN GROUND -- NASDAQ HEADING FOR RETEST OF 200-DAY AVERAGE
by John Murphy,
Chief Technical Analyst, StockCharts.com
GDP REPORT REVEALS SOME INFLATION ... The first quarter GDP report came in at 4.2% which was a little less than expected. What was more notable was a jump in inflation. The personal consumption expenditure price index (which Mr. Greenspan is known to watch) rose 3.2%, which was the...
READ MORE
MEMBERS ONLY

MONEY IS MOVING TO CONSUMER STAPLES -- COCA COLA ENTERPRISES, GILLETTE, AND SARA LEE ARE AT OR NEAR FOUR-YEAR HIGHS
by John Murphy,
Chief Technical Analyst, StockCharts.com
CONSUMER STAPLE LEADERSHIP... Given the markets recent problems, it's no surprise to see money flowing to defensive consumer staples. Chart 1 shows the Consumer Staple ETF trading near its old high and well over its 50-day moving average. More importantly, its relative strength has been rising since...
READ MORE
MEMBERS ONLY

INDUSTRIAL AND PRECIOUS METALS LEAD MARKET LOWER -- GOLD FALLS $13
by John Murphy,
Chief Technical Analyst, StockCharts.com
MATERIALS FALL HARDEST... In a generally weak market, Materials are the weakest sector. Most of that selling is coming in industrial and precious metals. In addition to rising rates here in the states -- and a stronger dollar -- a statement out of China that they may take more aggressive steps to...
READ MORE
MEMBERS ONLY

ENERGY STOCKS ADVANCE IN MIXED MARKET -- BJSERVICES HITS NEW RECORD -- BIOTECHS CONTINUE RALLY AS MEDIMMUNE BREAKS OUT -- SOX PULLS NASDAQ LOWER -- JNJ, XOM, AND RJR KEEP BIG BOARD IN THE BLACK
by John Murphy,
Chief Technical Analyst, StockCharts.com
OIL SERVICE STOCKS ARE BIGGEST GAINERS --... Energy stocks were standout performers in a mixed market today. Percentage-wise, oil service stocks showed the biggest gains in the oil patch. Chart 1 shows the Oil Service Index climbing to the highest level in two months. Its relative strength line is close...
READ MORE
MEMBERS ONLY
OIL SERVICE STOCKS LEAD S&P 500 RALLY
by John Murphy,
Chief Technical Analyst, StockCharts.com
OSX LEADS STRONG ENERGY SECTOR... In Tuesday morning trading, energy is the top sector in a rising market. Oil service stocks are the day's top energy group. Chart 1 shows the Oil Service Index moving up to challenge its early March high. Its relative strength line is also...
READ MORE
MEMBERS ONLY

Internal Test Message - Please Disregard
by John Murphy,
Chief Technical Analyst, StockCharts.com
This is an internal test message... we're working on stuff. Please disregard this message.
Chart 1
Chart 2...
READ MORE
MEMBERS ONLY

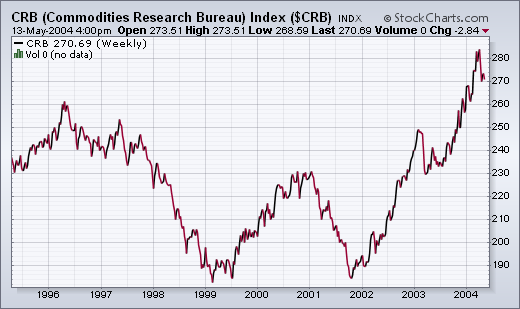
CRB INDEX DROPS ALONG WITH BASIC MATERIALS -- BETTER HEALTHCARE -- NSC LEADS TRANSPORTS -- AUTOS ARE GEARING UP
by John Murphy,
Chief Technical Analyst, StockCharts.com
CRB INDEX BREAKS 50-DAY AVERAGE... The downside correction in commodity prices took a more serious turn today when the CRB Index fell below its 50-day moving average by the widest margin in nine months. That suggests that the recent dollar rally is causing selling across a broader selection...
READ MORE
MEMBERS ONLY

BOND YIELDS HIT 2004 HIGH -- SOX PULLS NASDAQ LOWER -- MAJOR AVERAGES BREAK 50-DAY LINES -- GOLD STOCKS BREAK SUPPORT -- NO NEED TO WAIT ON MR. GREENSPAN TO TELL US RATES ARE HEADED HIGHER -- THE MARKETS ALREADY KNOW IT
by John Murphy,
Chief Technical Analyst, StockCharts.com
10-YEAR T-NOTE YIELD CLIMBS AGAIN... Comments from Mr. Greenspan may have had something to do with pushing bond yields higher today and stock prices lower. His remarks on the banking industry made reference to higher interest rates. That's not what either market wanted to here. Traders...
READ MORE
MEMBERS ONLY

COCA COLA LEADS CONSUMER STAPLE ETF TO 52-WEEK HIGH
by John Murphy,
Chief Technical Analyst, StockCharts.com
CONSUMER NON-CYCLICAL ISHARES HIT NEW HIGH... Of the nine Sector Select SPDRS traded on the American Stock Exhange, the only one to reach a new 52-week high today was the Dow Jones Consumer Non-cyclical iShares shown in Chart 1. The relative strength line along the bottom of...
READ MORE
MEMBERS ONLY

BIOTECH IS DAY'S TOP SECTOR -- ETFS ARE STRONG -- BIOGEN IDEC HITS TWO YEAR HIGH AND IS BIOTECH LEADER
by John Murphy,
Chief Technical Analyst, StockCharts.com
BIOTECH INDEX IS MONDAY'S LEADER... Last week's healthcare bounce was led by pharmaceuticals. This week leadership appears to passing to the biotech group. The Biotech Index (BTK) is up 1.8% in Monday morning trading and is the day's top market group. Chart 1...
READ MORE
MEMBERS ONLY
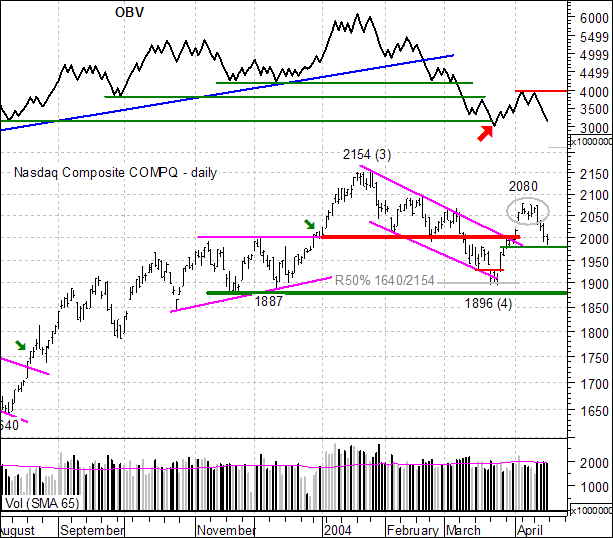
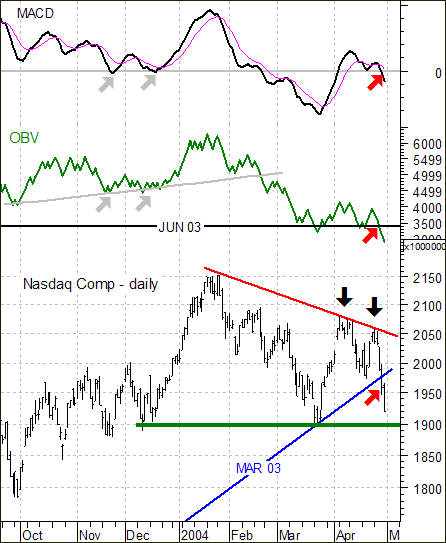
NASDAQ AND OBV
On Monday we were focused on the pennant consolidation with support at 2038 and resistance at 2080 (gray oval). While these are typically bullish continuation patterns and an upside breakout was expected, it was prudent to wait for confirmation. Instead of the expected, the break came to the downside and...
READ MORE
MEMBERS ONLY
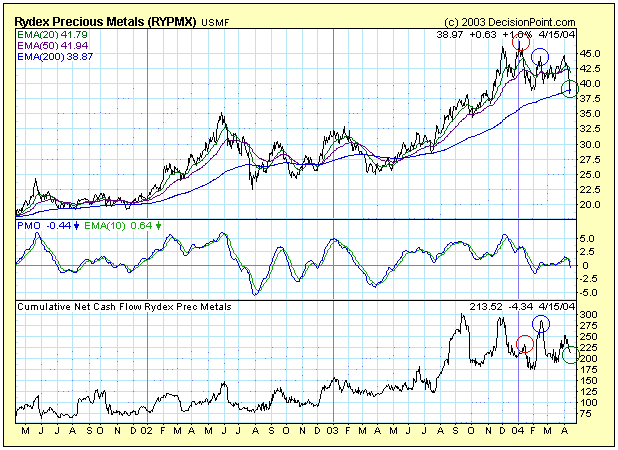
RYDEX PRECIOUS METALS FUND NET CASH FLOW SPELLS TROUBLE AGAIN
DecisionPoint.com tracks net cumulative cash flow of Rydex mutual funds as a way of estimating sentiment in various sectors. The theory is that money 'ought' to follow prices, more or less. In the last several months this indicator has been rather helpful in identifying problematic price moves...
READ MORE
MEMBERS ONLY
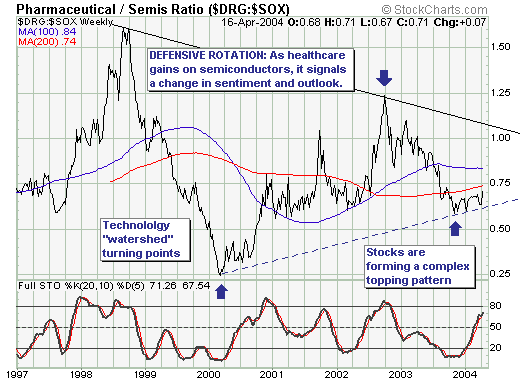
ROTATION FROM TECH TO HEALTHCARE SECTORS
This past week brought in "clear view" the under the surface rotation that has been occurring from the technology sector into the healthcare/pharmaceutical sector - and thus we think it important to look at the Pharmaceutical/Semiconductor RATIO. That said, this "repositioning" is extremely important in...
READ MORE
MEMBERS ONLY
MURPHYMORRIS.COM CLOSING
MURPHYMORRIS.COM CLOSING SOON - Sometime in the next couple of days, we expect to complete the transition of John Murphy's tools and commentary from the "Members" tab on the MurphyMorris.com website to the "John Murphy" tab on the StockCharts.com website. For sometime...
READ MORE
MEMBERS ONLY
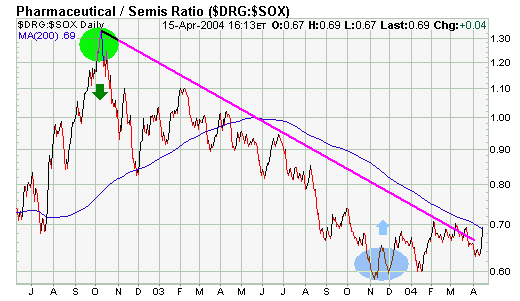
THE DRG/SOX RATIO
DRG/SOX RATIO IS RISING... Earlier in the year I did an analysis of the DRG/SOX ratio as a way to try to measure the mood of the market. The ratio divides the Drug Index (DRG) by the Semiconductor (SOX) Index. The idea is that when investors are confident...
READ MORE
