MEMBERS ONLY

Four MACD Patterns That Repeat

by Joe Rabil,
President, Rabil Stock Research
On this week's edition of Stock Talk with Joe Rabil, Joe explains how to use 4 different MACD signals in multiple timeframes to tell us when to buy. He shows how MACD can confirm the MA lines, and ADX and help to improve timing and anticipate an entry....
READ MORE
MEMBERS ONLY

Scanning for Strong Reversals via Bullish Engulfing Patterns

by Karl Montevirgen,
The StockCharts Insider
The market's pulling back, but you expect the decline to be short-lived. You believe it's a mere dip, so you're scanning the market for a few stocks that might be on the verge of a strong upside reversal. One pattern you might want to...
READ MORE
MEMBERS ONLY

Consumer Sector ETF XRT Has Some Words for You
Tuesday's Daily was all about the metals. On Wednesday, gold, miners, and silver all rallied.
Is the bottom in on this last correction? Perhaps.
Two interesting areas to watch now are the one-year PCE rate-adjusted. And the retail sector is now on critical lows. In other words, we...
READ MORE
MEMBERS ONLY
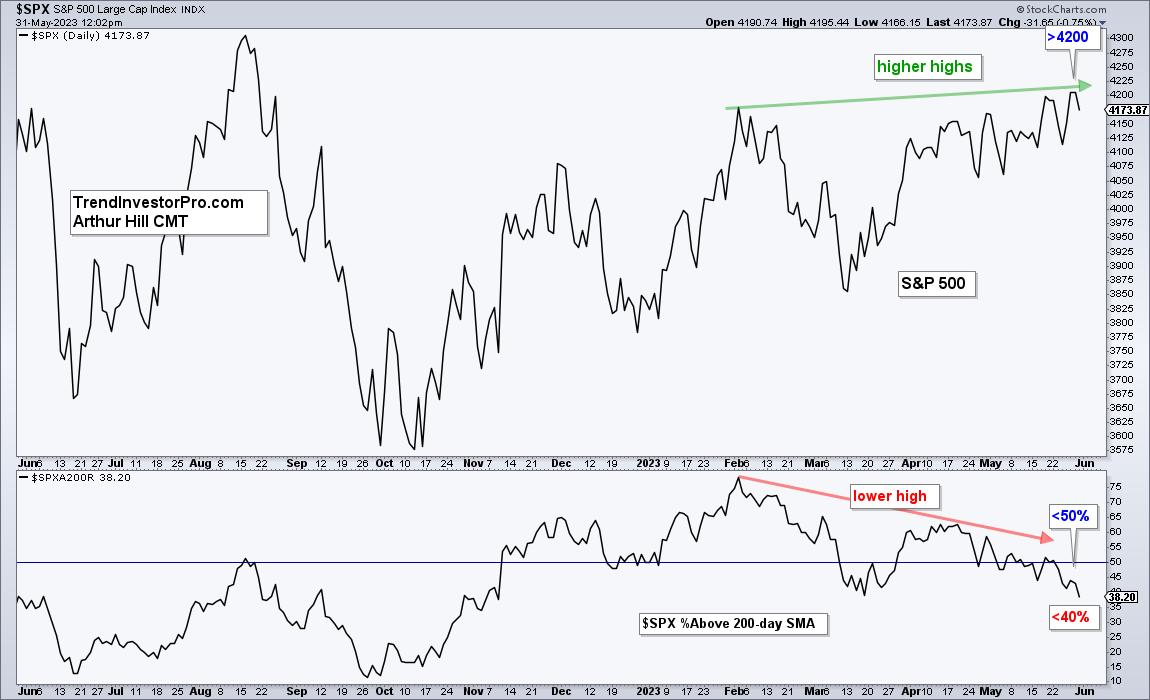
Pesky Breadth Divergence Persists

by Arthur Hill,
Chief Technical Strategist, TrendInvestorPro.com
The S&P 500 recently moved above its February high to extend its uptrend, but all is not well under the surface. Fewer stocks are participating in the May advance and a key breadth indicator formed a bearish divergence. Bearish divergences form when price records a higher high and...
READ MORE
MEMBERS ONLY
Perhaps It's Time for the Laggards to Catch Up?

by Martin Pring,
President, Pring Research
The recent strong performance by a few tech stocks has gained widespread attention, as has the disappointing market breadth. The result has been a soaring NASDAQ and a lagging NYSE Composite and Dow. Small cap stocks have also left a lot to be desired. The question is whether this divergence,...
READ MORE
MEMBERS ONLY
Precious Metals and Miners Ready to Rally
In gold futures, we were looking for a correction to around $1940 an ounce.
The June contract fell to $1932. Now, it closed on the exchange at $1958. Plus, it had a new 60-day low and potential reversal pattern.
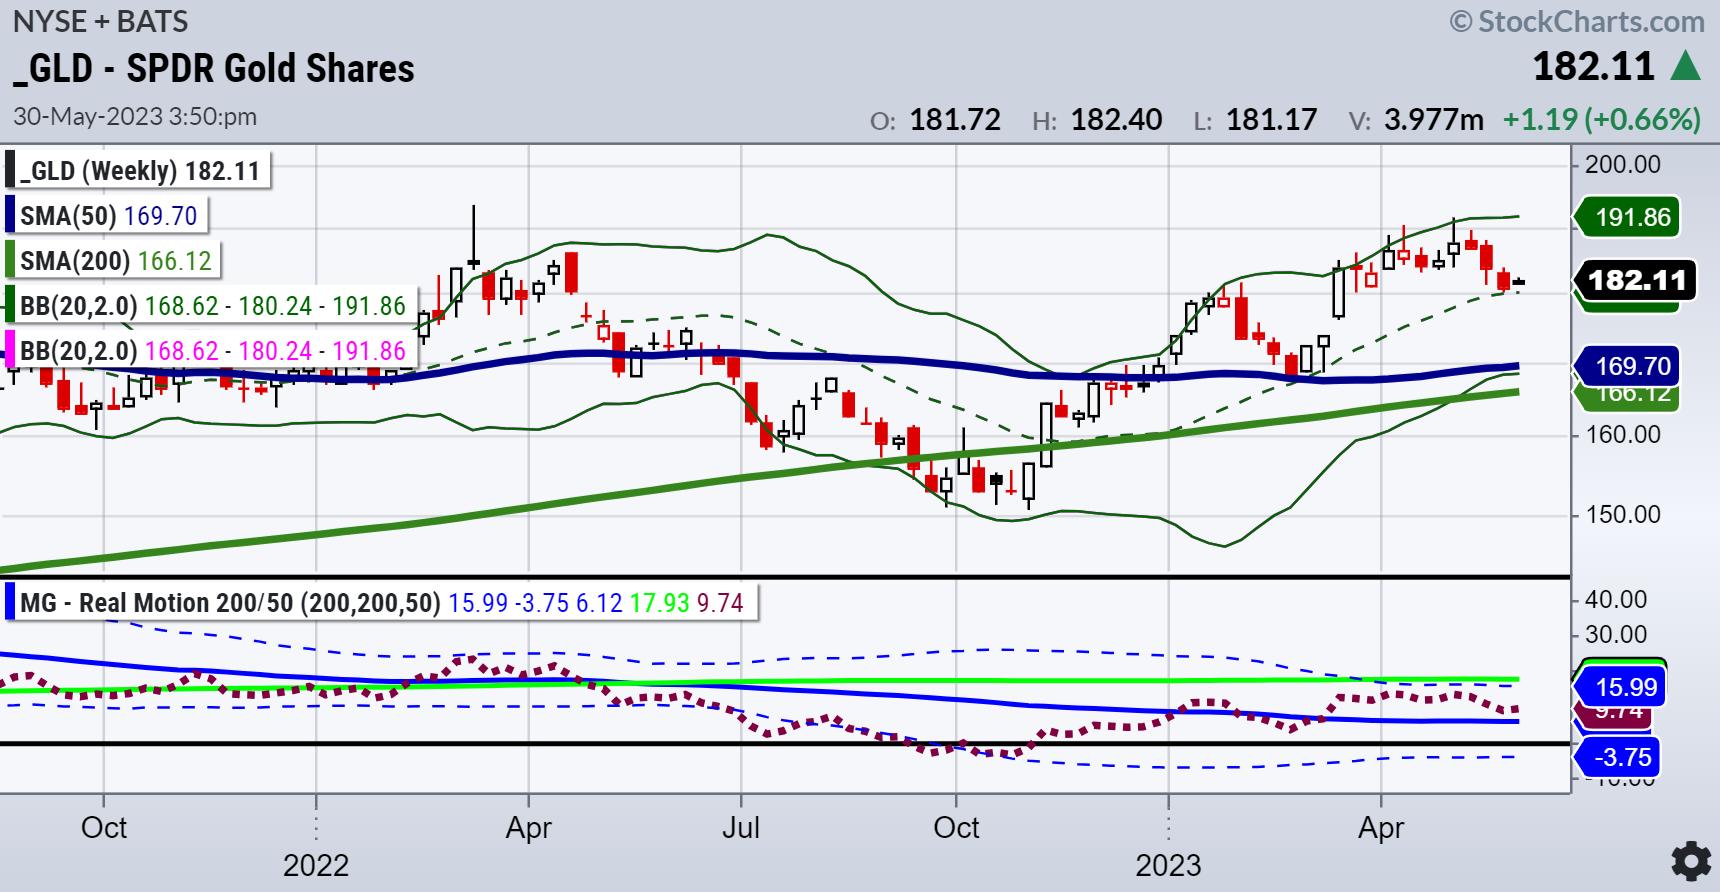
The Gold ETF (GLD) has begun this week trading inside the...
READ MORE
MEMBERS ONLY

Sector Spotlight: Will Tech Take a Seasonal Break in June?

by Julius de Kempenaer,
Senior Technical Analyst, StockCharts.com
In this episode of StockCharts TV's Sector Spotlight, wrapping up the month of May, I dive into the seasonal characteristics of the markets. I start with a quick look back at seasonal rotation during the current month, then assess the seasonal expectation for the S&P 500...
READ MORE
MEMBERS ONLY

Is This BUD Still For You?
by Karl Montevirgen,
The StockCharts Insider
BUD's stock price has fallen hard, but it may be at a critical buy point.Is the king of beers (or rather, its parent company) a good buy, or is it something to avoid for now? Let's take a closer look.
What Happened to BUD?
In...
READ MORE
MEMBERS ONLY

Podcast on Macro to Micro in Markets
This past week, we have written a lot about tech (another AI-generated photo), the discordance between the small caps and large caps, rates, debt ceiling and the Fed.
For this weekend, we want to invite you to have a listen to the live coaching Mish does exclusively for our MarketGauge...
READ MORE
MEMBERS ONLY

Fight This Bullish Development At Your Own Risk

by Tom Bowley,
Chief Market Strategist, EarningsBeats.com
Sentiment was a HUGE problem for the bulls to start 2022 and now it's become a similarly big issue for the bears now. If you haven't noticed, most bulls don't begin to turn bearish until after all or most of the selling is complete....
READ MORE
MEMBERS ONLY
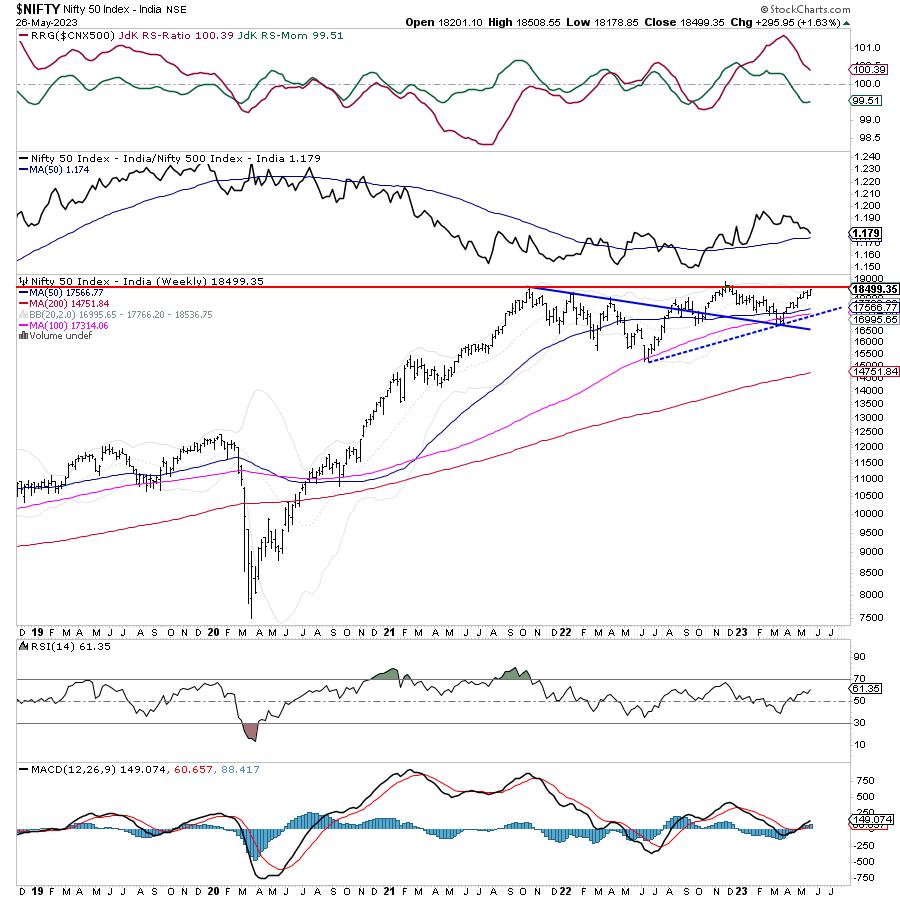
Week Ahead: NIFTY Placed at Decisive Levels; Set To Begin a Directional Move

by Milan Vaishnav,
Founder and Technical Analyst, EquityResearch.asia and ChartWizard.ae
After taking a brief breather last week, the Indian equities have now extended their up move. After trading buoyant and with limited downsides all through the last five sessions, the headline index ended on a decently positive note. The Nifty oscillated in a 329.70 points range and, while it...
READ MORE
MEMBERS ONLY
Here's a Fresh Look at the Markets Using a Longer-Term Lens

by Mary Ellen McGonagle,
President, MEM Investment Research
We're at a potentially exciting juncture in the markets, with bigger trend shifts shaping up that you might find surprising. With all the talk about sticky inflation, an uncertain interest rate outlook and recession fears amid tightening of bank lending, it's easy to throw your arms...
READ MORE
MEMBERS ONLY
The Downside to This Up Market

by David Keller,
President and Chief Strategist, Sierra Alpha Research
Are stocks in a bull market phase at the moment?
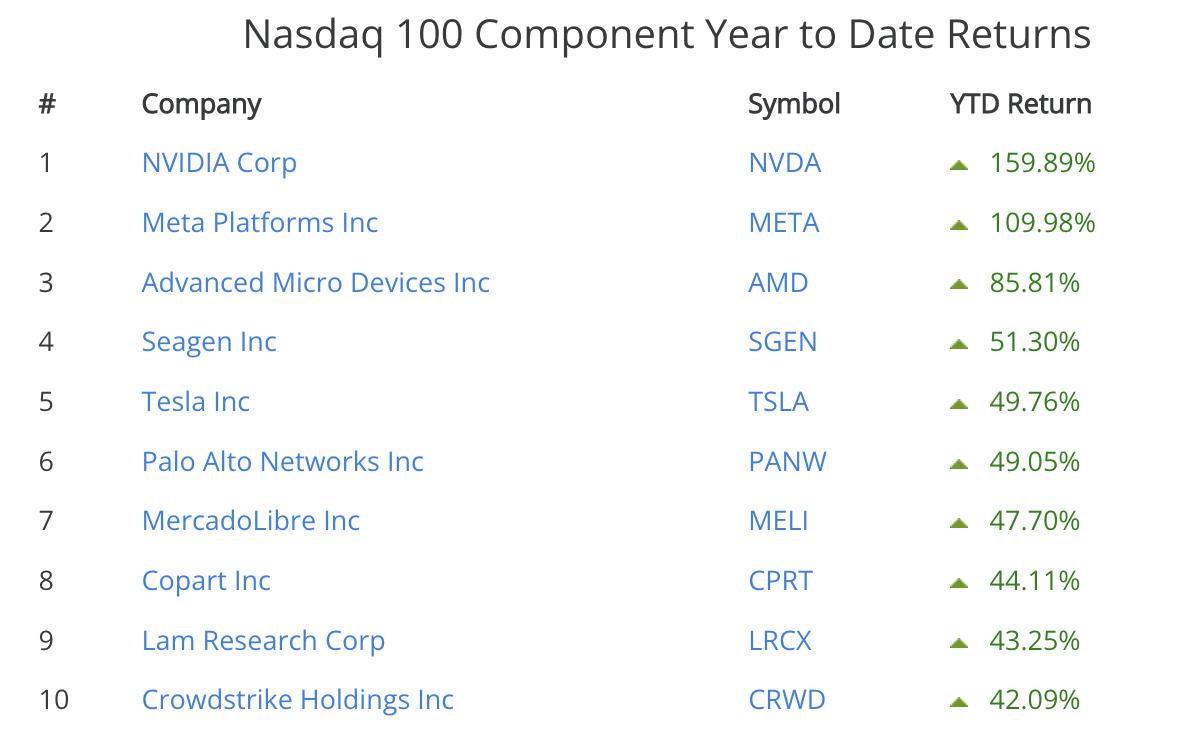
Well, that certainly depends on where you're looking. If you're analyzing the Nasdaq 100 index, or semiconductors, or AAPL, or NFLX, or a handful of other mega-cap growth names, then that is basically an undeniable truth...
READ MORE
MEMBERS ONLY

MEM TV: S&P 500 Inches Above Resistance
by Mary Ellen McGonagle,
President, MEM Investment Research
In this episode of StockCharts TV'sThe MEM Edge, Mary Ellen reviews the broader market's move following the strong earnings report from Nvidia (NVDA) Wednesday afternoon. She also discusses which areas were most impacted and how you can capitalize on the renewed interest in AI. The rally...
READ MORE
MEMBERS ONLY

Tips n' Tricks to Enhance Your Chart Annotating

by Grayson Roze,
Chief Strategist, StockCharts.com
On this week's edition of StockCharts TV'sStockCharts in Focus, Grayson tours you through the chart annotation tools in both SharpCharts and ACP, our Advanced Charting Platform. Along the way, you'll get some helpful tips and tricks that will enhance your drawings and streamline your...
READ MORE
MEMBERS ONLY

Is the Big Move Real? Or Just a Quick AI-Generated Rally?

by Jayanthi Gopalakrishnan,
Director of Site Content, StockCharts.com
When the stocks of large-cap companies, such as Apple (AAPL), Microsoft (MSFT), Alphabet (GOOGL), Amazon.com (AMZN), and Nvidia (NVDA), keep moving higher and higher in an uncertain economic environment, it can be a cause for concern. Maybe investors have forgotten about these uncertainties surrounding the financial market—inflation is...
READ MORE
MEMBERS ONLY

Breadth Divergence Continues

by TG Watkins,
Director of Stocks, Simpler Trading
On this week's edition of Moxie Indicator Minutes, TG explains how today was all about NVDA, semis, and sympathy moves. If we look under the hood, we continue to see that some names are doing great, while many others remain weak. Let's look at those names,...
READ MORE
MEMBERS ONLY

CHIP STOCKS LEAD MARKET HIGHER -- SPX STILL LAGS BEHIND -- AUTOS HAVE A STRONG WEEK

by John Murphy,
Chief Technical Analyst, StockCharts.com
TALE OF TWO MARKETS... Previous messages have pointed out the growing gap between rising technology stocks and the rest of the market. That gap widened even further this week. Technology was once again the week's strongest sector thanks to surging chip stocks. The weekly bars in Chart 1...
READ MORE
MEMBERS ONLY

Do Profit Targets Add Value to a Strategy?
by Arthur Hill,
Chief Technical Strategist, TrendInvestorPro.com
My research suggests that profit targets improve results for trend-momentum strategies that trade ETFs. Note that performance improvements may differ for other strategies. This article will first show a trend-momentum setup on the chart. I will then provide some performance metrics for a basic strategy with and without a profit...
READ MORE
MEMBERS ONLY

GNG TV: Equity Markets Hanging on to "Go" Trend

by Alex Cole,
Co-founder, GoNoGo Charts®
In this edition of the GoNoGo Charts show, Alex takes a top-down approach to analyzing the markets using GoNoGo Charts unique approach. He shows how the major asset classes are performing, then looks at the macro factors that affect the equity markets. Treasury rates, gold, oil and the dollar all...
READ MORE
MEMBERS ONLY
Top AI Add-On Plays After Nvidia's Strong Earnings Report
by Mary Ellen McGonagle,
President, MEM Investment Research
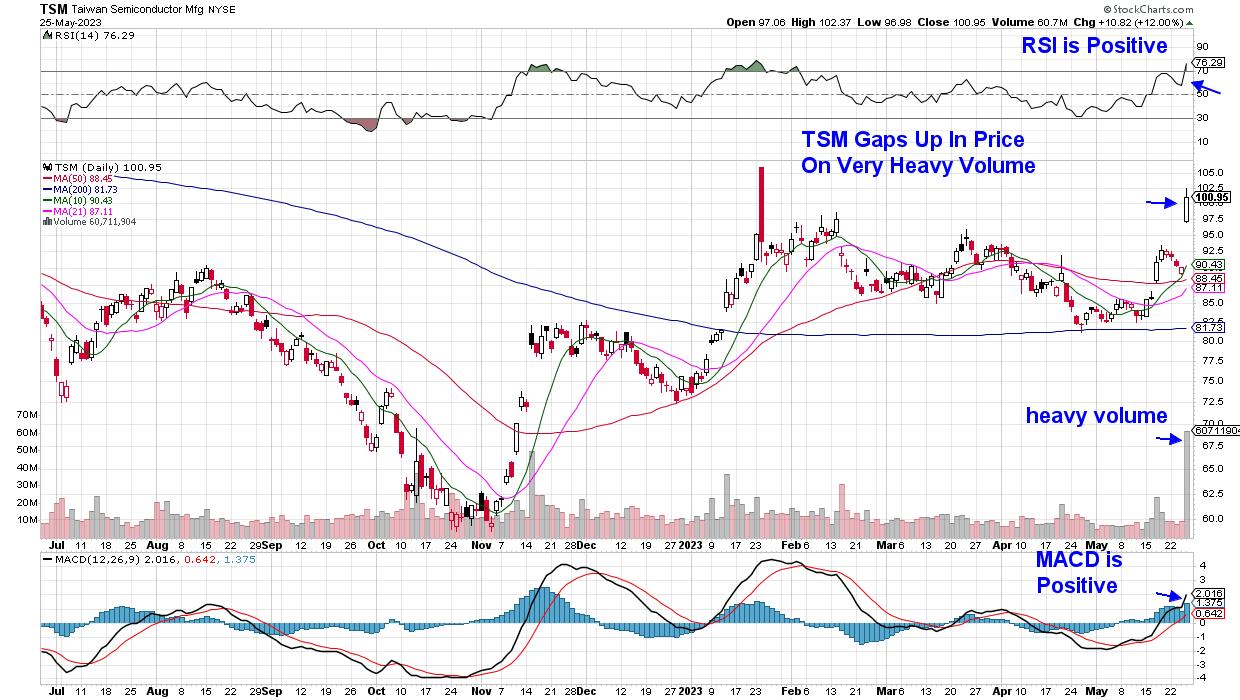
Shares of Nvidia (NVDA) soared today after the company reported earnings that were well above estimates. Most impressive, however, was the company's estimates for next quarter's revenues, which were more than 50% above what Wall Street projected. NVDA cited surging demand for its chips that help...
READ MORE
MEMBERS ONLY
Use ADX to Define WHAT to Do
by Joe Rabil,
President, Rabil Stock Research
On this week's edition of Stock Talk with Joe Rabil, Joe tries to simplify the ADX indicator by showing how it will help to determine what you should be doing - pullback or breakout. He then explains how to use these tools in multiple timeframes to improve timing...
READ MORE
MEMBERS ONLY

Hershey Stock Pulls Back: Now's Your Second Chance
by Jayanthi Gopalakrishnan,
Director of Site Content, StockCharts.com
Hershey's stock has pulled back. If you missed a previous opportunity to own the stock, this may be your second chance. Explore a few simple technical analysis tools that can help determine if the stock presents a buying opportunity.
Are you bummed out that you missed a stock...
READ MORE
MEMBERS ONLY

The Wisdom of Jesse Livermore, Part 6

by Dave Landry,
Founder, Sentive Trading, LLC
In this week's edition of Trading Simplified, Dave shows his methodology in action with a recent crypto and stock trade, where he's "free rolling," which he notes is the secret to longer-term trading success. He then resumes his series on the wisdom of Jesse...
READ MORE
MEMBERS ONLY

The Elders Both Fatigue: Grandpa Russell 2000 v. Granny Retail
Above is an AI image to illustrate that while, on Monday, Granddad Russell (IWM) was offering a helping hand to his wife Granny Retail (XRT), today they both looked more vulnerable.
Just as the S&P 500 failed to clear its 23-month moving average, we are hoping that IWM...
READ MORE
MEMBERS ONLY
Consumer Staples Stocks Have Broken Key Support - Here's What You Need to Know
by Mary Ellen McGonagle,
President, MEM Investment Research
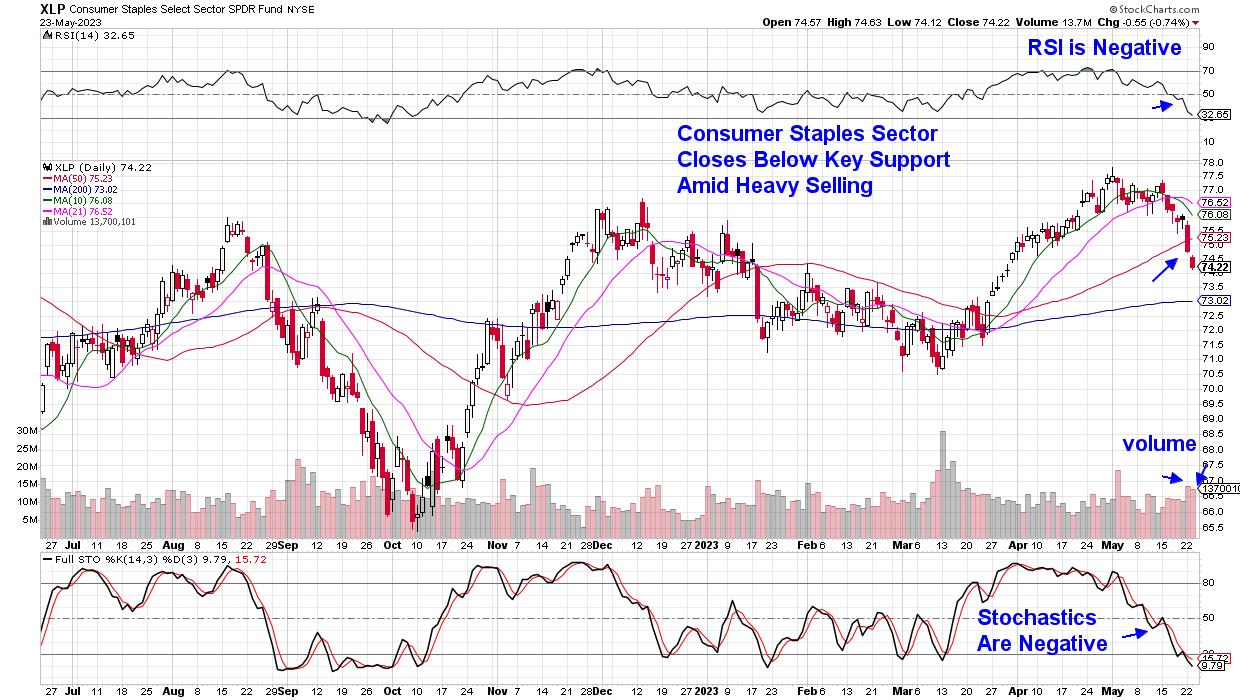
The Consumer Staples sector closed below its key 50-day moving average yesterday and is on track to be the worst-performing area for the week. This underperformance began last week and took place along with other defensive areas of the market, such as Utilities and Healthcare. At first glance, it appeared...
READ MORE
MEMBERS ONLY
Sector Spotlight: Big Bases in Technology Support SPY
by Julius de Kempenaer,
Senior Technical Analyst, StockCharts.com
In this episode of StockCharts TV's Sector Spotlight, I look at sector rotation while breaking down the universe into offensive, defensive, and sensitive sectors. I then zoom in on the groups that make up the technology sector and some of the stocks in them, where I find a...
READ MORE
MEMBERS ONLY

Celebrating AAPI Heritage Month: Jonathan Lin's Road From IT to Technical Analysis
by Jayanthi Gopalakrishnan,
Director of Site Content, StockCharts.com
May is Asian American and Pacific Islander Heritage Month. In recognition of the AAPI community, StockCharts spoke with a few individuals in the financial community about how their experiences, challenges, and heritage helped shape their careers in finance.
Jonathan Lin, CMT, CFA, Chief Strategist at JL Market Technicals, has spent...
READ MORE
MEMBERS ONLY

Small Caps Are Ready To Launch!
by Tom Bowley,
Chief Market Strategist, EarningsBeats.com
There are many who have given up on the small cap community, but I'm not one of them. The long-term 15-year chart remains in a solid uptrend. Yes, the group has been underperforming the S&P 500 for quite awhile, but that's been the standard...
READ MORE
MEMBERS ONLY

Battle of the Elders: Grandpa Russell 2000 v. Granny Retail
Just look at the March lows in Granddad Russell 2000 (IWM).
And now look at the March lows in Granny Retail (XRT).
So who is right?
IWM has moved up for the March lows and, to start the week, took the lead. It cleared the 50-DMA in price, and is...
READ MORE
MEMBERS ONLY

DP Trading Room: Advance-Decline Lines Explained

by Erin Swenlin,
Vice President, DecisionPoint.com

by Carl Swenlin,
President and Founder, DecisionPoint.com
In this week's edition of The DecisionPoint Trading Room, Carl opens the Trading Room with a discussion on what the Advance-Decline Line is and how it is calculated. Importantly, he shows us how best to use it. Erin dives into the Energy Sector (XLE) and covers the industry...
READ MORE
MEMBERS ONLY

Gold's Wild Ride: A Bullish Uptrend or a Bearish Freefall?
by Karl Montevirgen,
The StockCharts Insider
A couple of weeks ago (early May), the price of spot gold reached a high of $2085 an ounce, nearly challenging its all-time high of around $2089 last reached in 2020. Since then, gold's had a rough ride. Last week, prices plummeted almost $30 per ounce thanks to...
READ MORE
MEMBERS ONLY

Wall Street's Hunger Games Are Now Complete
by Tom Bowley,
Chief Market Strategist, EarningsBeats.com
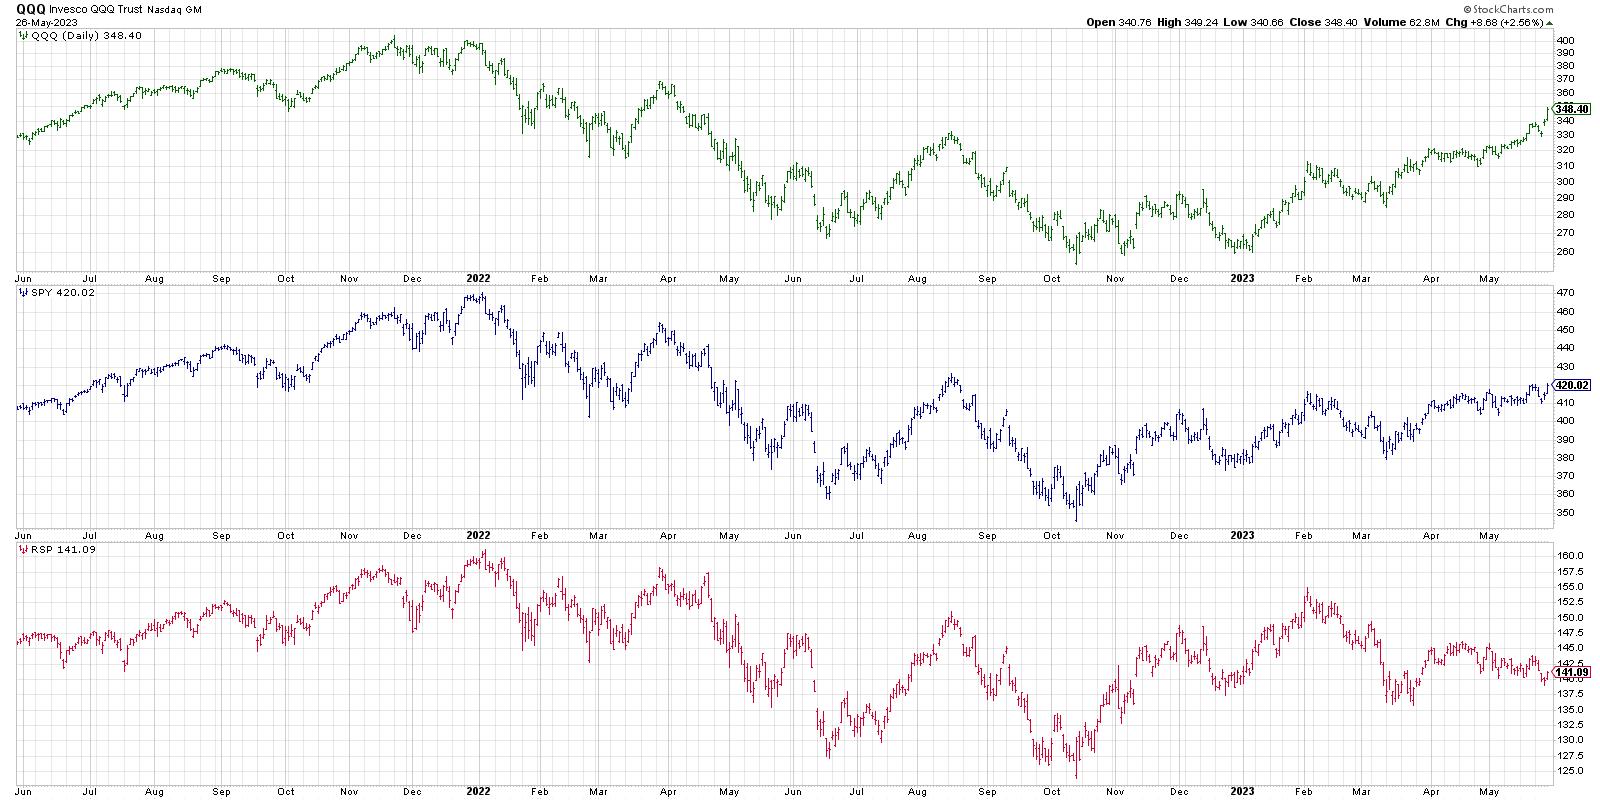
It was the culmination of many months of accumulation by Wall Street firms. I've discussed this accumulation, or manipulation, over and over and over and indicated that it was the likely precursor to a big stock market advance. I've updated a chart of the QQQ (ETF...
READ MORE
MEMBERS ONLY
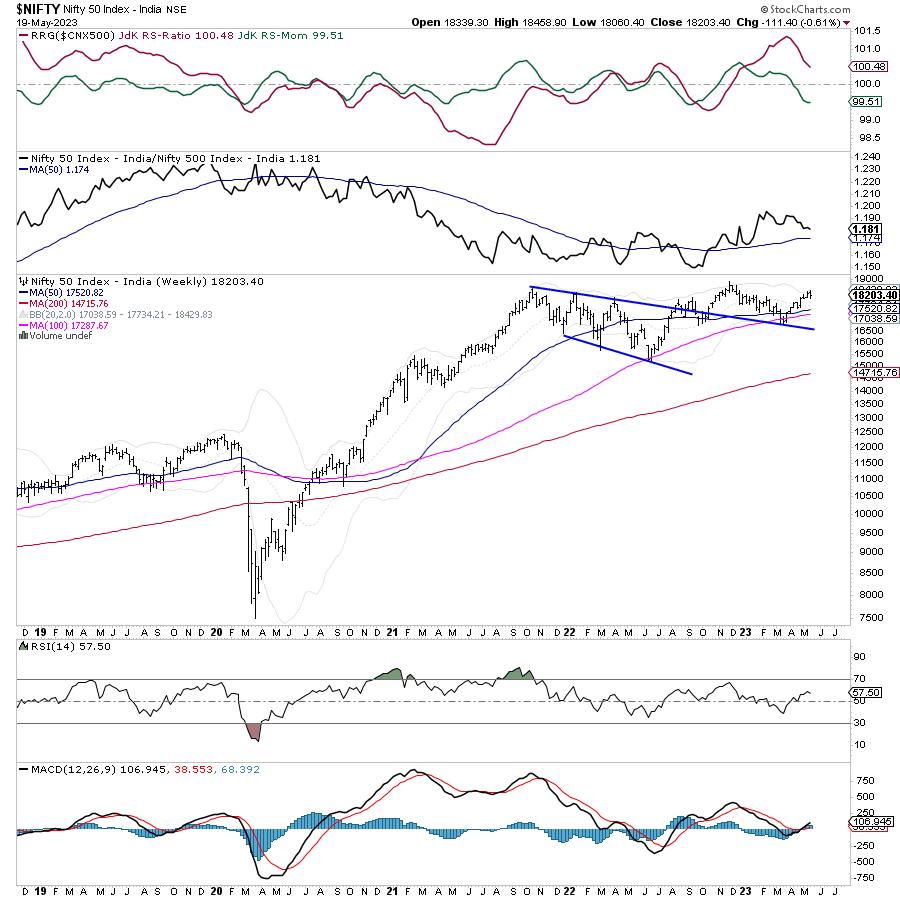
Week Ahead: NIFTY to Face Monthly Derivatives Expiry Resisting Key Levels; Moving Past This Zone Crucial
by Milan Vaishnav,
Founder and Technical Analyst, EquityResearch.asia and ChartWizard.ae
After rising three weeks in a row, the Indian equities took a breather, ending the week on a negative note much on the anticipated lines while resisting the key levels. There has been a slight divergence between the Indian markets and the global markets. Structurally speaking, SPX and other key...
READ MORE
MEMBERS ONLY
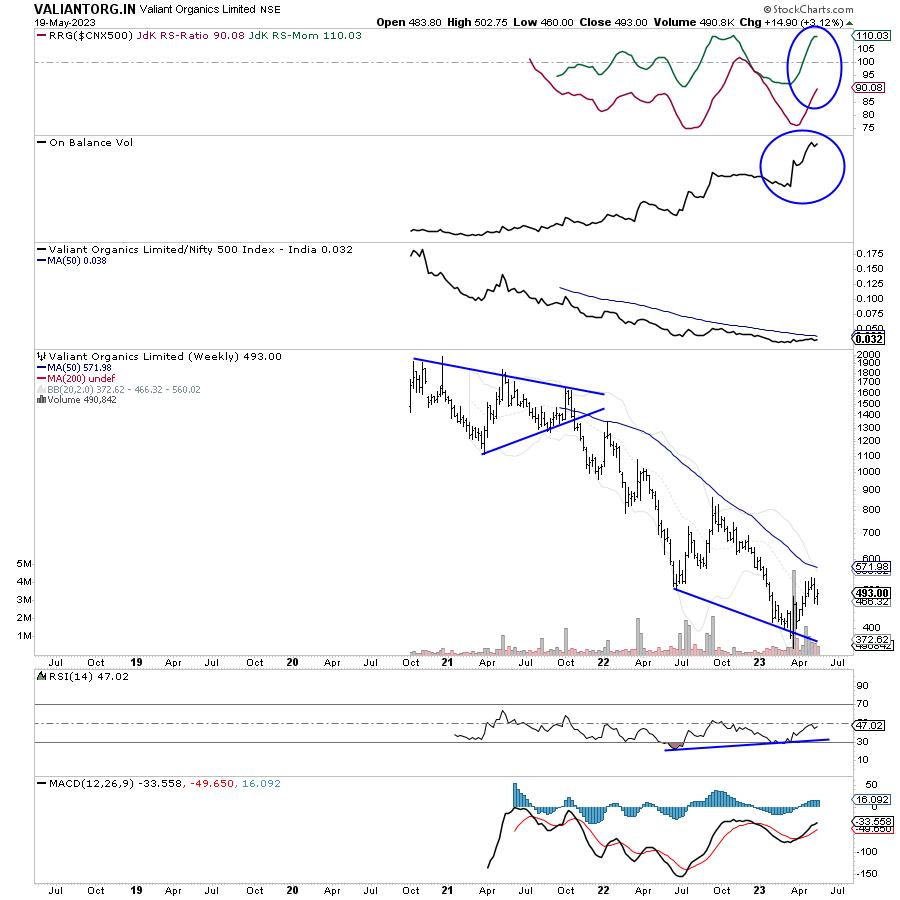
Can This Specialty Chemical Stock Become a Good Investment Bet?
by Milan Vaishnav,
Founder and Technical Analyst, EquityResearch.asia and ChartWizard.ae
There is a compelling argument for a possible change in trend direction for VALIANTORG.IN.
The stock has a relatively brief listing history on the NSE. However, upon analyzing the weekly chart, it appears that, after a significant decline, the stock might be in the process of reversing its trend....
READ MORE
MEMBERS ONLY
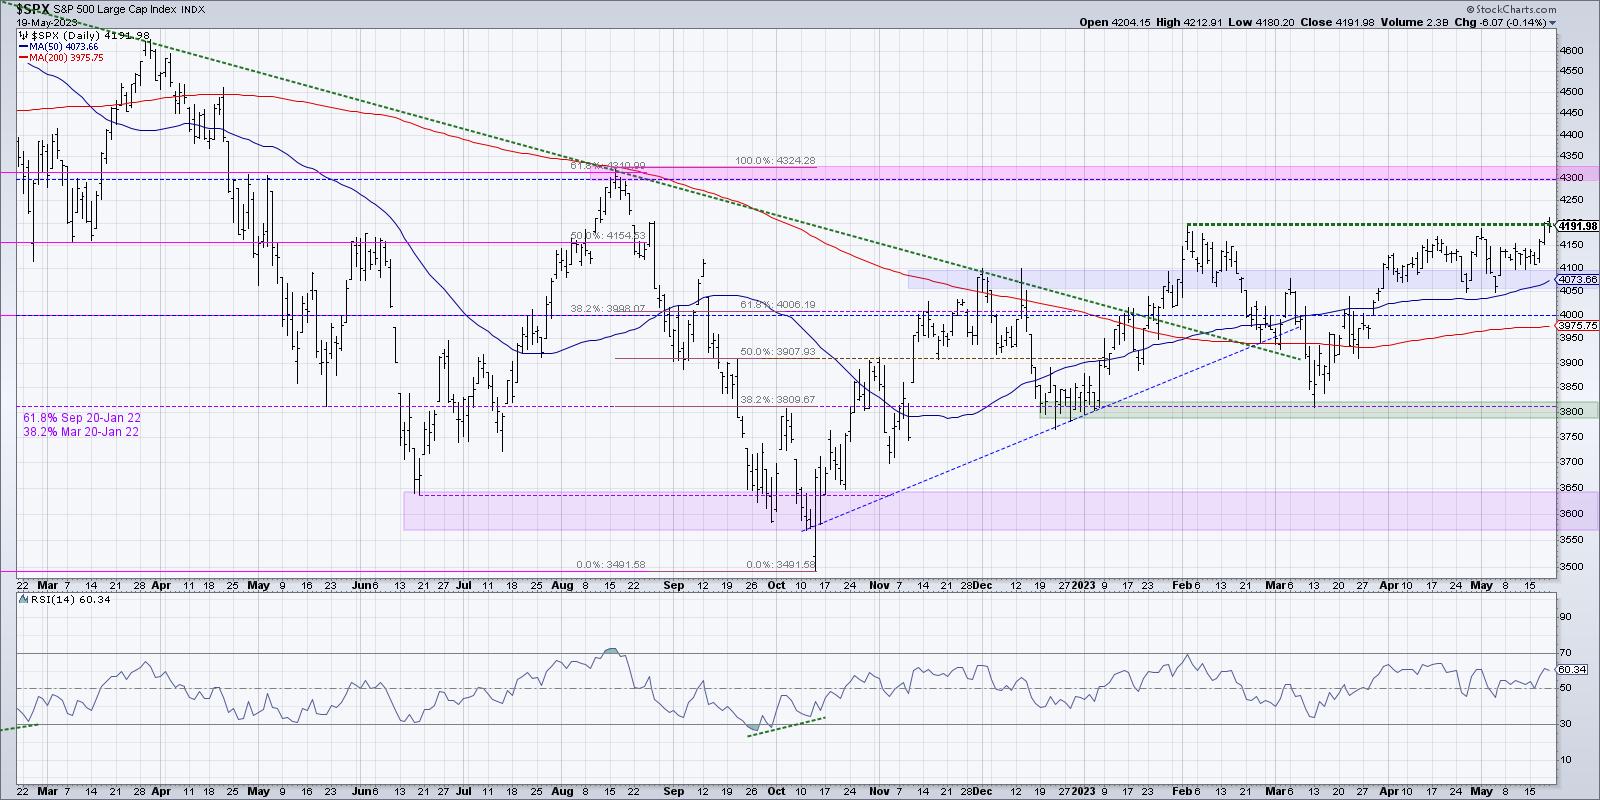
Fibonacci Says Upside to SPX 4300
by David Keller,
President and Chief Strategist, Sierra Alpha Research
Earlier this week, I completed a "clean slate" exercise on the S&P 500 chart.
You see, my charts become pretty busy over time, because I draw lots of trend lines and put notes on the charts as well. Basically, I consider charts to be the way...
READ MORE
MEMBERS ONLY
5 Must-Know Interactive Features to Supercharge Your Charting
by Grayson Roze,
Chief Strategist, StockCharts.com
On this week's edition of StockCharts TV'sStockCharts in Focus, Grayson gives you a quick tour of the StockCharts Advanced Charting Platform, ACP, and then highlights five of his favorite interactive features throughout the platform. You'll learn how these dynamic controls can streamline your charting...
READ MORE
MEMBERS ONLY
MEM TV: Breakouts and Downtrend Reversals in Key Areas
by Mary Ellen McGonagle,
President, MEM Investment Research
In this episode of StockCharts TV'sThe MEM Edge, Mary Ellen reviews buying opportunities after last week's break of the markets above its six-week trading range. She also highlights leadership areas and the best ways to capitalize.
This video was originally broadcast on May 19, 2023. Click...
READ MORE
MEMBERS ONLY
Be Willing to Change Your Mind
by TG Watkins,
Director of Stocks, Simpler Trading
Quite the difference two days will make! Positive news about the debt ceiling reveals what the market was waiting for. But even before that, many names have been quietly building strength. On this week's edition of Moxie Indicator Minutes, TG takes a look at what the higher time...
READ MORE
MEMBERS ONLY

Sucker Rally?
by Carl Swenlin,
President and Founder, DecisionPoint.com
Considering our bearish outlook, this week's rally has been hard to watch; however, the configuration of the Silver Cross Index* (SCI) continues to show how this rally may ultimately fail. On the chart below, we can see in 2022 the market fell off the all-time price high, initiating...
READ MORE
