MEMBERS ONLY

Earnings for 2023 Q2 Still Trending Up

by Carl Swenlin,
President and Founder, DecisionPoint.com
S&P 500 earnings are in for 2023 Q2, and here is our valuation analysis.
The following chart shows the normal value range of the S&P 500 Index, indicating where the S&P 500 would have to be in order to have an overvalued P/E...
READ MORE
MEMBERS ONLY
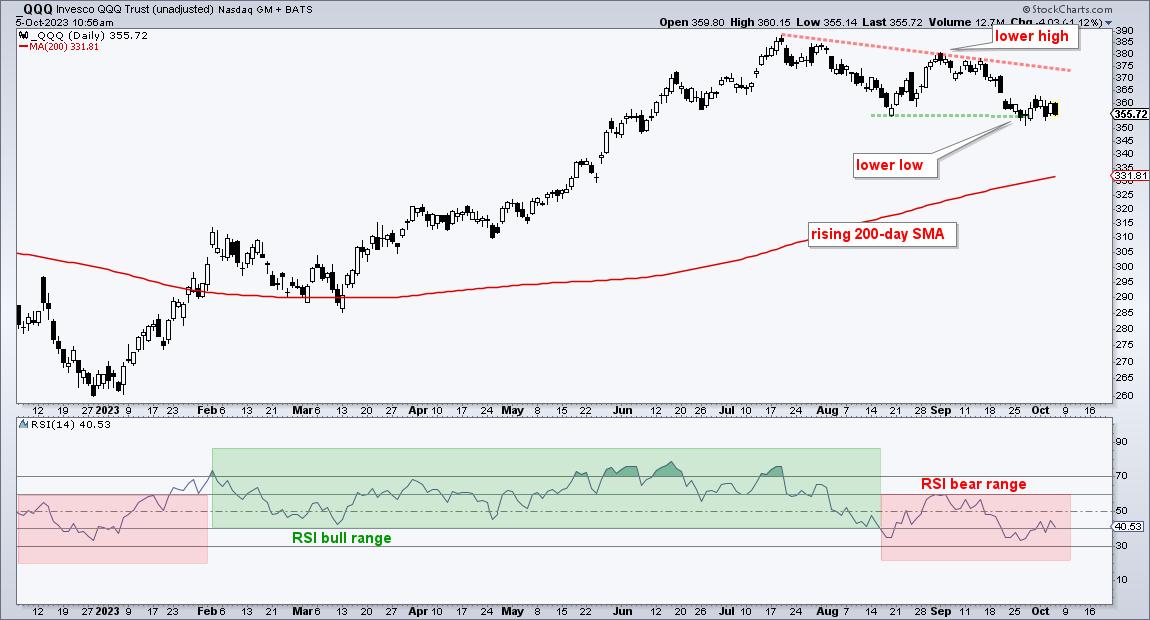
A Key Momentum Indicator Shifts from Bullish to Bearish for QQQ

by Arthur Hill,
Chief Technical Strategist, TrendInvestorPro.com
QQQ remains well above the rising 200-day SMA, but clearly shifted from bullish to bearish over the last two months. Today's report/video will show this momentum shift and analyze the short-term continuation pattern taking shape.
The chart below shows QQQ trading well above the rising...
READ MORE
MEMBERS ONLY
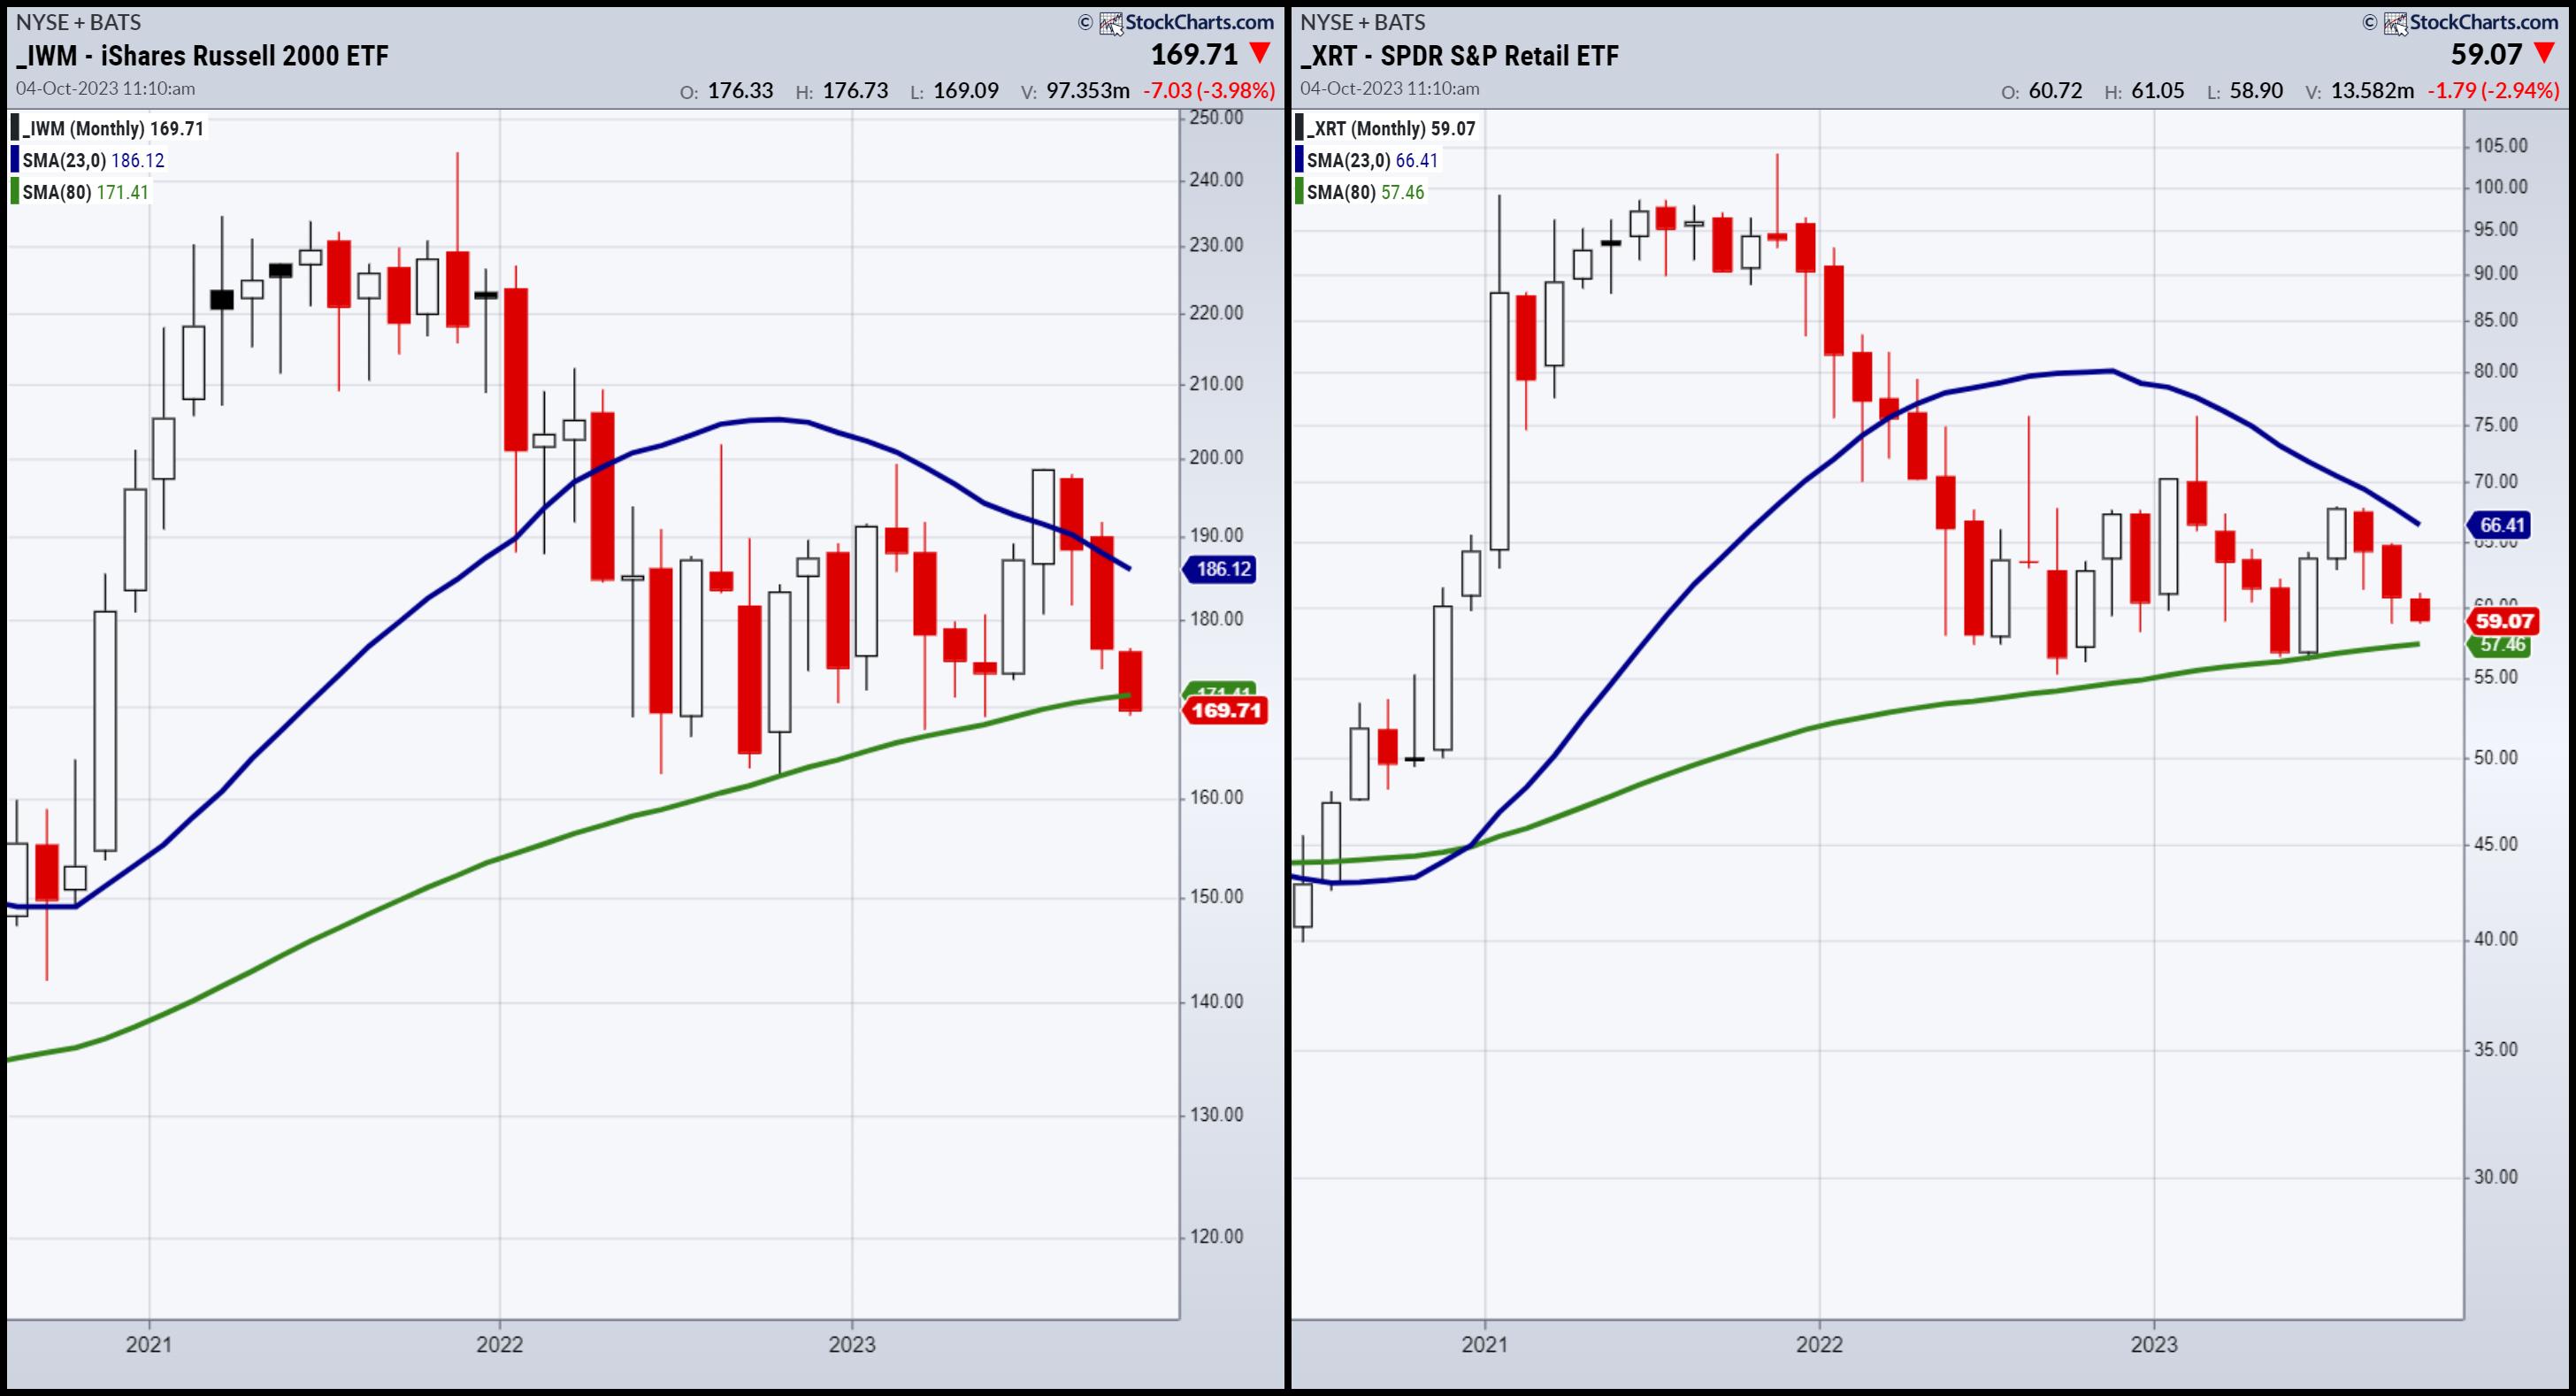
Watch Mish on Real Vision and More!
Yesterday, we covered the 80-month moving average in small caps and retail.
Today, I did several interviews -- some already out (BNN Bloomberg), others out soon (Financial Sense with Jim Pupluva), and the one that you'll find on YouTubelater today with Real Vision.
We chose this one to...
READ MORE
MEMBERS ONLY
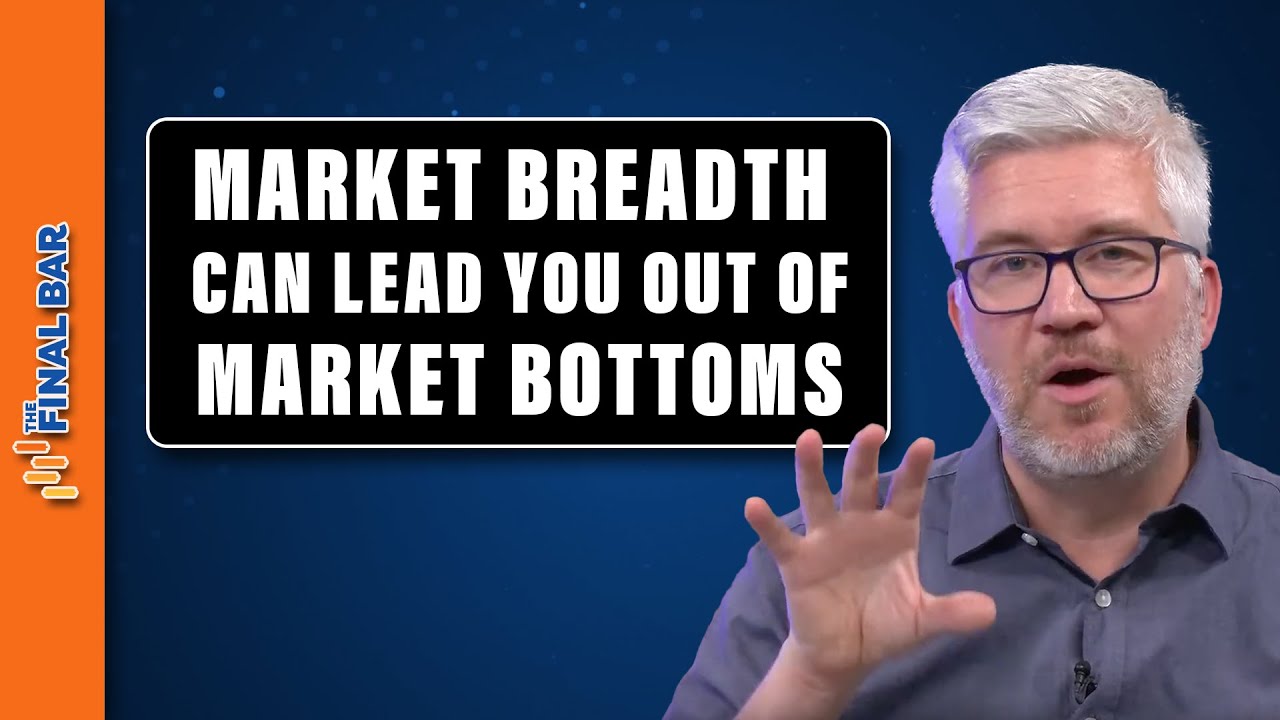
How Market Breadth Indicators Can Lead You Out of Market Bottoms

by David Keller,
President and Chief Strategist, Sierra Alpha Research
In this edition of StockCharts TV'sThe Final Bar, Dave digs out his market correction playbook and shares what market breadth indicators tend to do leading into and out of market bottoms. He also reveals the charts that can serve investors well in corrective phases, using relative strength as...
READ MORE
MEMBERS ONLY

10-Year Yield Spike Doesn't Mean Stock Market Will Plummet; You Need to See This Powerful Chart

by Karl Montevirgen,
The StockCharts Insider

by Jayanthi Gopalakrishnan,
Director of Site Content, StockCharts.com
KEY TAKEAWAYS
* Rising yields have wreaked havoc on equities but it's not necessarily a cause for worry
* Growth stocks have performed well during high interest rate environments and are likely to do so again
* The Bullish Percent Index can signal when a turnaround will occur
The stock market...
READ MORE
MEMBERS ONLY

How to Not Just Survive But PROSPER During Market Downturns

by Dave Landry,
Founder, Sentive Trading, LLC
In this week's edition of Trading Simplified, Dave shows his methodology in action by discussing his current portfolio and how he is seeing each position to its fruition. He then resumes his series on Jesse Livermore. This week, he explains how years of experience can give you intuition,...
READ MORE
MEMBERS ONLY
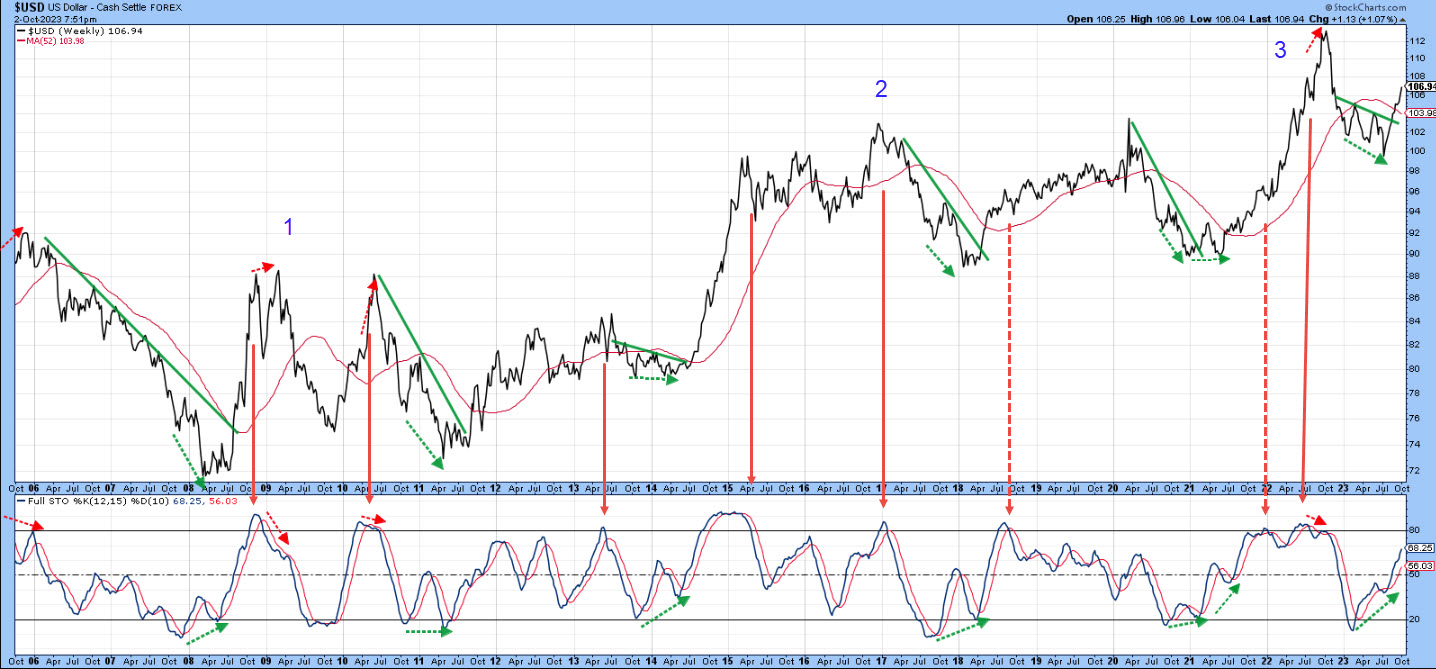
When the Dollar Stops Going Up, Will These Markets Stop Going Down?

by Martin Pring,
President, Pring Research
The Dollar Index
I last wrote an article on the dollar in August, The Dollar Index Goes to Missouri. In it, I pointed out that the Index had reached crucial resistance, which, if surpassed, would signal a new primary bull market and a likely fourth up leg to the secular...
READ MORE
MEMBERS ONLY
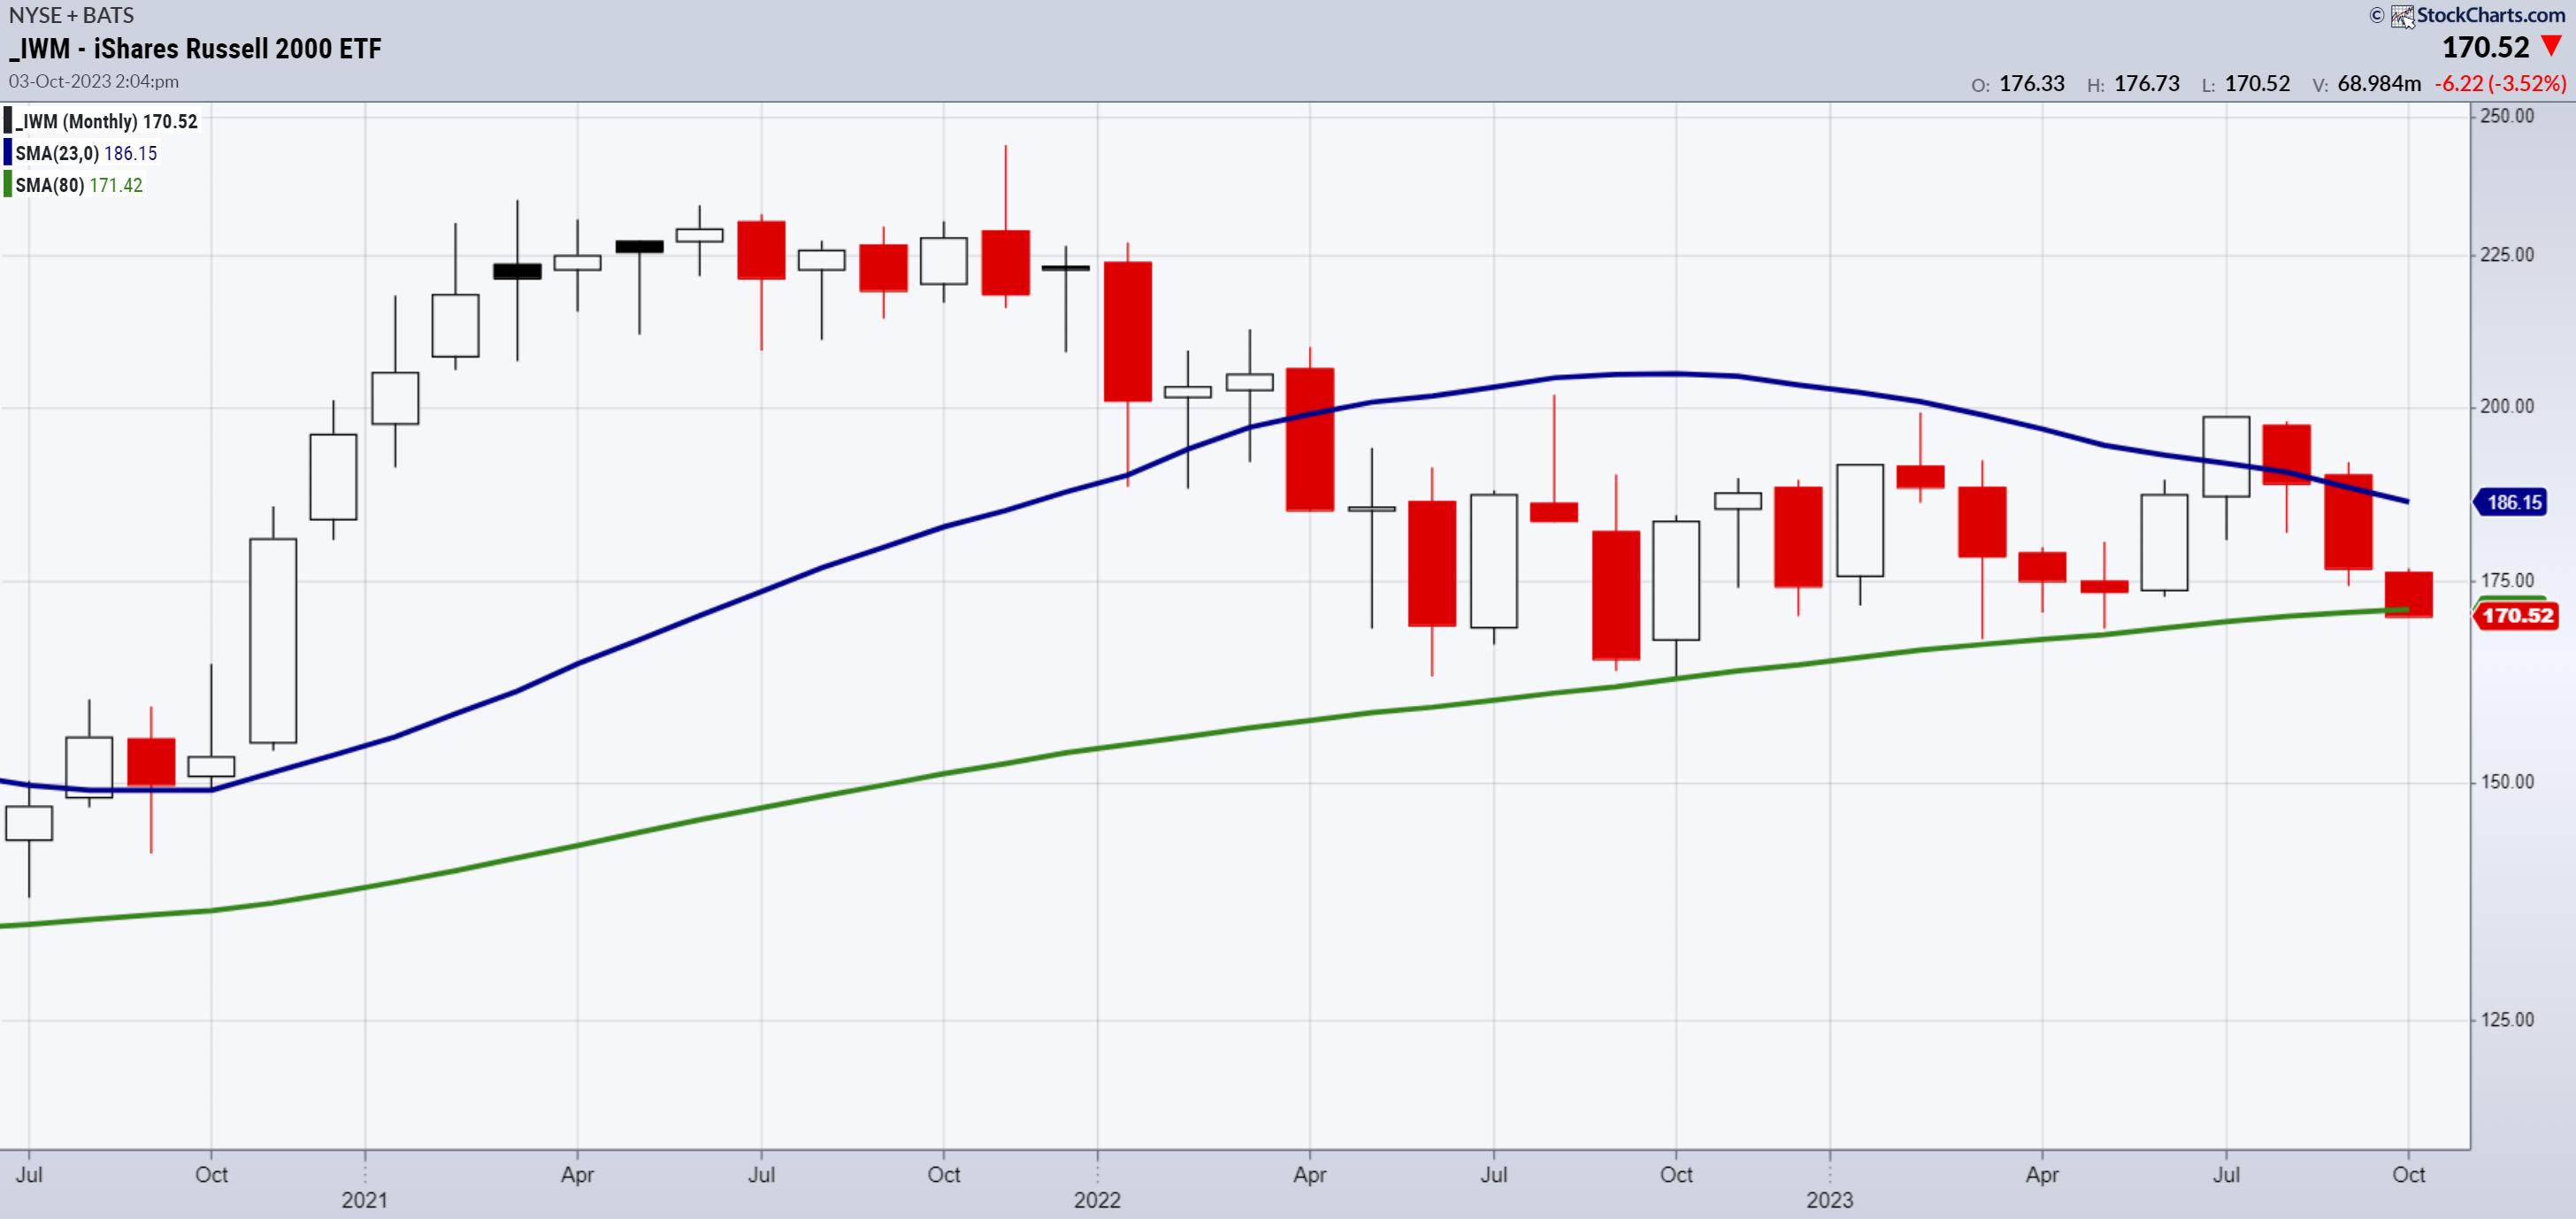
Time to Talk 6-7 Year Market Business Cycles
We began the year examining the 23-month moving averages in all the indices and major market sectors. It was pretty simple, really: buy anything that cleared the blue line (2-year business cycle), which we explained was a good reflection of a cycle within a cycle (6-7 year...
READ MORE
MEMBERS ONLY

Here's a Scary Scenario for You: S&P 500 Downside to 2200?!?
by David Keller,
President and Chief Strategist, Sierra Alpha Research
In this edition of StockCharts TV'sThe Final Bar, guest Jeff Huge, CMT of JWH Investment Partners updates his Elliott Wave count for the S&P 500 and shares what the MOVE index can tell us about further upside potential for interest rates. Dave recaps the continued deterioration...
READ MORE
MEMBERS ONLY
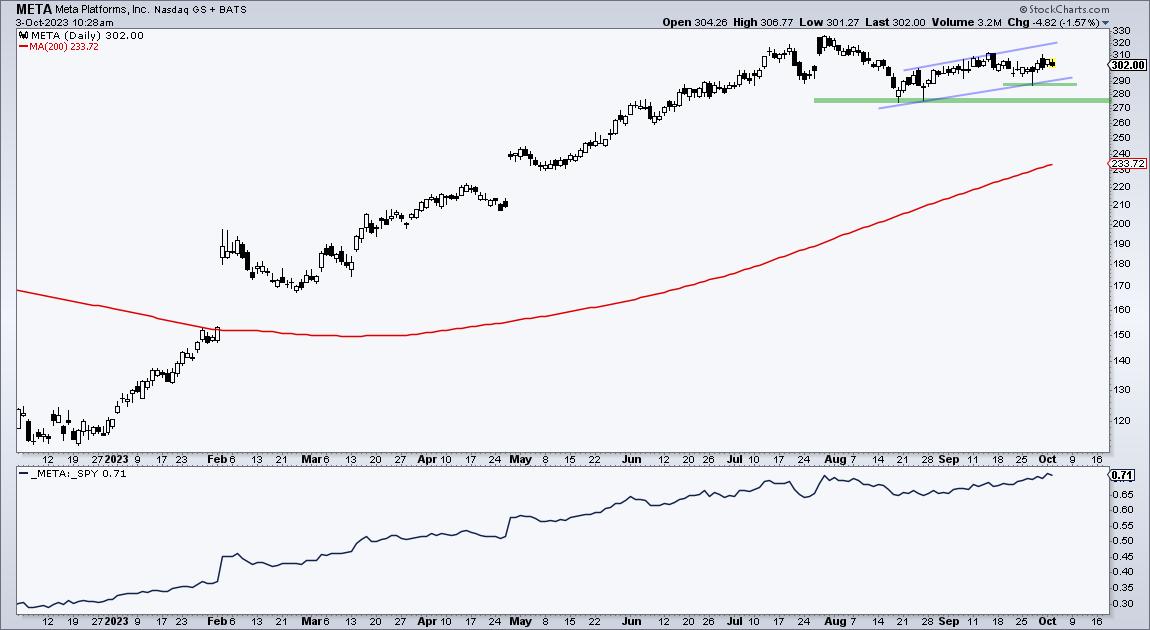
Two Holding Up and Two Breaking Down
by Arthur Hill,
Chief Technical Strategist, TrendInvestorPro.com
The pockets of strength are shrinking as more stocks succumb to selling pressure. The Nasdaq 100 is the strongest of the major indexes, while the Finance sector is one of the weakest sectors. Today's report will highlight two leaders within the Nasdaq 100 and two laggards within the...
READ MORE
MEMBERS ONLY

Sector Rotation Makes Technology Line Up With Strong Seasonality Pattern

by Julius de Kempenaer,
Senior Technical Analyst, StockCharts.com
KEY TAKEAWAYS
* Market is entering strongest period of the year
* Positive seasonal expectations for Technology and Financials
* Weaker outlook for Healthcare and Energy
* Current rotations for Tech and Healthcare are in line with seasonality
We are already in October .... How did that happen?
Also, I am writing this article while...
READ MORE
MEMBERS ONLY
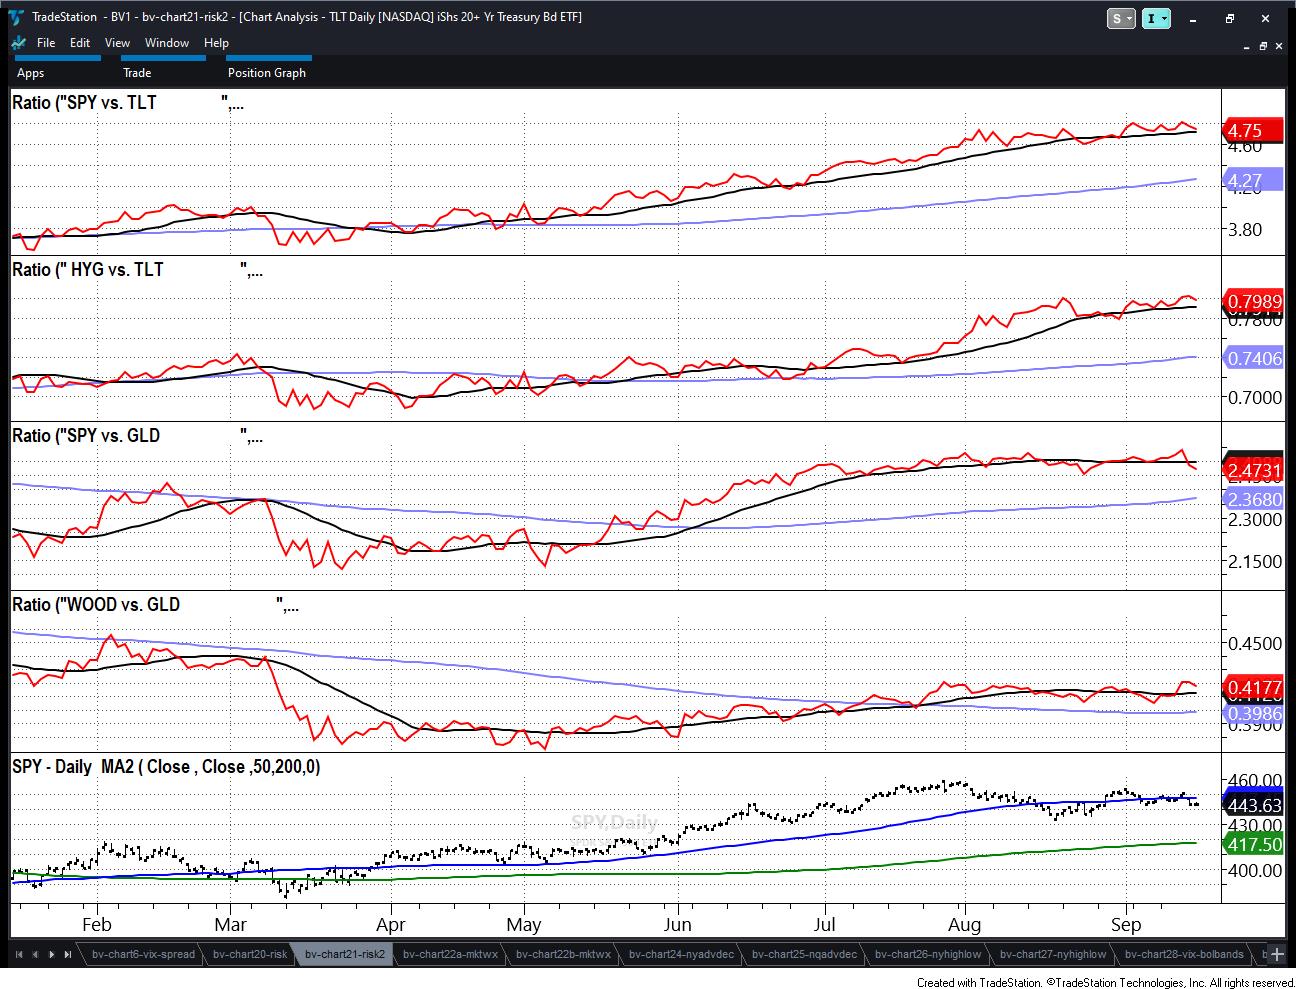
3 Key Relationships to Help Assess Market Direction
If you are finding yourself fluctuating between bullishness and bearishness, then congratulations! Hopefully, that also means you are waiting for certain signals to help you commit to one way or another.
Here are the signals we are waiting for before overly committing to a bias:
1. As we wrote over...
READ MORE
MEMBERS ONLY

Watch for These Signs of a Bottom As Market Breadth Conditions Crumble
by David Keller,
President and Chief Strategist, Sierra Alpha Research
In this edition of StockCharts TV'sThe Final Bar, Dave shows how market breadth conditions have continued to deteriorate to the point where signs of a bottom may emerge. He answers viewer questions on historical Fed cycles, under-performance of defensive sectors like utilities, and how to use technical...
READ MORE
MEMBERS ONLY

DP Trading Room: This is the ONLY Sector Showing STRENGTH Right Now

by Erin Swenlin,
Vice President, DecisionPoint.com
by Carl Swenlin,
President and Founder, DecisionPoint.com
In this week's edition of The DecisionPoint Trading Room, Carl, after a walkthrough of the Magnificent 7+ stocks, examines how, while it was clear that there's some strength to be had in the Nasdaq, one look at the Ultrashort for Dow 30 (SDOW) and an internal...
READ MORE
MEMBERS ONLY

Focus on Stocks: October 2023

by Larry Williams,
Veteran Investor and Author
First & Foremost
I want to personally thank you for subscribing to "Focus on Stocks". I will do all I can to earn the confidence you have placed in me. -- Larry Williams
Is it a Different World?
"I have to pay attention to the implications of the...
READ MORE
MEMBERS ONLY

Week Ahead: NIFTY Violates Important Levels; Stay Cautious and Selective in Approach

by Milan Vaishnav,
Founder and Technical Analyst, EquityResearch.asia and ChartWizard.ae
Although the market stayed flat on a week-to-week basis, the past five trading sessions highlighted the possibility of the market continuing with its corrective retracement. In the previous technical note, it was categorically mentioned that the INDIAVIX had closed at a precariously low level, which had left us...
READ MORE
MEMBERS ONLY
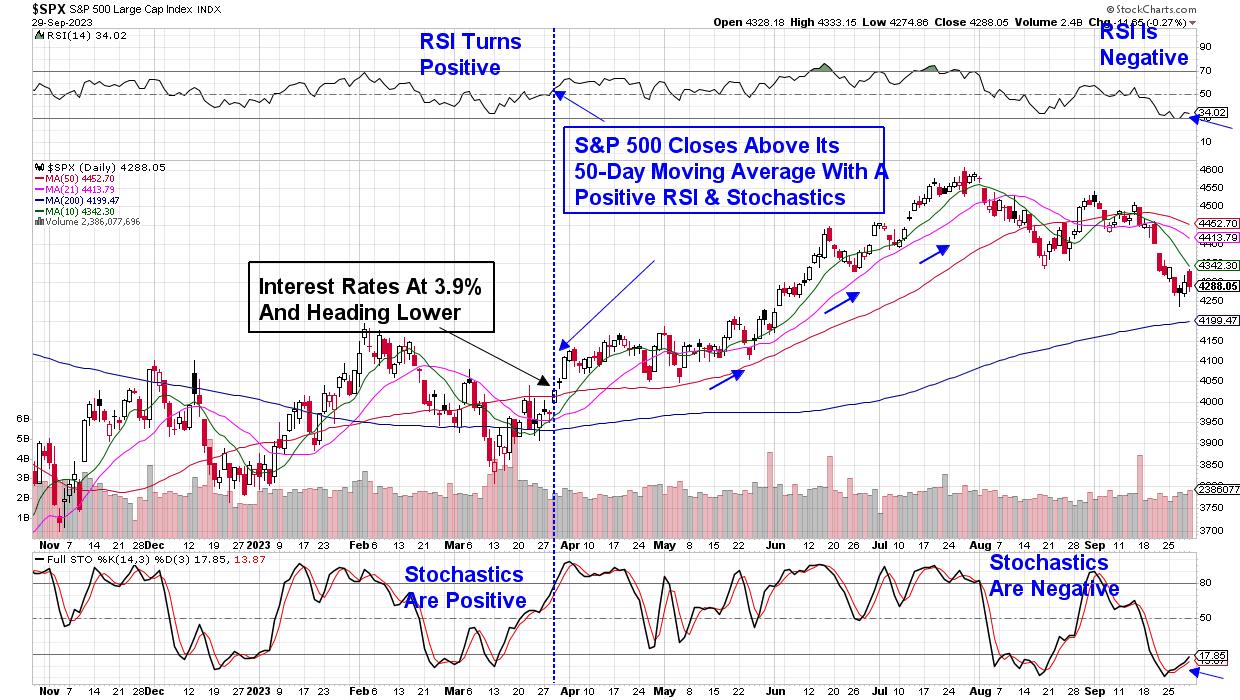
The Worst Month of the Year is Behind Us -- Here's What We Need to See for Better Times Ahead

by Mary Ellen McGonagle,
President, MEM Investment Research
The S&P 500 posted its worst month so far this year, with a 4.9% decline that's pushed the year-to-date returns for this benchmark index almost in half. With elevated interest rates that may be with us for a while, investors have pushed stocks...
READ MORE
MEMBERS ONLY

MEM TV: Here's Why the Nasdaq OUTPERFORMED Last Week
by Mary Ellen McGonagle,
President, MEM Investment Research
In this episode of StockCharts TV'sThe MEM Edge, Mary Ellen reviews areas of the market that are bucking the downtrend pressure elsewhere, as those often go on to provide leadership once the markets turn. She also shares how to use ETFs to uncover rotation taking place beneath the...
READ MORE
MEMBERS ONLY

Your Burning Questions, Answered: FATE of TESLA & Bullish Bias Solutions!
by David Keller,
President and Chief Strategist, Sierra Alpha Research
In this edition of StockCharts TV'sThe Final Bar, Dave answers viewer questions about Tesla's potential trajectory towards the 200-day moving average and ways to normalize relative strength graphs using volatility measures. He also dives into his past trades' technical setup, shares tips for setting...
READ MORE
MEMBERS ONLY

ChartPacks: The Quick and Easy Way to UNLEASH THE POWER of Your StockCharts Account

by Grayson Roze,
Chief Strategist, StockCharts.com
On this week's edition of StockCharts TV'sStockCharts in Focus, Grayson talks all about ChartPacks -- the QUICKEST and EASIEST way to enhance your StockCharts account (old or new) in just one click! ChartPacks are pre-created collections of ChartLists that you can install right into your account;...
READ MORE
MEMBERS ONLY

GNG TV: We're in BIG TROUBLE If Large Tech Stocks Rollover

by Alex Cole,
Co-founder, GoNoGo Charts®

by Tyler Wood,
Co-founder, GoNoGo Charts®
In this edition of the GoNoGo Charts show, Tyler and Alex walk through a top-down approach to the markets and see that there are plenty of reasons why equities are struggling. Treasury rates and the Dollar are in strong "Go" moves and breaking out. The trend was...
READ MORE
MEMBERS ONLY
Beware of Shorts in EXTREME Cycle Lows For The Market

by TG Watkins,
Director of Stocks, Simpler Trading
The internals have all cycled to extreme low areas, which tells TG that being short would be risky -- just like being super long at the end of July was also risky. The pendulum has swung to the lows, and now, in this week's edition of Moxie Indicator Minutes,...
READ MORE
MEMBERS ONLY

Stock Market Weekly Wrap-Up: The Charts You Need to Have on Your Radar Now
by Jayanthi Gopalakrishnan,
Director of Site Content, StockCharts.com
KEY TAKEAWAYS
* Market volatility is low yet few stocks are trading above their 50-, 100-, and 200-day moving averages
* Market indicators are showing lack of momentum in the stock market
* Q4 earnings could be the catalyst that moves the market
As Q3 and a dismal September end, some interesting...
READ MORE
MEMBERS ONLY

Risk-Neutral Market Gauges Ahead of Sunday Deadline
We do not want to walk down the political aisle. Nonetheless, what person can turn their heads away from the Sunday deadline on funding the government?
The aftermath of a shutdown will most likely include a credit downgrade for the US. Do Americans need another reason to distrust the politicos?...
READ MORE
MEMBERS ONLY

FALLING BOND PRICES ARE HURTING BOND PROXIES LIKE UTILITIES, REITS, AND CONSUMER STAPLES

by John Murphy,
Chief Technical Analyst, StockCharts.com
SEPTEMBER SECTOR RANKING... September has lived up to its reputation of being the year's weakest month. All major stock indexes have fallen during the month. And so have most S&P sectors -- except for one. Chart 1 shows energy being the only sector to end the month...
READ MORE
MEMBERS ONLY

Is it Possible for the S&P 500 to Hold the 4300 Level?
by David Keller,
President and Chief Strategist, Sierra Alpha Research
In this edition of StockCharts TV'sThe Final Bar, Samantha LaDuc of LaDuc Capital breaks down the implications of higher interest rates and why semiconductors remain a crucial space to watch. Host David Keller, CMT tracks the recent rally in Bitcoin and identifies two key names testing moving average...
READ MORE
MEMBERS ONLY
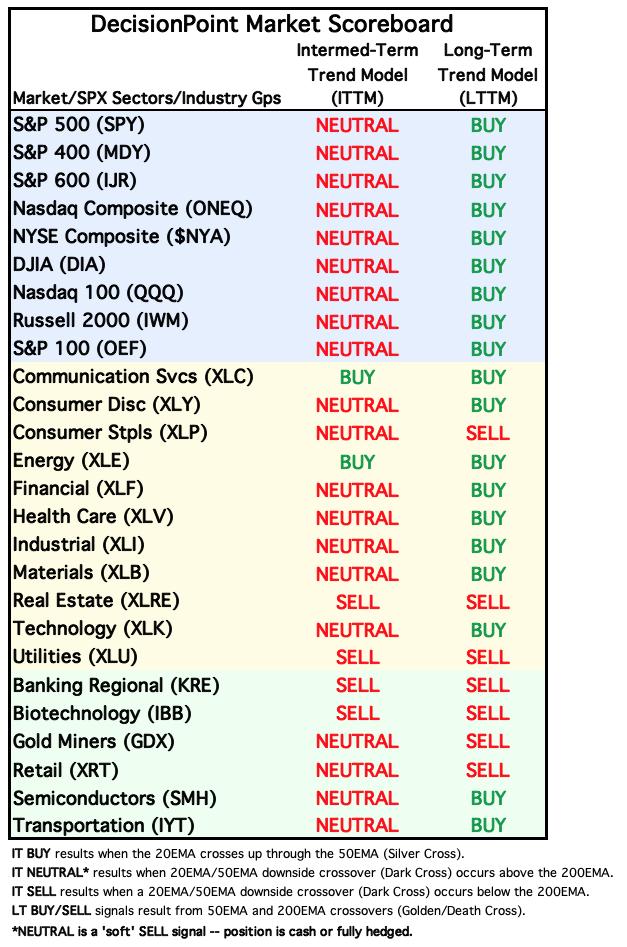
New Tables Show Intermediate-Term Overview is Negative
by Carl Swenlin,
President and Founder, DecisionPoint.com
We have introduced two new tables in the DecisionPoint ALERT to give an overview of trend and BIAS for the major market indexes, sectors, and industry groups that we track. The first is our Market Scoreboard, which shows the current Intermediate-Term and Long-Term Trend Model (ITTM and LTTM)...
READ MORE
MEMBERS ONLY

What to Do When The MACD Is Broken

by Joe Rabil,
President, Rabil Stock Research
On this week's edition of Stock Talk with Joe Rabil, Joe explains how the creator of the MACD, Gerald Appel, used this indicator as an overbought/oversold oscillator. He shows how using the SPY on the daily chart as an example. He then explains what to do when...
READ MORE
MEMBERS ONLY
Which Cyber Security ETF is the Strongest?
by Arthur Hill,
Chief Technical Strategist, TrendInvestorPro.com
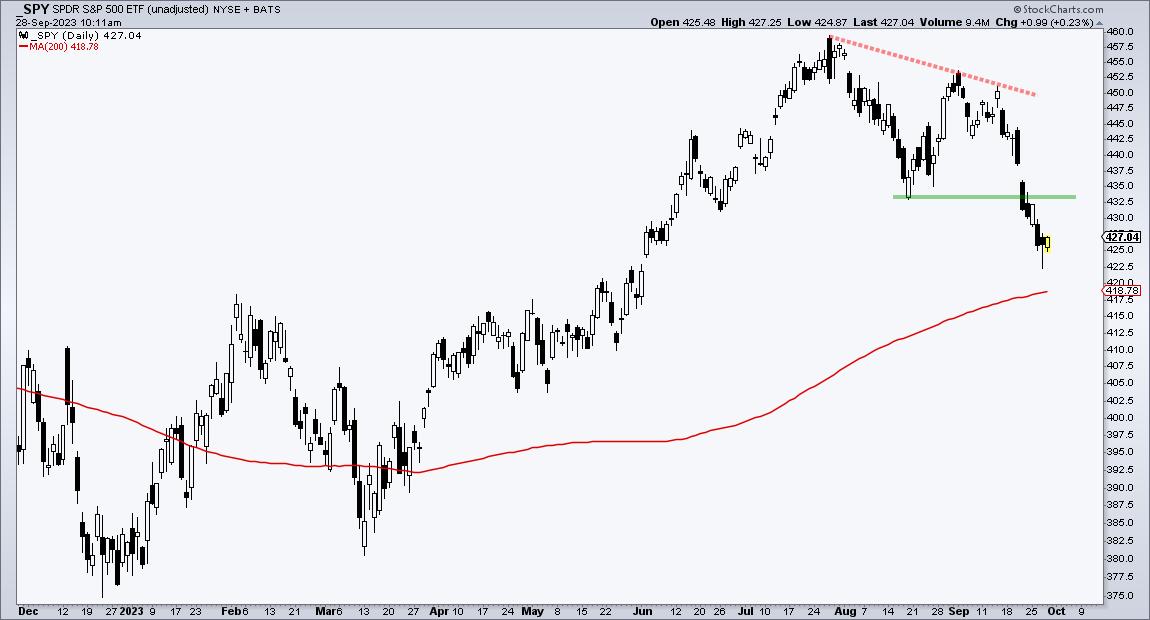
Stocks were hit hard the last two weeks with the S&P 500 SPDR (SPY) breaking below its August low. SPY also forged a lower high from July to August. Stocks and ETFs that held above their August lows are showing relative strength. With that in mind, the three...
READ MORE
MEMBERS ONLY

Looking at Recent Market PULLBACK in a Long-Term Context & More!
by David Keller,
President and Chief Strategist, Sierra Alpha Research
In this edition of StockCharts TV'sThe Final Bar, Joe Rabil of Rabil Stock Research walks through his monthly, weekly, and daily S&P 500 charts to put the recent market pullback into proper long-term context. Host David Keller, CMT digs into breadth indicators that have turned...
READ MORE
MEMBERS ONLY
Riding Out the Storm in Less-Than-Ideal Conditions
by Dave Landry,
Founder, Sentive Trading, LLC
In this week's edition of Trading Simplified, Dave shows his methodology in action by sticking with the original plan with his portfolio vs. giving up due to less-than-ideal conditions. He then resumes his series on the wisdom of Jesse Livermore.
This week, Dave discusses that there...
READ MORE
MEMBERS ONLY

Boyz to Men -- Step Back to Small Caps & Growth Stocks
We started this year looking at the monthly charts and the 2 moving averages that depict business cycles.
Back in February, we wrote:
All in all, the key sectors (retail, transportation) have more to prove, especially by clearing the 23-month moving average or 2-year business cycle. This is...
READ MORE
MEMBERS ONLY

Sector Spotlight: Sector Rotation Sends Mixed Signals
by Julius de Kempenaer,
Senior Technical Analyst, StockCharts.com
On this episode of StockCharts TV's Sector Spotlight, after two weeks of non-regular market updates, I'm back with a regular episode. Here, I dive deep into the current state of rotation in asset classes, highlighting the strength of commodities and the opposing rotations for stocks...
READ MORE
MEMBERS ONLY
DP Trading Room: Don't Forget The MONTHLY CHARTS! Earnings Spotlight
by Erin Swenlin,
Vice President, DecisionPoint.com
by Carl Swenlin,
President and Founder, DecisionPoint.com
In this week's edition of The DecisionPoint Trading Room, Carl opens with a discussion on why you should use monthly charts even if you are investing in the shorter term. He gives us insight into the market as a whole and reviews the Magnificent 7 stocks and Tesla...
READ MORE
MEMBERS ONLY

The Halftime Show: Fixed Income Continues To Fall, Can't Say I Didn't WARN You!

by Pete Carmasino,
Chief Market Strategist, Chaikin Analytics
Pete has been monitoring and calling out the downfall of TLT for nearly 20 months. In this week's edition of StockCharts TV'sHalftime, Pete explains why the ETF broke below $90 and how the US 10-year is over 4.5% on the same day. He dives...
READ MORE
MEMBERS ONLY
MEM TV: How to Tell When It's Safe to Get Back Into the Markets
by Mary Ellen McGonagle,
President, MEM Investment Research
In this episode of StockCharts TV'sThe MEM Edge, Mary Ellen reviews what drove the previous week's sharp pullback and what we'll need to see before the markets can turn positive again. She also highlights recession-proof stocks that are currently attractive as well as...
READ MORE
MEMBERS ONLY
SharpCharts vs. ACP - Comparing & Contrasting Your Charting Platform Choices
by Grayson Roze,
Chief Strategist, StockCharts.com
On this week's edition of StockCharts TV'sStockCharts in Focus, Grayson explores the two primary charting platforms on StockCharts - SharpCharts and ACP - to highlight the strengths of each, compare and contrast the two and share his thoughts on when and why you may want to use one...
READ MORE
MEMBERS ONLY

Nvidia Stock: Why It's Screaming a Spectacular Buy Signal
by Jayanthi Gopalakrishnan,
Director of Site Content, StockCharts.com
KEY TAKEAWAYS
* NVDA stock is holding on to the support of its 100-day moving average
* NVDA has maintained a high StockCharts Technical Rank (SCTR) since early 2023
* NVDA's relative strength with respect to the S&P 500 is approaching 200%
Nvidia's stock has maintained...
READ MORE
MEMBERS ONLY
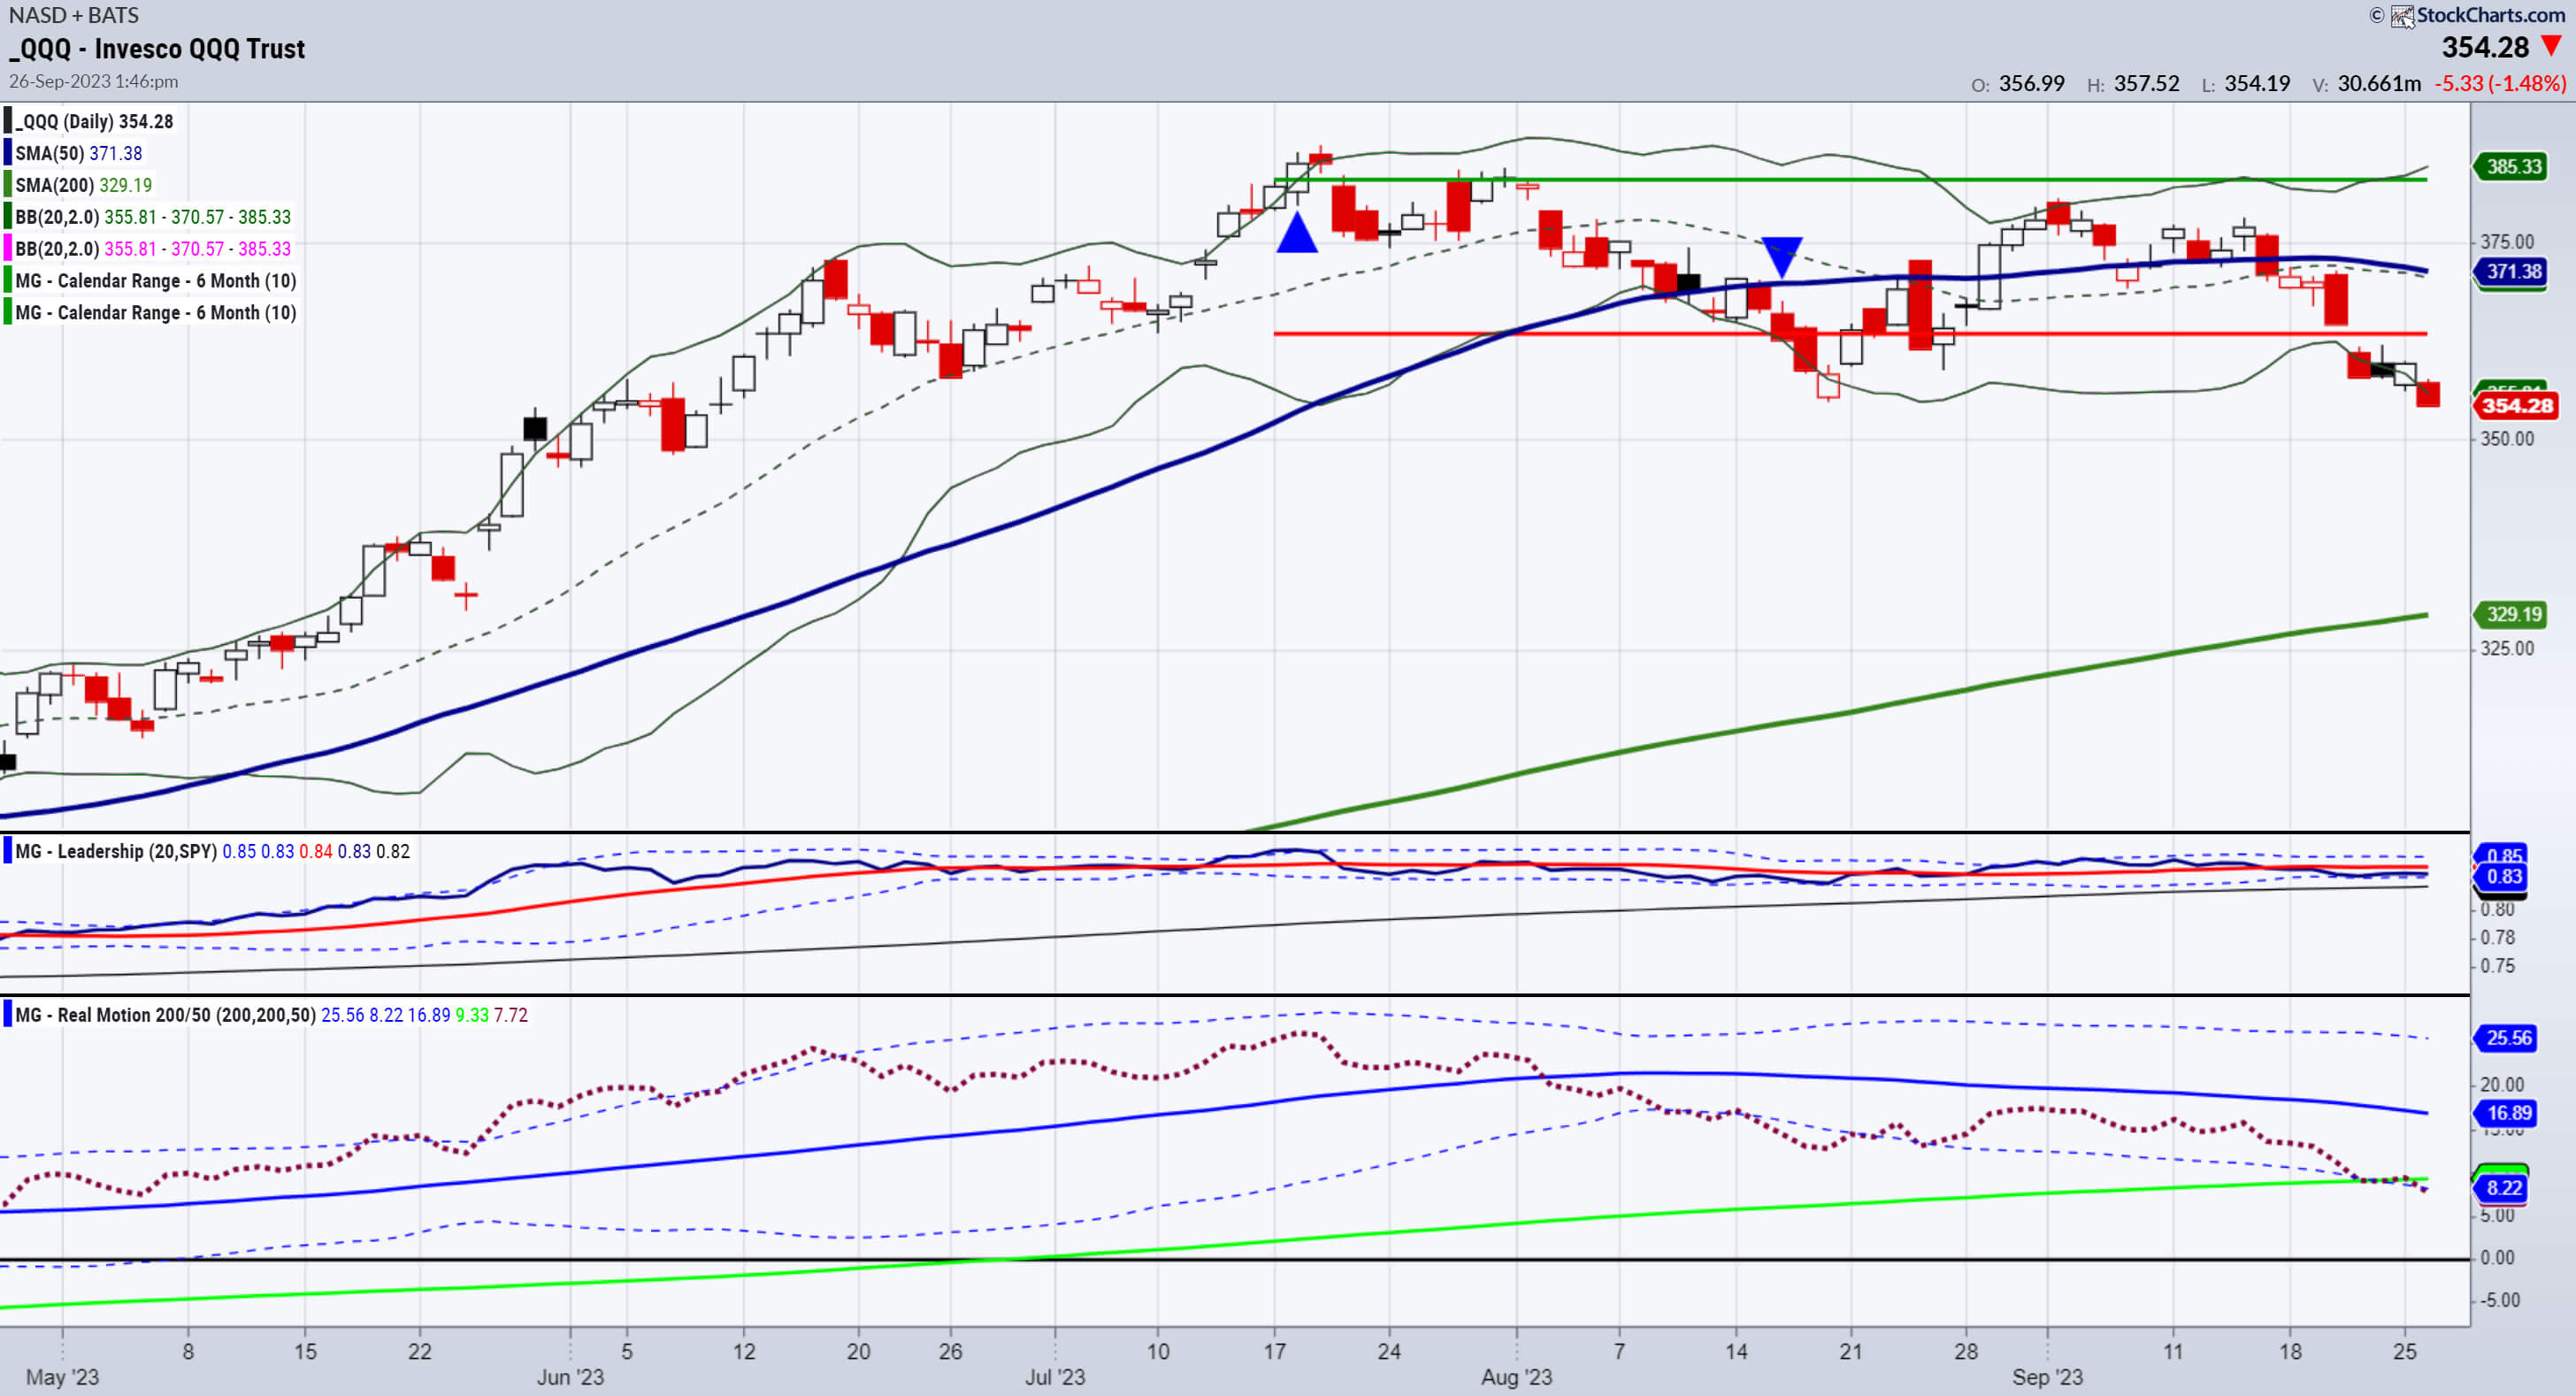
Market Begs: Tell Us Something Good!
We compiled a list of the 10 biggest uncertainties in the stock market right now.
In no particular order:
1. China-trade wars and chip wars
2. Oil and food inflation
3. Strikes
4. Government shutdown
5. Corporate and individual bankruptcies on the rise
6. Commercial real estate and banking...
READ MORE
MEMBERS ONLY
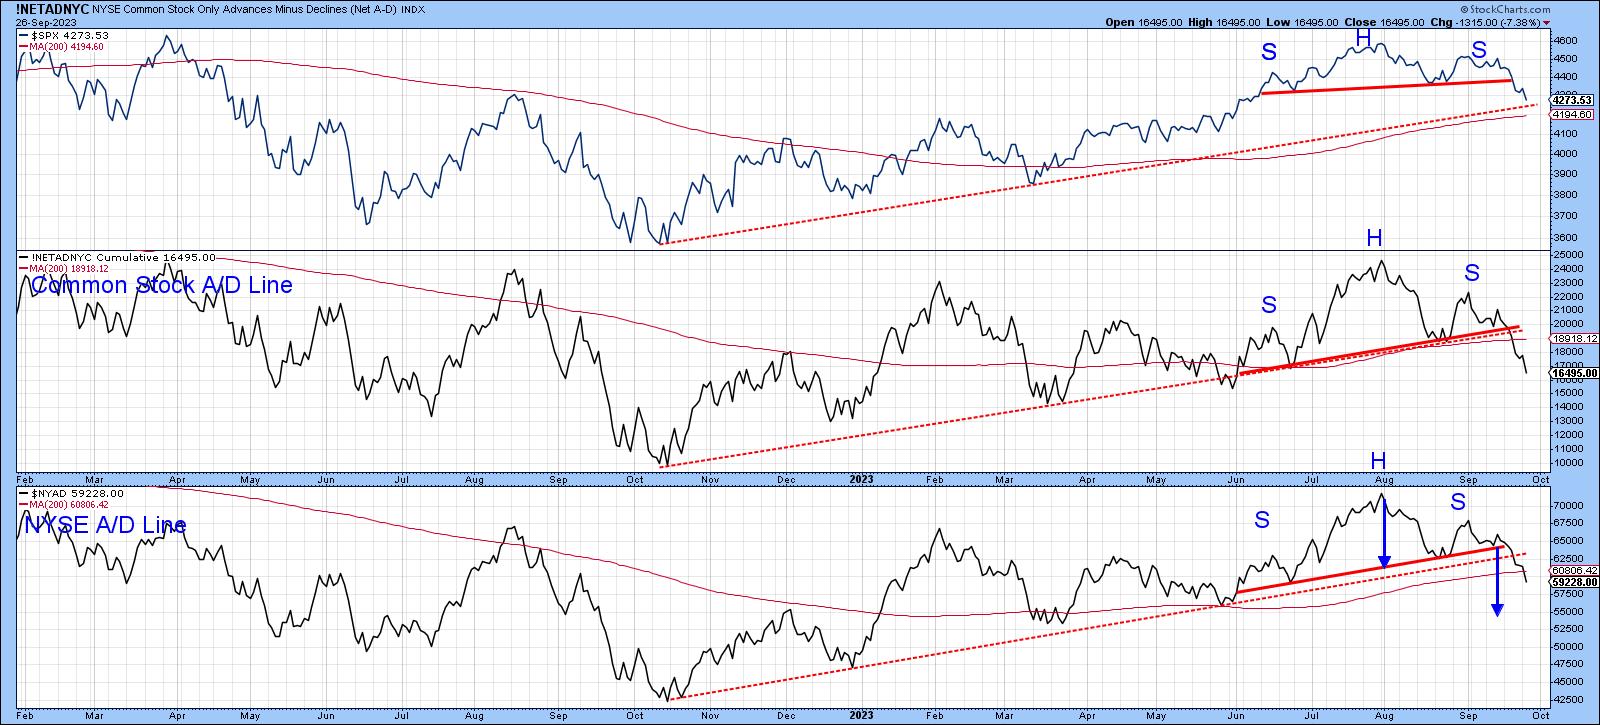
This Stock Market Looks Horrible... But...
by Martin Pring,
President, Pring Research
Chart 1 shows that the S&P Composite, like both A/D Lines, has completed and decisively broken down from a head-and-shoulders top. The two breadth indicators have also violated their bull market up trendlines. On the surface, things look pretty grim, with three seasonally weak September...
READ MORE