MEMBERS ONLY

Compression-Based Swing Trading

by Joe Rabil,
President, Rabil Stock Research
On this week's edition of Stock Talk with Joe Rabil, Joe shows an approach to swing trading that allows a trader to take smaller risks and, as a result, enter and exit more quickly. The goal is to identify compression developing in a pattern that can offer high...
READ MORE
MEMBERS ONLY

The Birth of Ralph Acampora's Brainchild; ARGoN

by Julius de Kempenaer,
Senior Technical Analyst, StockCharts.com
This journey started back in October 2022. After three years of no traveling and four years not having been to the US, it was finally possible to have an in-person event again, or at least partially.
StockCharts.com has been hosting its bi-annual conference, "ChartCon," since 2011. My...
READ MORE
MEMBERS ONLY

How to Trade Big Earnings Gaps

by Geoff Bysshe,
Co-founder and President, MarketGuage.com
Earnings season is often filled with big gaps, and it's easy to look at them as big opportunities to catch a big move quickly. However, it's also easy to get burned by entering trades right before the earnings announcement.
We have a different way to use...
READ MORE
MEMBERS ONLY
"Bear Shift" Changes Character of the Market

by Erin Swenlin,
Vice President, DecisionPoint.com
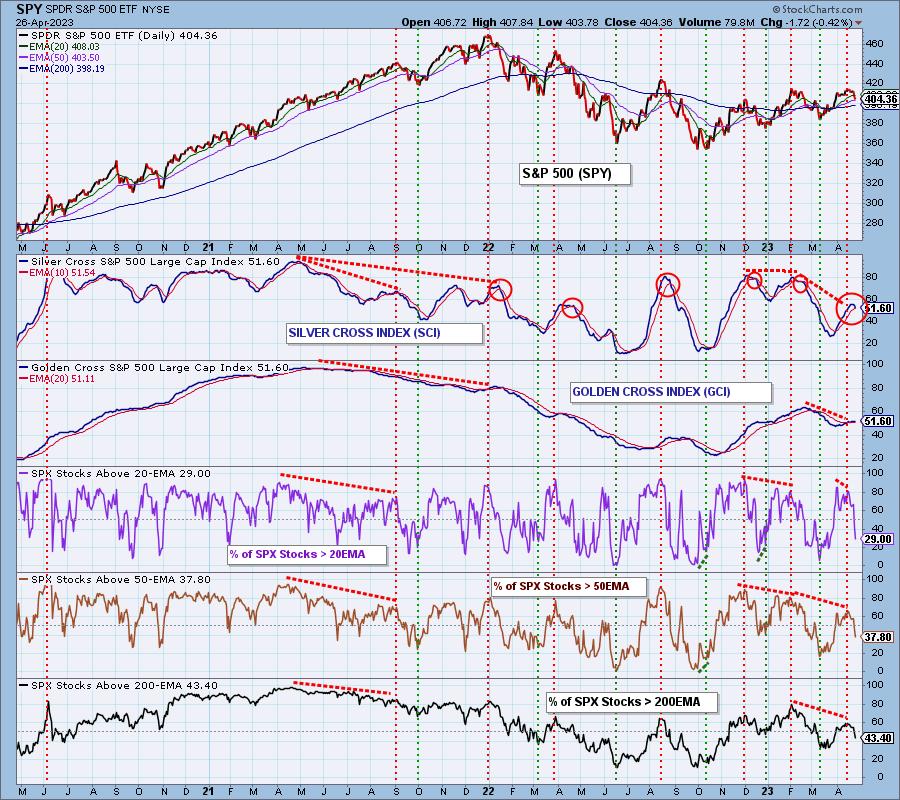
We decided that it was time to come up with a name for Silver Cross Index and Golden Cross Index crossovers their signal lines. We've noticed that Silver Cross Index crossovers are excellent flags to intermediate-term changes in direction.
We've decided to name these crossovers "...
READ MORE
MEMBERS ONLY

The Wisdom of Jesse Livermore, Part 2

by Dave Landry,
Founder, Sentive Trading, LLC
In this week's edition of Trading Simplified, Dave shows his methodology in action by walking through the ups and downs of a recent trade and why you must follow your trading plan through thick and thin. He also introduced a new mystery chart that shows promise. He then...
READ MORE
MEMBERS ONLY

Schwab: Surviving a Banking Bloodbath With a Smile and Swagger

by Karl Montevirgen,
The StockCharts Insider
Charles Schwab (SCHW)'s month-long freefall that started on March 9 was quite a spectacle. It took place amid the Silicon Valley Bank collapse, which triggered a shockwave that impacted the regional banking industry all the way to Wall Street and Main Street.
After the initial hit, SCHW got...
READ MORE
MEMBERS ONLY

UPSidedown Earnings Sink Stocks
by Geoff Bysshe,
Co-founder and President, MarketGuage.com
Weak earnings and even worse conference calls drove United Parcel Service, Inc. (UPS) and First Republic Bank (FRC) down right from the open, then even lower as the day unfolded. Between these stocks, two of the market's primary fears came to the forefront—a weakening consumer and problems...
READ MORE
MEMBERS ONLY

Let Your Scans Do the Legwork: Finding Great Stocks to Trade

by Jayanthi Gopalakrishnan,
Director of Site Content, StockCharts.com
April is Financial Literacy Month. As a retail trader or investor, you know the value of education. There's always a new technique, tool, or strategy to learn. Sophisticated scanning tools can help identify stocks that could improve your trading process. Here's an example of using scan...
READ MORE
MEMBERS ONLY
Leaders Lost & Laggards Won
by Geoff Bysshe,
Co-founder and President, MarketGuage.com
There's a simple professional trader's tactic for anticipating intraday market reversals near the levels that later become the high or the low of the day. This tactic worked perfectly at calling today's high of the day in SPY (and the QQQ, IWM, and DIA)...
READ MORE
MEMBERS ONLY
Three Charts I Am Watching Closely for a Verdict

by Martin Pring,
President, Pring Research
Charts have always fascinated me, so I plow through a lot of them in the course of a typical week. To me, breakouts hold a similar buzz as a striker scoring a great goal from the edge of the penalty box in soccer. To boot, I do not see any...
READ MORE
MEMBERS ONLY

DP Trading Room: Long-Term View of the Dollar
by Erin Swenlin,
Vice President, DecisionPoint.com

by Carl Swenlin,
President and Founder, DecisionPoint.com
On this week's edition of The DecisionPoint Trading Room, Carl, as always, opens the show with a market overview, but, in this episode, spends extra time looking at the Dollar in all three timeframes. He also reviews key indicator charts which favor a intermediate-term market top on the...
READ MORE
MEMBERS ONLY

The Halftime Show: Under the Hood -- Short Interest Gainers and Losers

by Pete Carmasino,
Chief Market Strategist, Chaikin Analytics
In this week's edition of StockCharts TV'sHalftime, Pete takes a look under the hood at some "factor" movers, based on the Chaikin Analytics rating system. He highlights some short interest movers, including gainers and losers. He also takes a look at some hot lists,...
READ MORE
MEMBERS ONLY
SMH Bulls are Skating on Thin Ice
by Geoff Bysshe,
Co-founder and President, MarketGuage.com
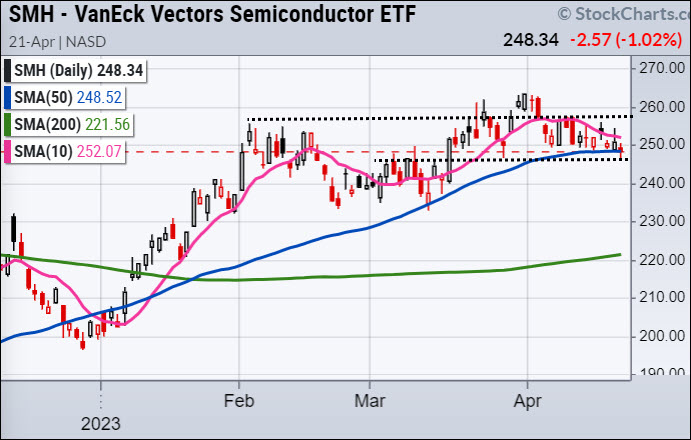
Heads up, you wouldn't know it by looking at its daily chart, but the SMH is skating on some very thin ice.
Since the market's lows in October 2022, the SMH has been one of the recent bull rally's earliest and most influential supporters,...
READ MORE
MEMBERS ONLY

Is The Bear Market Over? Watch The VIX

by Tom Bowley,
Chief Market Strategist, EarningsBeats.com
The normal relationship between the Volatility Index ($VIX) and the S&P 500 is an inverse one. The easiest way to illustrate this is to pull up a chart showing both and their correlation coefficient:
The red arrows mark bottoms in the S&P 500 and they generally...
READ MORE
MEMBERS ONLY

Week Ahead: Approach Markets on a Highly Cautious and Selective Note; VIX Breaches 2021 Low

by Milan Vaishnav,
Founder and Technical Analyst, EquityResearch.asia and ChartWizard.ae
After ending with gains for three weeks in a row, the markets took a breather this time by ending modestly in the red. In the previous technical note, it was mentioned that the NIFTY is not only over-extended on the shorter timeframe charts, but the VIX is also hovering around...
READ MORE
MEMBERS ONLY

Three Charts Suggest Pullback Imminent

by David Keller,
President and Chief Strategist, Sierra Alpha Research
The major equity averages have stalled out in recent weeks, trading up to their February highs but unable to muster enough positive momentum to push to new swing highs.
The key question as we continue through earnings season is whether there will arise a catalyst to propel the S&...
READ MORE
MEMBERS ONLY

MEM TV: Leadership Emerges in a Flat Market

by Mary Ellen McGonagle,
President, MEM Investment Research
In this episode of StockCharts TV'sThe MEM Edge, Mary Ellen highlights what areas are outperforming the markets and why. She also reviews top gaining stocks for the week and the best way to capitalize on further upside potential.
This video was originally broadcast on April 21, 2023. Click...
READ MORE
MEMBERS ONLY

3 Signs Tesla Stock Was Breaking Down: Did You See Them?
by Jayanthi Gopalakrishnan,
Director of Site Content, StockCharts.com
When a stock you don't own keeps going higher and higher, you probably feel regret for not buying it when it was still affordable. It's not unusual for traders to feel that way. But the reality is that no stock keeps moving up forever. Looking back...
READ MORE
MEMBERS ONLY

The Easy Way to Review Different Charts for the Same Symbols

by Grayson Roze,
Chief Strategist, StockCharts.com
On this week's edition of StockCharts TV'sStockCharts in Focus, Grayson explores two crucial features on the site – ChartLists and ChartStyles – and shows you how to quickly apply different sets of indicators and chart settings to the same list of symbols without typing them one at a...
READ MORE
MEMBERS ONLY

We Called the Pullback

by TG Watkins,
Director of Stocks, Simpler Trading
On this week's edition of Moxie Indicator Minutes, TG explains how the Moxie trading room was well positioned for the drop of the market today. Having notified subscribers that there was likely to be a bounce and exactly where it would go, TG saw it work out perfectly,...
READ MORE
MEMBERS ONLY

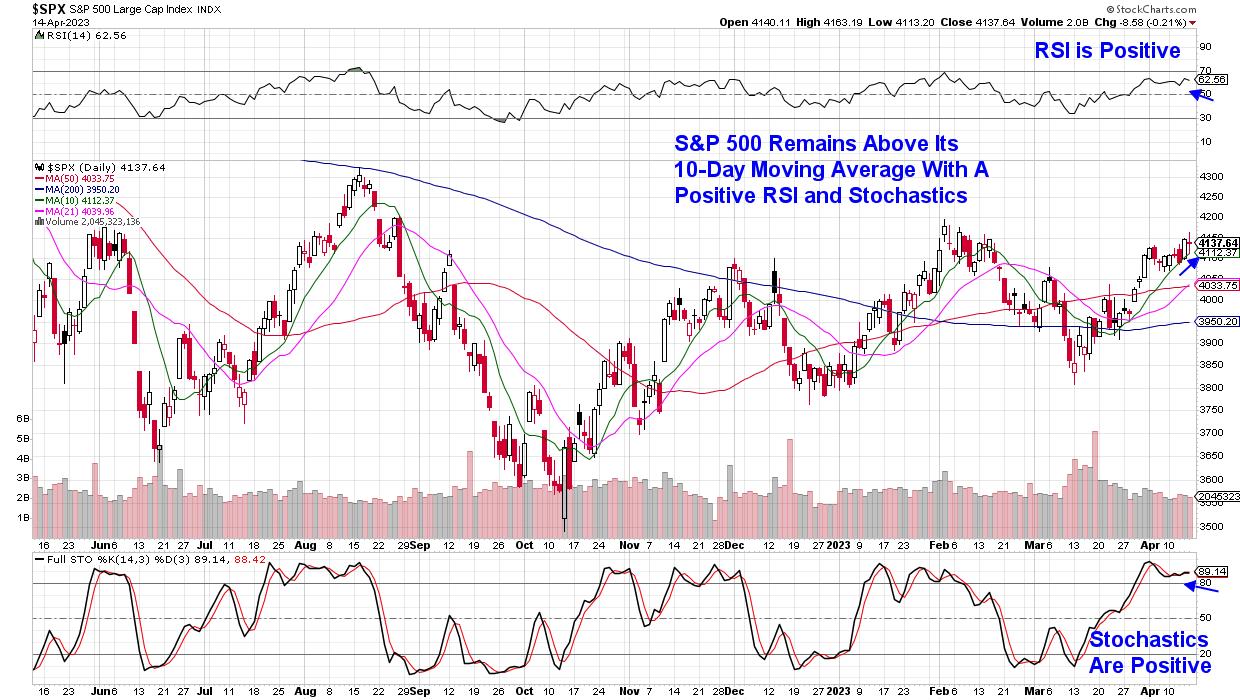
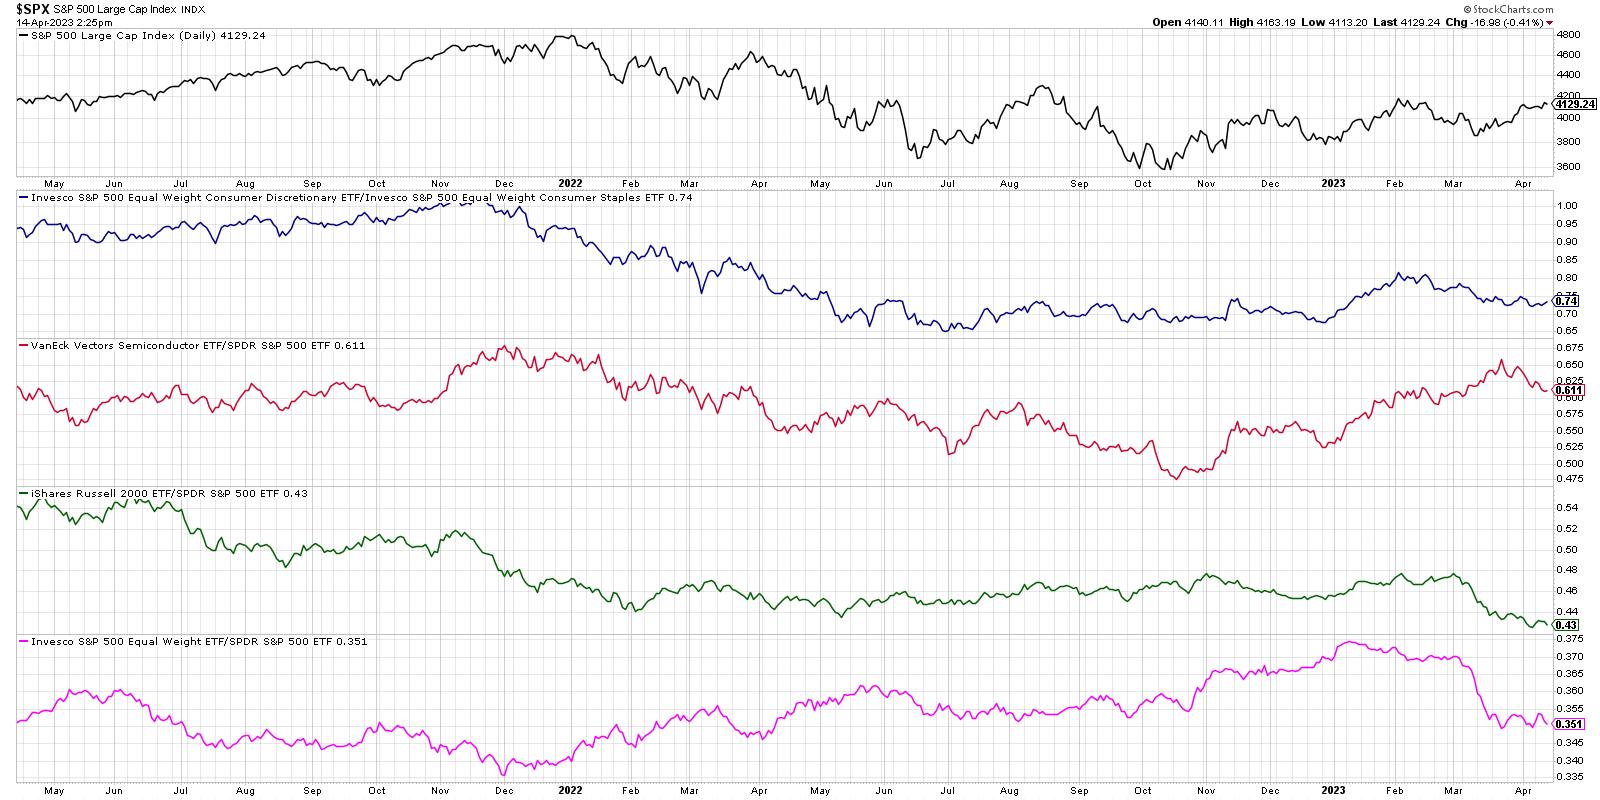
BREADTH FIGURES CONTINUE TO SHOW NEGATIVE DIVERGENCES

by John Murphy,
Chief Technical Analyst, StockCharts.com
MORE NEGATIVE DIVERGENCES... My message from a couple of weeks ago showed various measures of market breadth failing to keep up with the S&P 500 which suggested that the current stock rally was on weak technical footing. Unfortunately, that situation hasn't improved. A number of breath...
READ MORE
MEMBERS ONLY

GNG TV: All Quiet on the Wall St. Front

by Alex Cole,
Co-founder, GoNoGo Charts®

by Tyler Wood,
Co-founder, GoNoGo Charts®
In this edition of the GoNoGo Charts show, even with earnings kicking off, trading activity this week has been remarkably quiet. Alex and Tyler review some of the key lessons shared in their StockCharts TV special "Embracing Volatility" and how we as investors can profit from volatility compression...
READ MORE
MEMBERS ONLY

The Achilles Heel of ETFs

by Arthur Hill,
Chief Technical Strategist, TrendInvestorPro.com
Trend-momentum strategies trading ETFs were appealing because they generated lower drawdowns and decent returns. Trend-momentum strategies trading stocks, in contrast, were often subject to higher drawdowns, though returns were higher. While I cannot speak for all ETF strategies, my experience shows that ETF strategies have lost their low-drawdown edge. This...
READ MORE
MEMBERS ONLY

Heed This Warning!
by Erin Swenlin,
Vice President, DecisionPoint.com
We've been watching and waiting for our IT indicators to turn down in overbought territory, and today they did. Add to this a topping Price Momentum Oscillator (PMO), a downside initiation climax, topping Swenlin Trading Oscillators (STOs), and numerous negative divergences, and you have a recipe for a...
READ MORE
MEMBERS ONLY

Gaining an Edge in a Tough Trading Year
On Thursday morning, April 20th, I began the day with the crew at the Benzinga PreMarket Prep show. We (Joel and Mitch) covered a lot, but the focus remains this persistent, rangebound market.
I've used many different moving averages consistently through the years. This year, the monthly moving...
READ MORE
MEMBERS ONLY
MACD Reverse Divergence
by Joe Rabil,
President, Rabil Stock Research
On this week's edition of Stock Talk with Joe Rabil, Joe shows a MACD divergence signal that takes place in the direction of the trend. He explains how there are other hints to know when this pattern is getting ready to trigger using MACD zero line and ADX....
READ MORE
MEMBERS ONLY

The Battle for Burgerdom: McDonald's, Jack in the Box, and Burger King
by Karl Montevirgen,
The StockCharts Insider
Three beef-slinging behemoths are about to go toe-to-toe in an all-out brawl for supremacy over the grease-stained domains of Burgerdom.
Opening Moves
McDonald's (MCD) has deployed its long-slumbering anti-hero, the Hamburglar, to introduce its new menu lineup.
Jack in the Box Inc (JACK) aims to flank its fast-food...
READ MORE
MEMBERS ONLY

Banks, Well, Are They in the Bank??
Regional Banks (KRE) made a comeback during the session. The price pierced the 44 resistance level and closed above the last 18 trading day's range.
On March 6th, over a month ago, I wrote a Daily called "Retail and Regional Banks Will Call the Shots". At...
READ MORE
MEMBERS ONLY

Defense Stocks To Buy: A Strategy You Need to Know and Use
by Jayanthi Gopalakrishnan,
Director of Site Content, StockCharts.com
Aerospace and defense stocks seem to be busting through turbulence. Lockheed Martin (LMT)'s better-than-expected earnings helped push its stock price higher, and the positive news added upside momentum to the aerospace and defense industry. So it shouldn't be surprising that the Industrial sector, using the Industrial...
READ MORE
MEMBERS ONLY
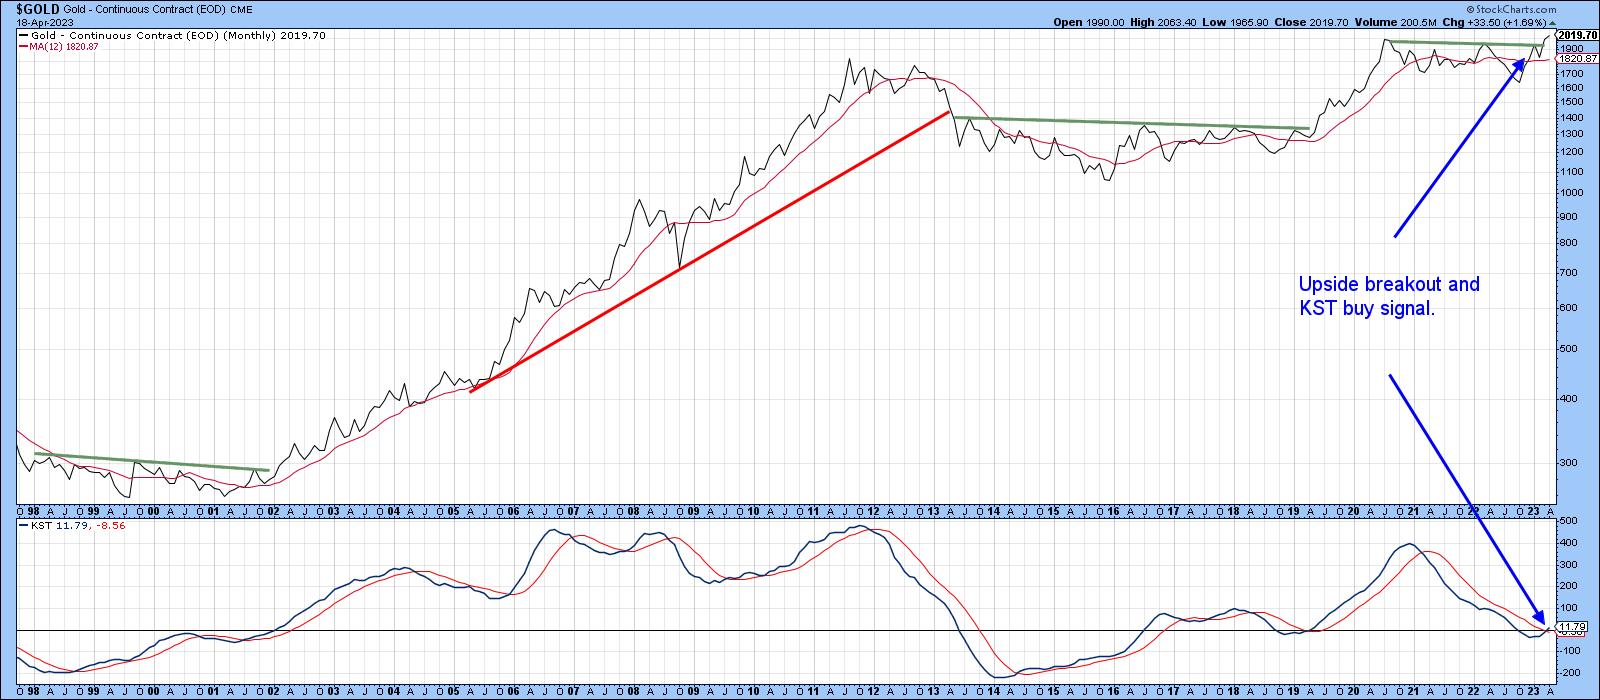
What Are the Implications of Last Month's Gold Breakout for Commodities?
by Martin Pring,
President, Pring Research
Chart 1 below shows that, on a monthly close basis, gold broke out from a large consolidation formation in March. It has built on that move in the first part of April by moving slightly higher. The implication is obviously for higher gold prices, once the overbought condition laid out...
READ MORE
MEMBERS ONLY
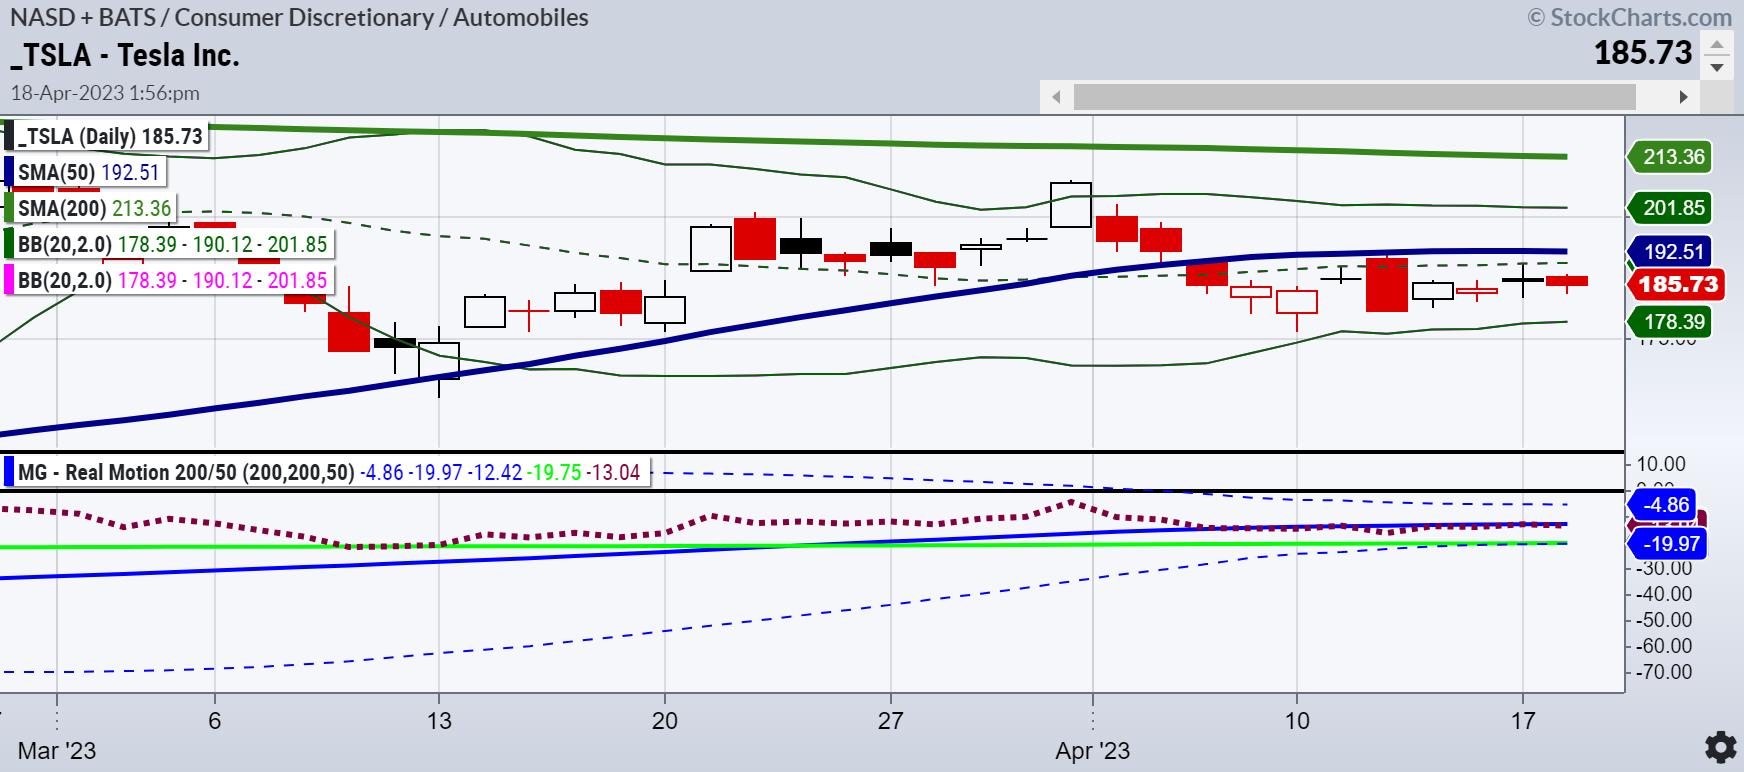
Tesla Reports April 19: What To Look For
After recent price cuts and low expectations of only $0.85 per share or a 20% drop since a year ago, many eyes will watch Tesla (TSLA) after the close.
Tesla, always controversial, can either beat those low expectations and provide a low-risk buy opportunity against major moving averages,
Or...
READ MORE
MEMBERS ONLY

Sector Spotlight: Sector Rotation Suggests Market Ready to Move
by Julius de Kempenaer,
Senior Technical Analyst, StockCharts.com
On this episode of StockCharts TV's Sector Spotlight, I evaluate the current state of the Sector Rotation Model. Each quarter, I take the elements of the Model, as described by Sam Stovall, and use the charts of four macroeconomic indicators and the monthly RRG to determine where the...
READ MORE
MEMBERS ONLY
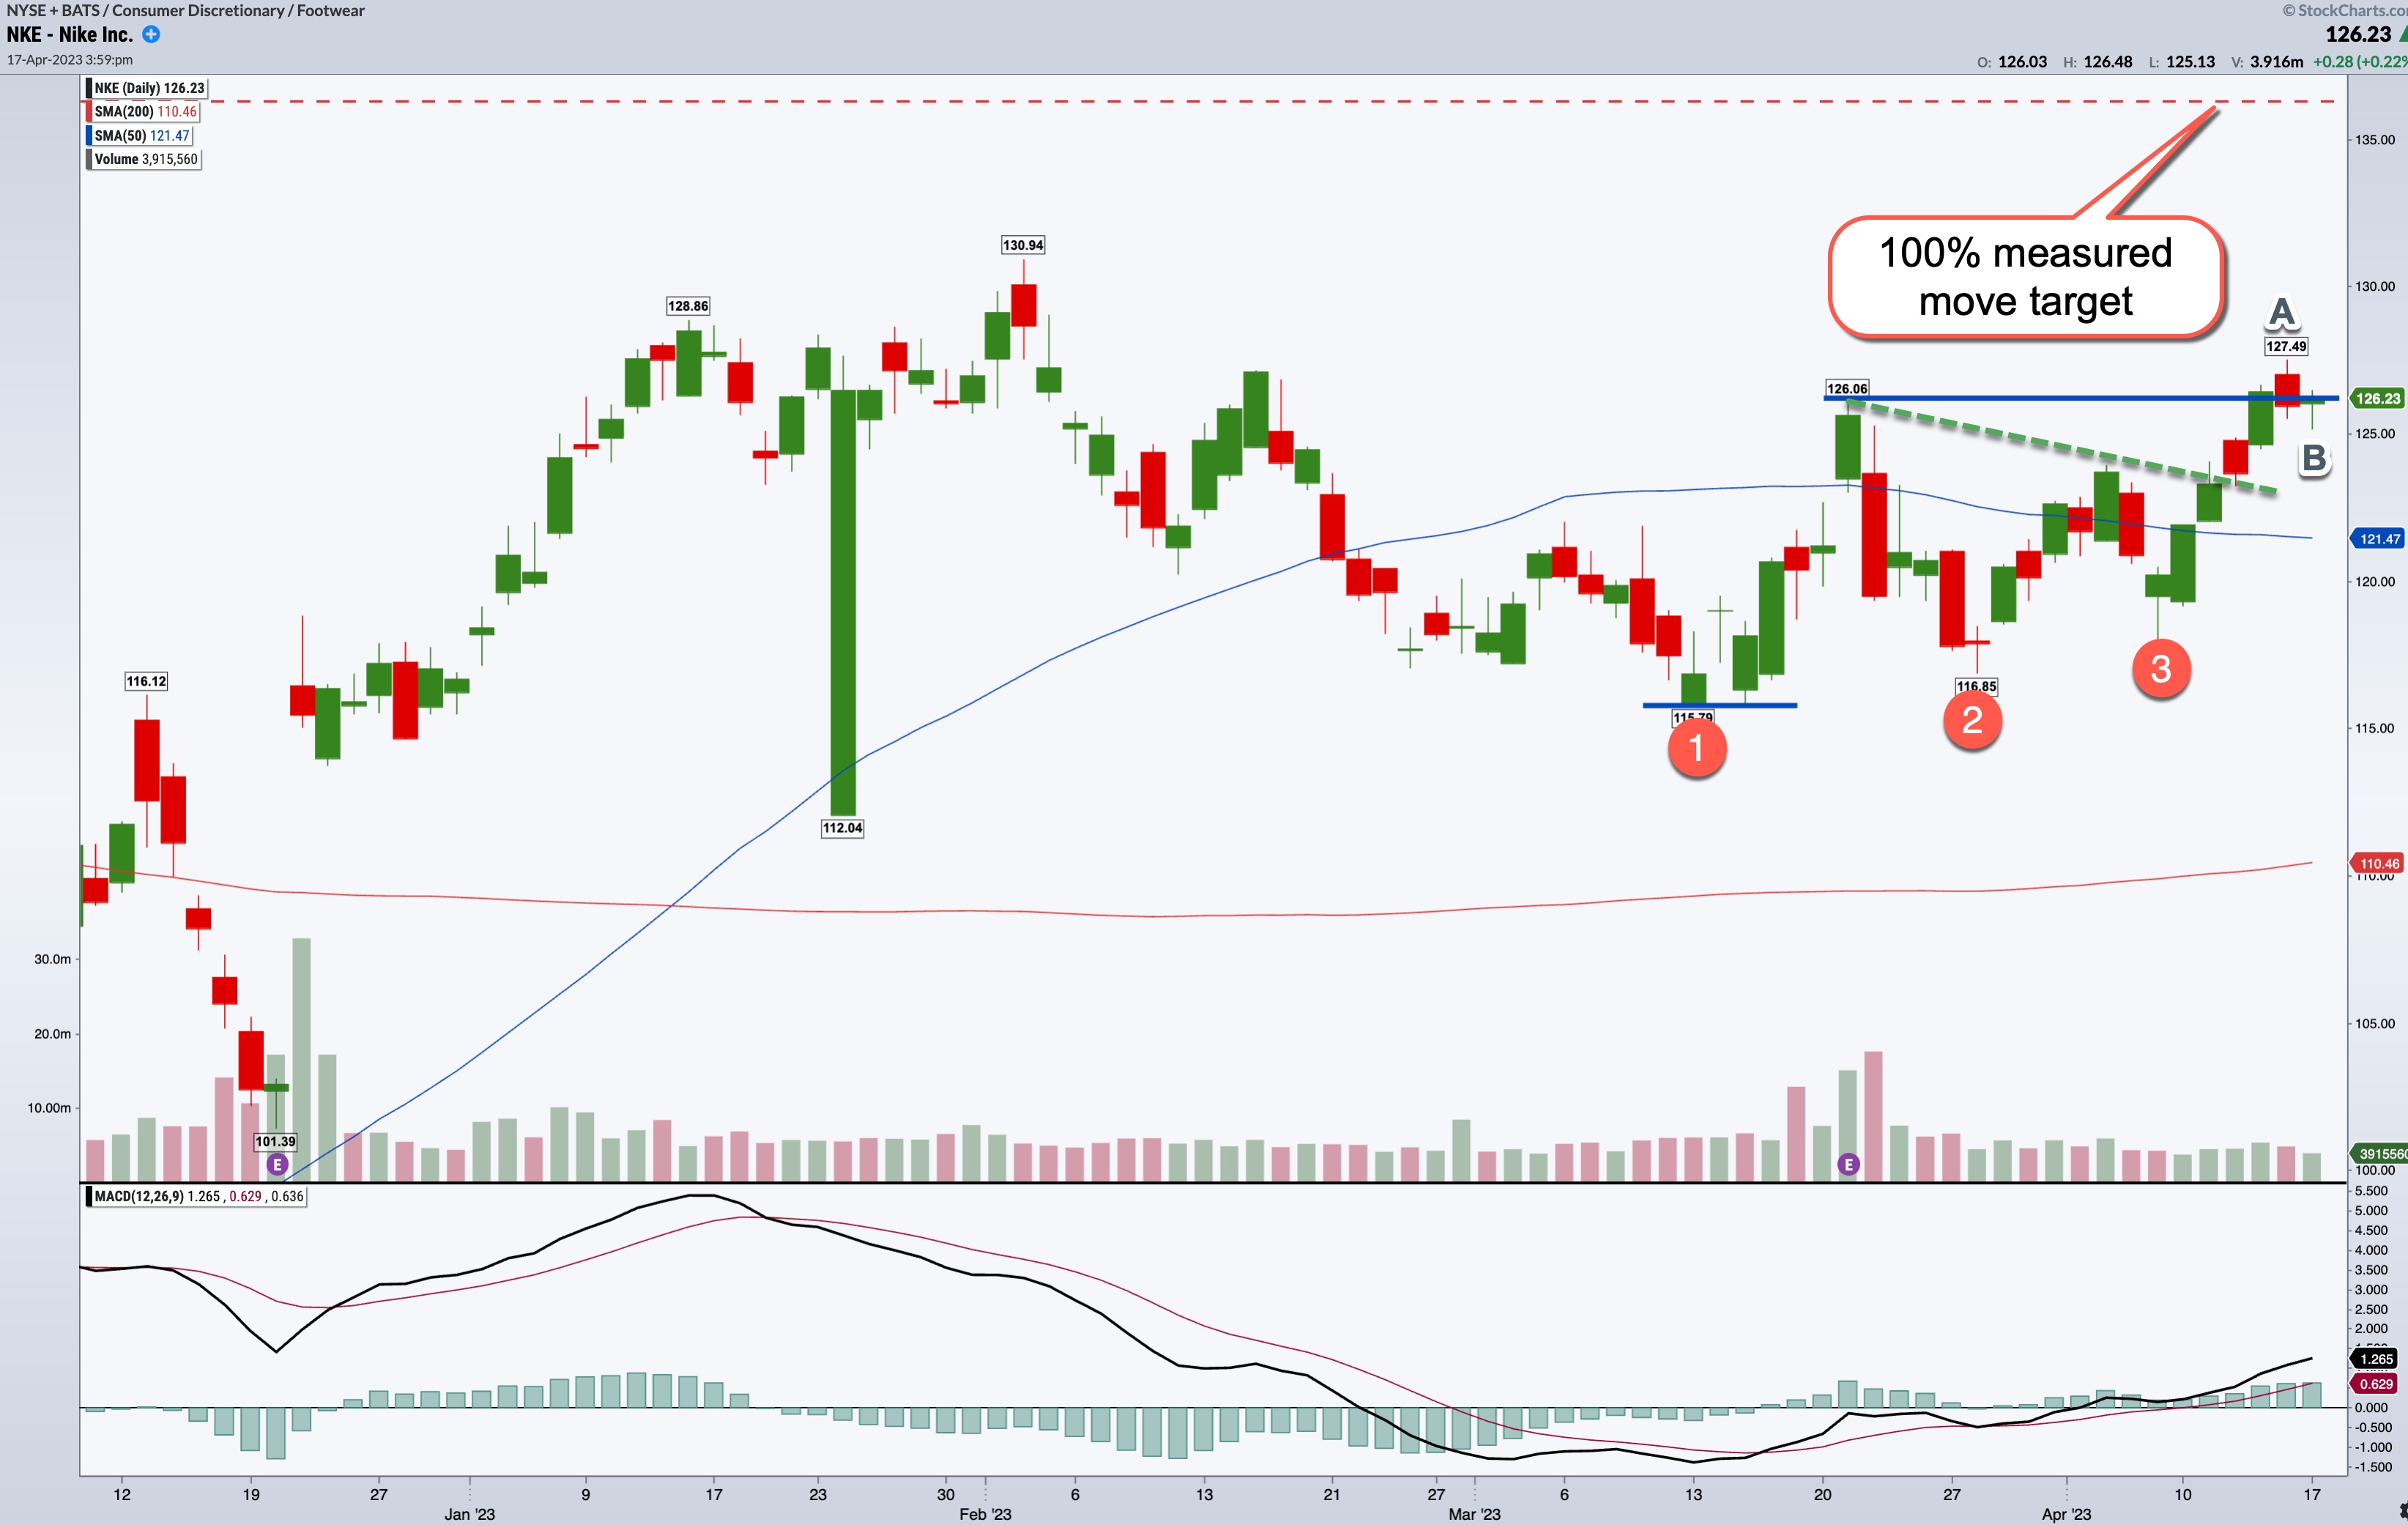
Nike Stock: Three Rising Valleys and Running
by Karl Montevirgen,
The StockCharts Insider
If you plan on running up that hill, a pair of Nikes (NKE) could be the right fit for the task. But now, Nike is tackling a similar scenario, running up a Three Rising Valleyspattern—three consecutive higher lows (more on that later). Does the company have enough momentum to...
READ MORE
MEMBERS ONLY

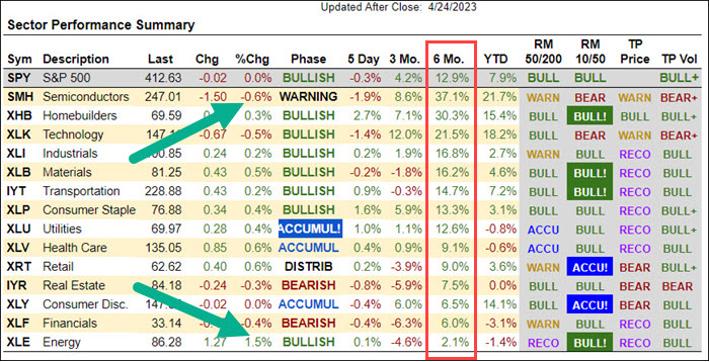
Is the Transportation Sector Starting to Lead?
Over the weekend, we covered the weekly charts of the Economic Modern Family. And...
Given that yields begin this week higher.
Given that earnings season kicks into gear with banks, the weakest sector so far, surviving.
Given that the seasonality of April point bullish for the S&P 500....
READ MORE
MEMBERS ONLY
The Halftime Show: It's NOT What the Fed Does That Matters
by Pete Carmasino,
Chief Market Strategist, Chaikin Analytics
In this week's edition of StockCharts TV'sHalftime, Pete takes a look at the Chaikin system, along with StockCharts tools, to make sense of what's happening in the markets this week. A lot of FED speak is on tap, and tumult abounds. The bond market...
READ MORE
MEMBERS ONLY
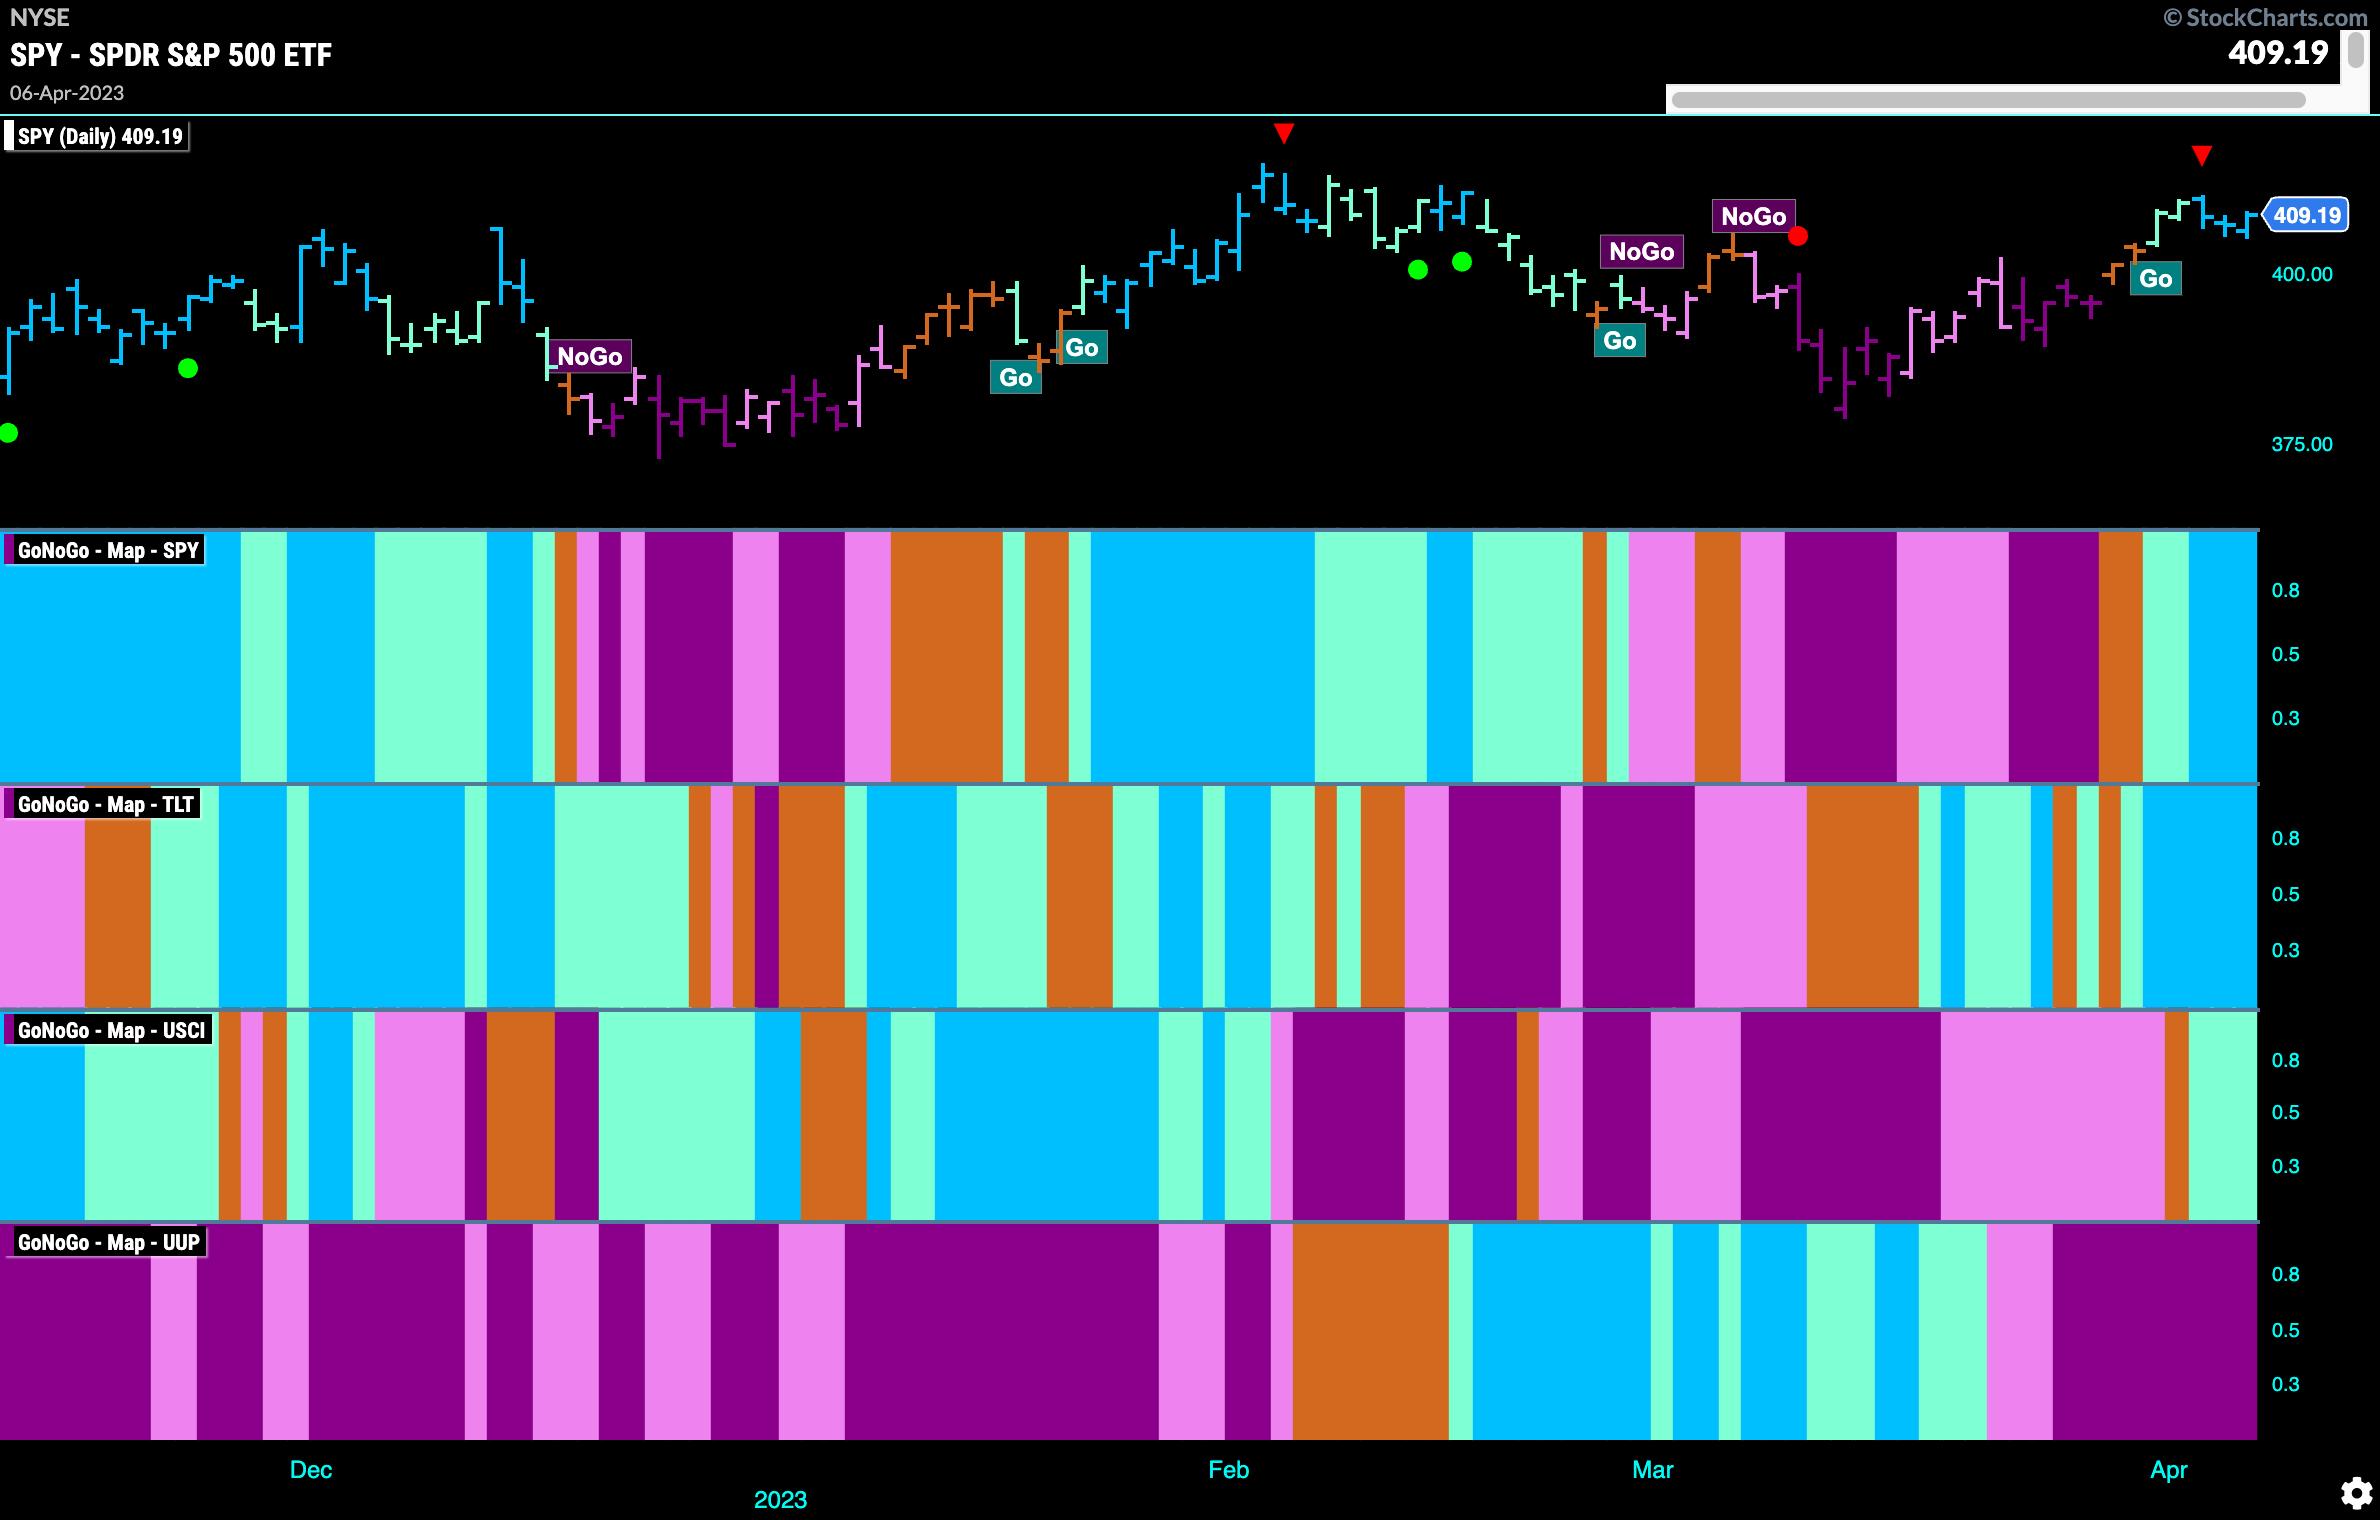
Equities Maintain "Go" Trend as Another Defensive Sector Shows Outperformance
by Alex Cole,
Co-founder, GoNoGo Charts®
by Tyler Wood,
Co-founder, GoNoGo Charts®
How is the overall stock market looking as of the end of last week? Let's take a look at the GoNoGo Asset map below.
Equities remain in the "Go" trend as we start the new week. Treasury bond prices are likewise in a strong "Go,...
READ MORE
MEMBERS ONLY

Will This Massive Reverse Head & Shoulders Bottom Execute?
by Tom Bowley,
Chief Market Strategist, EarningsBeats.com
There are plenty of reversing patterns in technical analysis, but my personal favorite is the combination of a weekly positive divergence and a bottoming head & shoulders pattern. The positive divergence captures the slowing downside momentum and the head & shoulders provides confirmation that prices are indeed turning up. Keep...
READ MORE
MEMBERS ONLY

Week Ahead: Markets Stare At Imminent Consolidation At Higher Levels; Avoid Mindless Chase of the Upmove
by Milan Vaishnav,
Founder and Technical Analyst, EquityResearch.asia and ChartWizard.ae
The Indian equity markets extended their gains for the third week in a row; however, they have ended up getting a bit over-extended on the charts. All four trading sessions in the shortened week ended in gains; in fact, NIFTY has closed with gains for nine sessions in a row...
READ MORE
MEMBERS ONLY
Brand Name Breakouts Amid a Mixed Market
by Mary Ellen McGonagle,
President, MEM Investment Research
The stock market remains in an uptrend after modest gains for the week, which occurred amid signs that the economy is slowing down while inflation is cooling. It was a period marked by large intraday moves, however, as investors digested news that Fed officials are anticipating a mild recession later...
READ MORE
MEMBERS ONLY
Why Market Conditions Are Not Yet Bullish
by David Keller,
President and Chief Strategist, Sierra Alpha Research
A number of my recent conversations on The Final Barhave related to the conflict presented in the markets in April 2023.Classic measures of market trend, from the Coppock Curve to the Zweig Breadth Thrust to my own Market Trend Model, are all giving a strong positive signal on trend...
READ MORE
