MEMBERS ONLY

Ranking Long-Term Breadth; Healthcare Improves; Finance Breaks Down; Technology Holds Up; MAG7 Sets Up

by Arthur Hill,
Chief Technical Strategist, TrendInvestorPro.com
Arthur Hill analyzes breadth in the Health Care, Financials, and Technology sectors. Which sectors are still in a long-term trend, and which are ready to break down? Find out here....
READ MORE
MEMBERS ONLY

StockCharts Insider: ZigZag—The Secret Behind the Most Underrated Non-Indicator in Your Toolbox

by Karl Montevirgen,
The StockCharts Insider
Before We Dive In…
Finding an “edge” in the markets can mean looking at tools that most overlook, or using a seemingly “common” tool from an uncommon angle. The ZigZag is a perfect example. It’s not the most popular tool. It’s not even an indicator. Yet it has...
READ MORE
MEMBERS ONLY

Reading Between the Lines: What RSI and Breadth Are Saying About Stocks

by Frank Cappelleri,
Founder & President, CappThesis, LLC
RSI readings, market breadth, and price patterns can provide directional signals for the stock market. Here's what you should monitor as the market goes through a relatively volatile period....
READ MORE
MEMBERS ONLY

10 Small-Cap Stocks Set to Break Out

by Tom Bowley,
Chief Market Strategist, EarningsBeats.com
Volatility spiked this week, with Tom Bowley breaking down the renewed trade tensions and what they mean for traders. He highlights the breakout in small-caps and reveals ten fast-moving stocks leading the next market rally....
READ MORE
MEMBERS ONLY

The Stock Market’s Sending Mixed Signals: Here’s How to Decode Them

by Jayanthi Gopalakrishnan,
Director of Site Content, StockCharts.com
Get the latest stock market insights: S&P 500 support, small-cap resilience, and sector strength in semiconductors and AI energy stocks....
READ MORE
MEMBERS ONLY

From Trash to Treasure: Micro-Caps Lead the Market’s Risk-On Rebound
Micro-cap returns have outperformed those of the S&P 500 since the April low. Discover how you can capitalize on the micro-cap success if they continue their upward trajectory....
READ MORE
MEMBERS ONLY

5 Overlooked AI Stocks with BIG Upside Potential

by Joe Rabil,
President, Rabil Stock Research
Joe Rabil highlights five overlooked AI trading stocks showing strong trend and momentum setups. He also reviews the S&P market conditions and top stock market charts, including Apple, Nvidia, Oracle, and Teva....
READ MORE
MEMBERS ONLY

The Secret to Better Investing: Watch Fewer Stocks

by Grayson Roze,
Chief Strategist, StockCharts.com
Grayson Roze reveals how narrowing your invest able universe can make you a better trader. See how to use StockCharts tools to focus your strategy, simplify analysis, and make smarter trading decisions....
READ MORE
MEMBERS ONLY

StockCharts Insider: How an “Overbought” RSI Can Be Your Best Buy Signal
by Karl Montevirgen,
The StockCharts Insider
Before We Dive In…
Think “overbought” means it’s time to bail? Not always. Sometimes that 70+ RSI reading doesn’t signal weakness, but strength. In this Insider post, we’ll flip the script on RSI, show you why overbought often means “stay on board,” and give you the tools...
READ MORE
MEMBERS ONLY

Four Roads Diverge in the Market: Which Will the S&P 500 Take?

by David Keller,
President and Chief Strategist, Sierra Alpha Research
We outline four potential scenarios for the S&P 500 index through the end of November 2025, along with our probabilities for each of the scenarios. Which one do you feel is most likely to occur?...
READ MORE
MEMBERS ONLY

StockCharts Insider: How to Use PerfCharts to Decode Investor Sentiment in One Minute or Less
by Karl Montevirgen,
The StockCharts Insider
There are countless tools and strategies for gauging market sentiment. When combined, sure, they give you a full picture. But they also take time.
But what if you just need a quick vibe check? You plan to dig deeper later, but right now, you need a fast read to keep...
READ MORE
MEMBERS ONLY

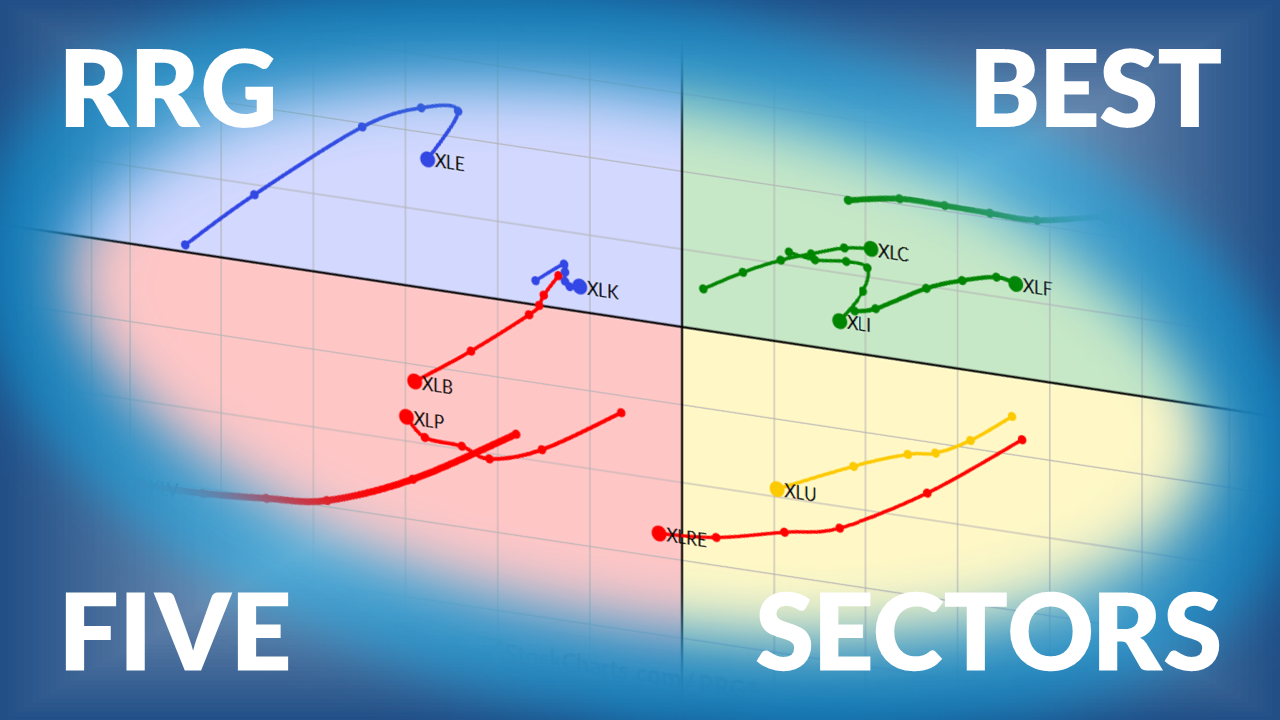
The Best Five Sectors This Week, #40

by Julius de Kempenaer,
Senior Technical Analyst, StockCharts.com
Julius provides his weekly update on US Sector Rotation based on Relative Rotation Graphs....
READ MORE
MEMBERS ONLY
The Market’s Middle Child Problem: Mid-Caps Flash a Warning
Mid-cap stocks have lagged the market of late, market breadth is weakening, and quality stocks may be out of favor. Here are the macro factors that could provide a boost to mid-cap stocks....
READ MORE
MEMBERS ONLY

StockCharts Insider: Reading Offense vs. Defense with Key Ratios
by Karl Montevirgen,
The StockCharts Insider
Before We Dive In…
Ever wish you had a dashboard that flickers between “caution” and “go”? That’s what these Key Ratios are. Wall Street’s caution vs. go signal. They don’t offer trade signals, but they do give you a vibe check, helping you figure out if investors...
READ MORE
MEMBERS ONLY

Week Ahead: Nifty Has Key Resistance in Sight — Time to Guard Gains or Chase Momentum?

by Milan Vaishnav,
Founder and Technical Analyst, EquityResearch.asia and ChartWizard.ae
The NIFTY's current technical setup reflects a market in the process of challenging a key resistance zone. But what does the next week hold?...
READ MORE
MEMBERS ONLY
Should You Sell Now? Here's What the Charts Are Saying

by Mary Ellen McGonagle,
President, MEM Investment Research
ary Ellen reviews the week’s market action, highlighting leadership shifts in semiconductors, health care, utilities, and alternative energy. As sector rotation continues, she also shares how biotechs, small caps, and select quantum and crypto names are setting up with new opportunities.
New videos from Mary Ellen premiere weekly on...
READ MORE
MEMBERS ONLY
Spotting Market Divergences Before They Make Headlines
by Jayanthi Gopalakrishnan,
Director of Site Content, StockCharts.com
Ever get the feeling that the big players know something before the rest of us do? Thursday’s selloff sure made it seem that way.
On the surface, there wasn’t much to explain it. News of a potential ceasefire between Hamas and Israel affected gold, the dollar, and crude...
READ MORE
MEMBERS ONLY

After the Stock Market Drop: Is This the Wake-Up Call?
by Jayanthi Gopalakrishnan,
Director of Site Content, StockCharts.com
The stock market pulled back sharply this week as volatility spiked. Learn what key support levels, sentiment shifts, and charts are telling investors....
READ MORE
MEMBERS ONLY

StockCharts Insider: ChartSchool Hacks (How to Level Up Fast)
by Karl Montevirgen,
The StockCharts Insider
Before We Dive In…
If you haven’t spent much time exploring ChartSchool, we’re about to level up your capacity to learn and apply. First off, ChartSchool is massive. It’s one of the biggest technical analysis libraries out there, which is both a blessing and a curse. But...
READ MORE
MEMBERS ONLY

QQQ Channels Higher, 5 Healthcare Leaders, How to Trade Pullbacks: Case Study and Current Signal
by Arthur Hill,
Chief Technical Strategist, TrendInvestorPro.com
Arthur Hill takes a deep dive into charts of QQQ, healthcare stocks, and tech stocks. ...
READ MORE
MEMBERS ONLY

Sector Rotation Favors Technology — But for How Long?
by Julius de Kempenaer,
Senior Technical Analyst, StockCharts.com
Julius de Kempenaer, creator of RRG Charts, reveals why XLK & XLC remain the key market drivers while defensive sectors struggle. He also examines how asset class rotation still favors stocks over bonds—and what that means for investors watching sector leadership....
READ MORE
MEMBERS ONLY
Momentum Trading Secrets Revealed -- 10 Stocks You Must Watch!
by Tom Bowley,
Chief Market Strategist, EarningsBeats.com
Tom breaks down how rotation following the Fed’s rate cut has been driving powerful momentum in tech, healthcare, and utilities. He spotlights pre-earnings setups in NFLX and SOFI, then talks breakout strength in several of the market’s hottest stocks....
READ MORE
MEMBERS ONLY

StockCharts Insider: Surface vs. Depth: Cracking the Code of Sector Strength
by Karl Montevirgen,
The StockCharts Insider
Before We Dive In…
Every index wears two faces. The first is performance—what you see on the surface. The second is breadth—what lies beneath. Price tells you where the money’s moving today. But breadth tells you if that move has legs, or if it may be running...
READ MORE
MEMBERS ONLY

Will These Three Promising Charts Hold Key Support?
by David Keller,
President and Chief Strategist, Sierra Alpha Research
We highlight three stocks that have experienced strong gains since August, but are now testing key support levels. Will support hold, or will the bull market be brought into question?...
READ MORE
MEMBERS ONLY

How to Trade the Q3 Earnings Wave: Delta, Pepsi, and the Banks
Earnings season is here with Delta Air Lines and PepsiCo on deck. Next week, the focus will be on big banks, which set the stage for the rest of the season....
READ MORE
MEMBERS ONLY

StockCharts Insider: How to Use MarketCarpets for an Ultra-Fast Market Overview
by Karl Montevirgen,
The StockCharts Insider
Before We Dive In…
You can do a lot with MarketCarpets—analyze sectors, spot outliers, gauge technical strength, the whole deal. But let’s cut the fat. You just want a fast, visual read on what’s happening now. So, let’s get to it. I’ll show you how....
READ MORE
MEMBERS ONLY

Is QQQ Losing Steam? These Chart Clues Say Maybe
by Jayanthi Gopalakrishnan,
Director of Site Content, StockCharts.com
Tech stocks stumbled after a strong run. See what QQQ's chart says about the next market move and how to prepare your portfolio....
READ MORE
MEMBERS ONLY
The Best Five Sectors This Week, #39
by Julius de Kempenaer,
Senior Technical Analyst, StockCharts.com
Your weekly update and ranking of US sectors based on Relative Rotation Graphs....
READ MORE
MEMBERS ONLY

A Deep Dive into the Health Care Sector

by Martin Pring,
President, Pring Research
Martin Pring analyzes the Health Care sector, which is breaking out of a key resistance level. On a relative basis, the sector's performance may not be stellar....
READ MORE
MEMBERS ONLY

Week Ahead: NIFTY Stays Above Crucial Supports; Prolonged Complacency in the Markets Remains a Concern
by Milan Vaishnav,
Founder and Technical Analyst, EquityResearch.asia and ChartWizard.ae
The Nifty is consolidating with a slightly positive bias. Here's an analysis of the index and a look at sector performance....
READ MORE
MEMBERS ONLY

Three Brand Name Companies Outside Of Tech That Are On The Move
by Mary Ellen McGonagle,
President, MEM Investment Research
These three stocks are on the move, and they're not tech stocks. ...
READ MORE
MEMBERS ONLY

The Market’s Next Leaders Are Taking Shape – Are You Ready?
by Mary Ellen McGonagle,
President, MEM Investment Research
Mary Ellen reviews the week’s market action, highlighting leadership shifts in semiconductors, health care, utilities, and alternative energy. As sector rotation continues, she also shares how biotechs, small caps, and select quantum and crypto names are setting up with new opportunities.
New videos from Mary Ellen premiere weekly on...
READ MORE
MEMBERS ONLY
Market Check-In: Riding the Highs (But Staying Watchful)
by Jayanthi Gopalakrishnan,
Director of Site Content, StockCharts.com
Another week, another round of fresh highs in the stock market, although the Nasdaq Composite ($COMPQ) wasn't able to hold on to its winning streak! Still, investor enthusiasm is high, and even a government shutdown isn’t slowing it down right now. What’s especially interesting is how...
READ MORE
MEMBERS ONLY

Trend Signals in Healthcare and Healthcare Stocks, 5 New Signals, 12 Leading Uptrends
by Arthur Hill,
Chief Technical Strategist, TrendInvestorPro.com
The Health Care sector is making a comeback, with stocks within the sector generating new bullish signals. Here's a deep dive into the sector....
READ MORE