MEMBERS ONLY

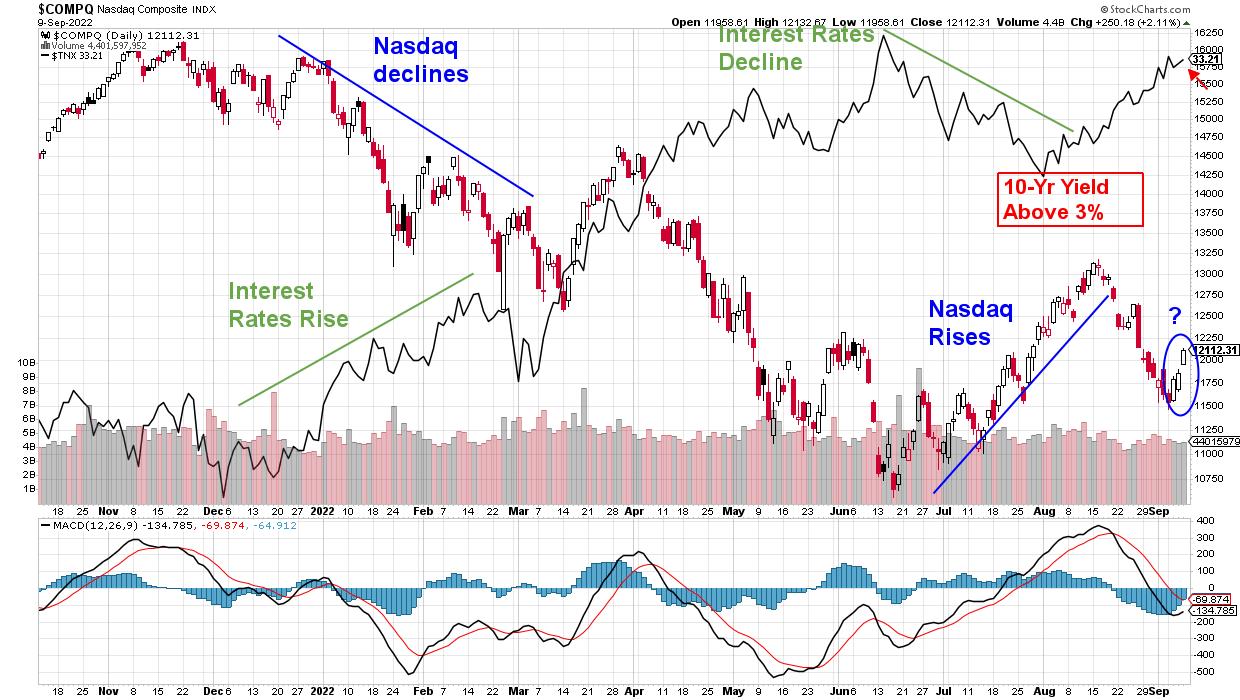
Mish's Daily: Why Higher Inflation Matters and Transportation is Key
After a higher-than-anticipated CPI report, the major market averages traded much lower. August's CPI came in increased by 20 basis points.
Fed Futures are now pricing in a 20% chance of a 100-basis point hike and an 80% chance of a 75-basis point hike. Inflation has broadened in...
READ MORE
MEMBERS ONLY

Consumer Discretionary Picking Up Strength

by Julius de Kempenaer,
Senior Technical Analyst, StockCharts.com
On the weekly Relative Rotation Graph, the consumer discretionary sector continues to improve and is now pushing further into the leading quadrant. It is now the sector with the highest JdK RS-Momentum reading. The tail length is fairly long compared to the other tails in the universe. All in all,...
READ MORE
MEMBERS ONLY

Sector Spotlight: Money Moving Back to XLY and Bitcoin
by Julius de Kempenaer,
Senior Technical Analyst, StockCharts.com
In this week's edition of StockCharts TV's Sector Spotlight, I start with an overview of the current asset class rotation, using daily and weekly Relative Rotation Graphs. In this segment, I replace VNQ (real estate) with BTC, which better represents the asset class landscape, as Real...
READ MORE
MEMBERS ONLY

Bearish Weekly Dollar Candles May Help Change the Energy Inflation Dynamic

by Martin Pring,
President, Pring Research
It is a well-established fact that the dollar and oil prices move in opposite directions, most of the time. Perhaps a more accurate way of saying the same thing is to observe that a rising dollar acts as a headwind for energy prices, while a falling one acts a tailwind...
READ MORE
MEMBERS ONLY

DP Trading Room: S&P "Ten" Leading the Market?

by Erin Swenlin,
Vice President, DecisionPoint.com

by Carl Swenlin,
President and Founder, DecisionPoint.com
On this week's edition of The DecisionPoint Trading Room, Carl covers what the market was up to and reviews Friday's indicators. He looks at the top ten capitalized stocks in the S&P to see which, if any, were leading the market higher. Apple (AAPL)...
READ MORE
MEMBERS ONLY

Mish's Daily: The Stock Market Bounces Amidst Strong Headwinds
The S&P 500 was sharply oversold last week according to Our Big View weekly analysis. Hence, the market bounced and cleared the 50-day moving average in all indices.
The macro backdrop for the financial system remains the same. However, with all the headwinds, can this bounce last?
First...
READ MORE
MEMBERS ONLY

Power Charting TV: Accumulation in the Master's Own Words

by Bruce Fraser,
Industry-leading "Wyckoffian"
Richard D. Wyckoff, the Master, in his own words; and his quest to understand what propelled stock prices.
He observed large interests conducting campaigns of a magnitude that resulted in trends lasting for months and years. As a young man he studied these Composite Operators (C.O.) and how they...
READ MORE
MEMBERS ONLY

Special Note: A Breakout is in The Offing from This Large Rectangle Pattern; Watch Out

by Milan Vaishnav,
Founder and Technical Analyst, EquityResearch.asia and ChartWizard.ae
ADANIPORTS has been showing some potent technical developments on the longer-term timeframe charts. While most of the Adani Group stocks have run up too high and ahead of the curve, this stock has been consolidating in a wide and well-defined trading range and has formed a great base for itself....
READ MORE
MEMBERS ONLY
The S&P 500 Has Traded Back Above Key Resistance - Here's What To Do Next

by Mary Ellen McGonagle,
President, MEM Investment Research
The markets ended the week with a strong rally that occurred despite hawkish comments from several Federal Reserve officials and Fed Chair Powell. Their comments increase the possibility that rates will be increased by 75 basis points at their next meeting later this month while also pointing to a prolonged...
READ MORE
MEMBERS ONLY
One Key Moving Average in Stocks Cleared: Now What?
Reserve Chairman Jerome Powell's speech this past week cautioned against prematurely loosening monetary policy.
Powell's speech reminds us that the Fed is focused on keeping inflation under control. Nonetheless, what we also learned this week is that technical matter. It is far more crucial to monitor...
READ MORE
MEMBERS ONLY

MEM TV: Does This Rally Have Legs?
by Mary Ellen McGonagle,
President, MEM Investment Research
On this week's edition of StockCharts TV'sThe MEM Edge, Mary Ellen reviews last week's rally, which pushed the markets above a key area of near-term resistance. She also shares stocks from the top-performing sectors that have positive charts, with a focus on base breakouts....
READ MORE
MEMBERS ONLY

Down, Then Up, Up and Away!

by Larry Williams,
Veteran Investor and Author
Larry goes back to the future in this exclusive StockCharts TV special! The stock market, he predicts, will go down a bit, before then heading UP, UP & Away! He shares the things that make him think that way, including inflation, stocks, and a view of the future.
This video...
READ MORE
MEMBERS ONLY

Oversold Bounce

by TG Watkins,
Director of Stocks, Simpler Trading
On this week's edition of Moxie Indicator Minutes, TG reviews general markets and tickers which give us an idea of the overall weakness out there. We are prepared to have prices move up right now, since things are really oversold, but, based on the Moxie rules and trade...
READ MORE
MEMBERS ONLY

STOCKS REBOUND FROM FROM OVERSOLD CONDITION -- COMMODITIES REMAIN WEAK -- ENERGY PRICES DECLINE

by John Murphy,
Chief Technical Analyst, StockCharts.com
S&P 500 ENDS THREE-WEEK DECLINE... Stocks are ending the week on a strong note after falling for the previous three weeks. An oversold condition and the presence of underlying chart support are also playing a role in this week's buying. The 9-day RSI line in the...
READ MORE
MEMBERS ONLY

Energy-based ETFs Hold Up Despite Weakness in Stocks and Oil

by Arthur Hill,
Chief Technical Strategist, TrendInvestorPro.com
It has been a rough four weeks for stocks and oil, but the energy-related ETFs held up relatively well and remain in uptrends. The PerfChart below shows performance for SPY, oil, the DB Energy ETF (DBE) and five energy-related ETFs since August 16th, which is when SPY peaked. SPY is...
READ MORE
MEMBERS ONLY

Important Details About the MACD

by Joe Rabil,
President, Rabil Stock Research
On this week's edition of Stock Talk with Joe Rabil, Joe discusses the useful and powerful MACD indicator, explaining how it can move from an OB/OS oscillator to a Trend and Momentum Indicator. Using both price and ADX as supplemental tools, we can take advantage of MACD...
READ MORE
MEMBERS ONLY

GNG TV: US Equities - the "NoGo" Continues

by Alex Cole,
Co-founder, GoNoGo Charts®

by Tyler Wood,
Co-founder, GoNoGo Charts®
In this week's edition of the GoNoGo Charts show, Tyler and Alex take a top down approach to the markets using GoNoGo Charts. Starting with the macro drivers such as Treasury rates, oil and the dollar and moving into a relative strength Sector RelMap, they analyze leaders and...
READ MORE
MEMBERS ONLY
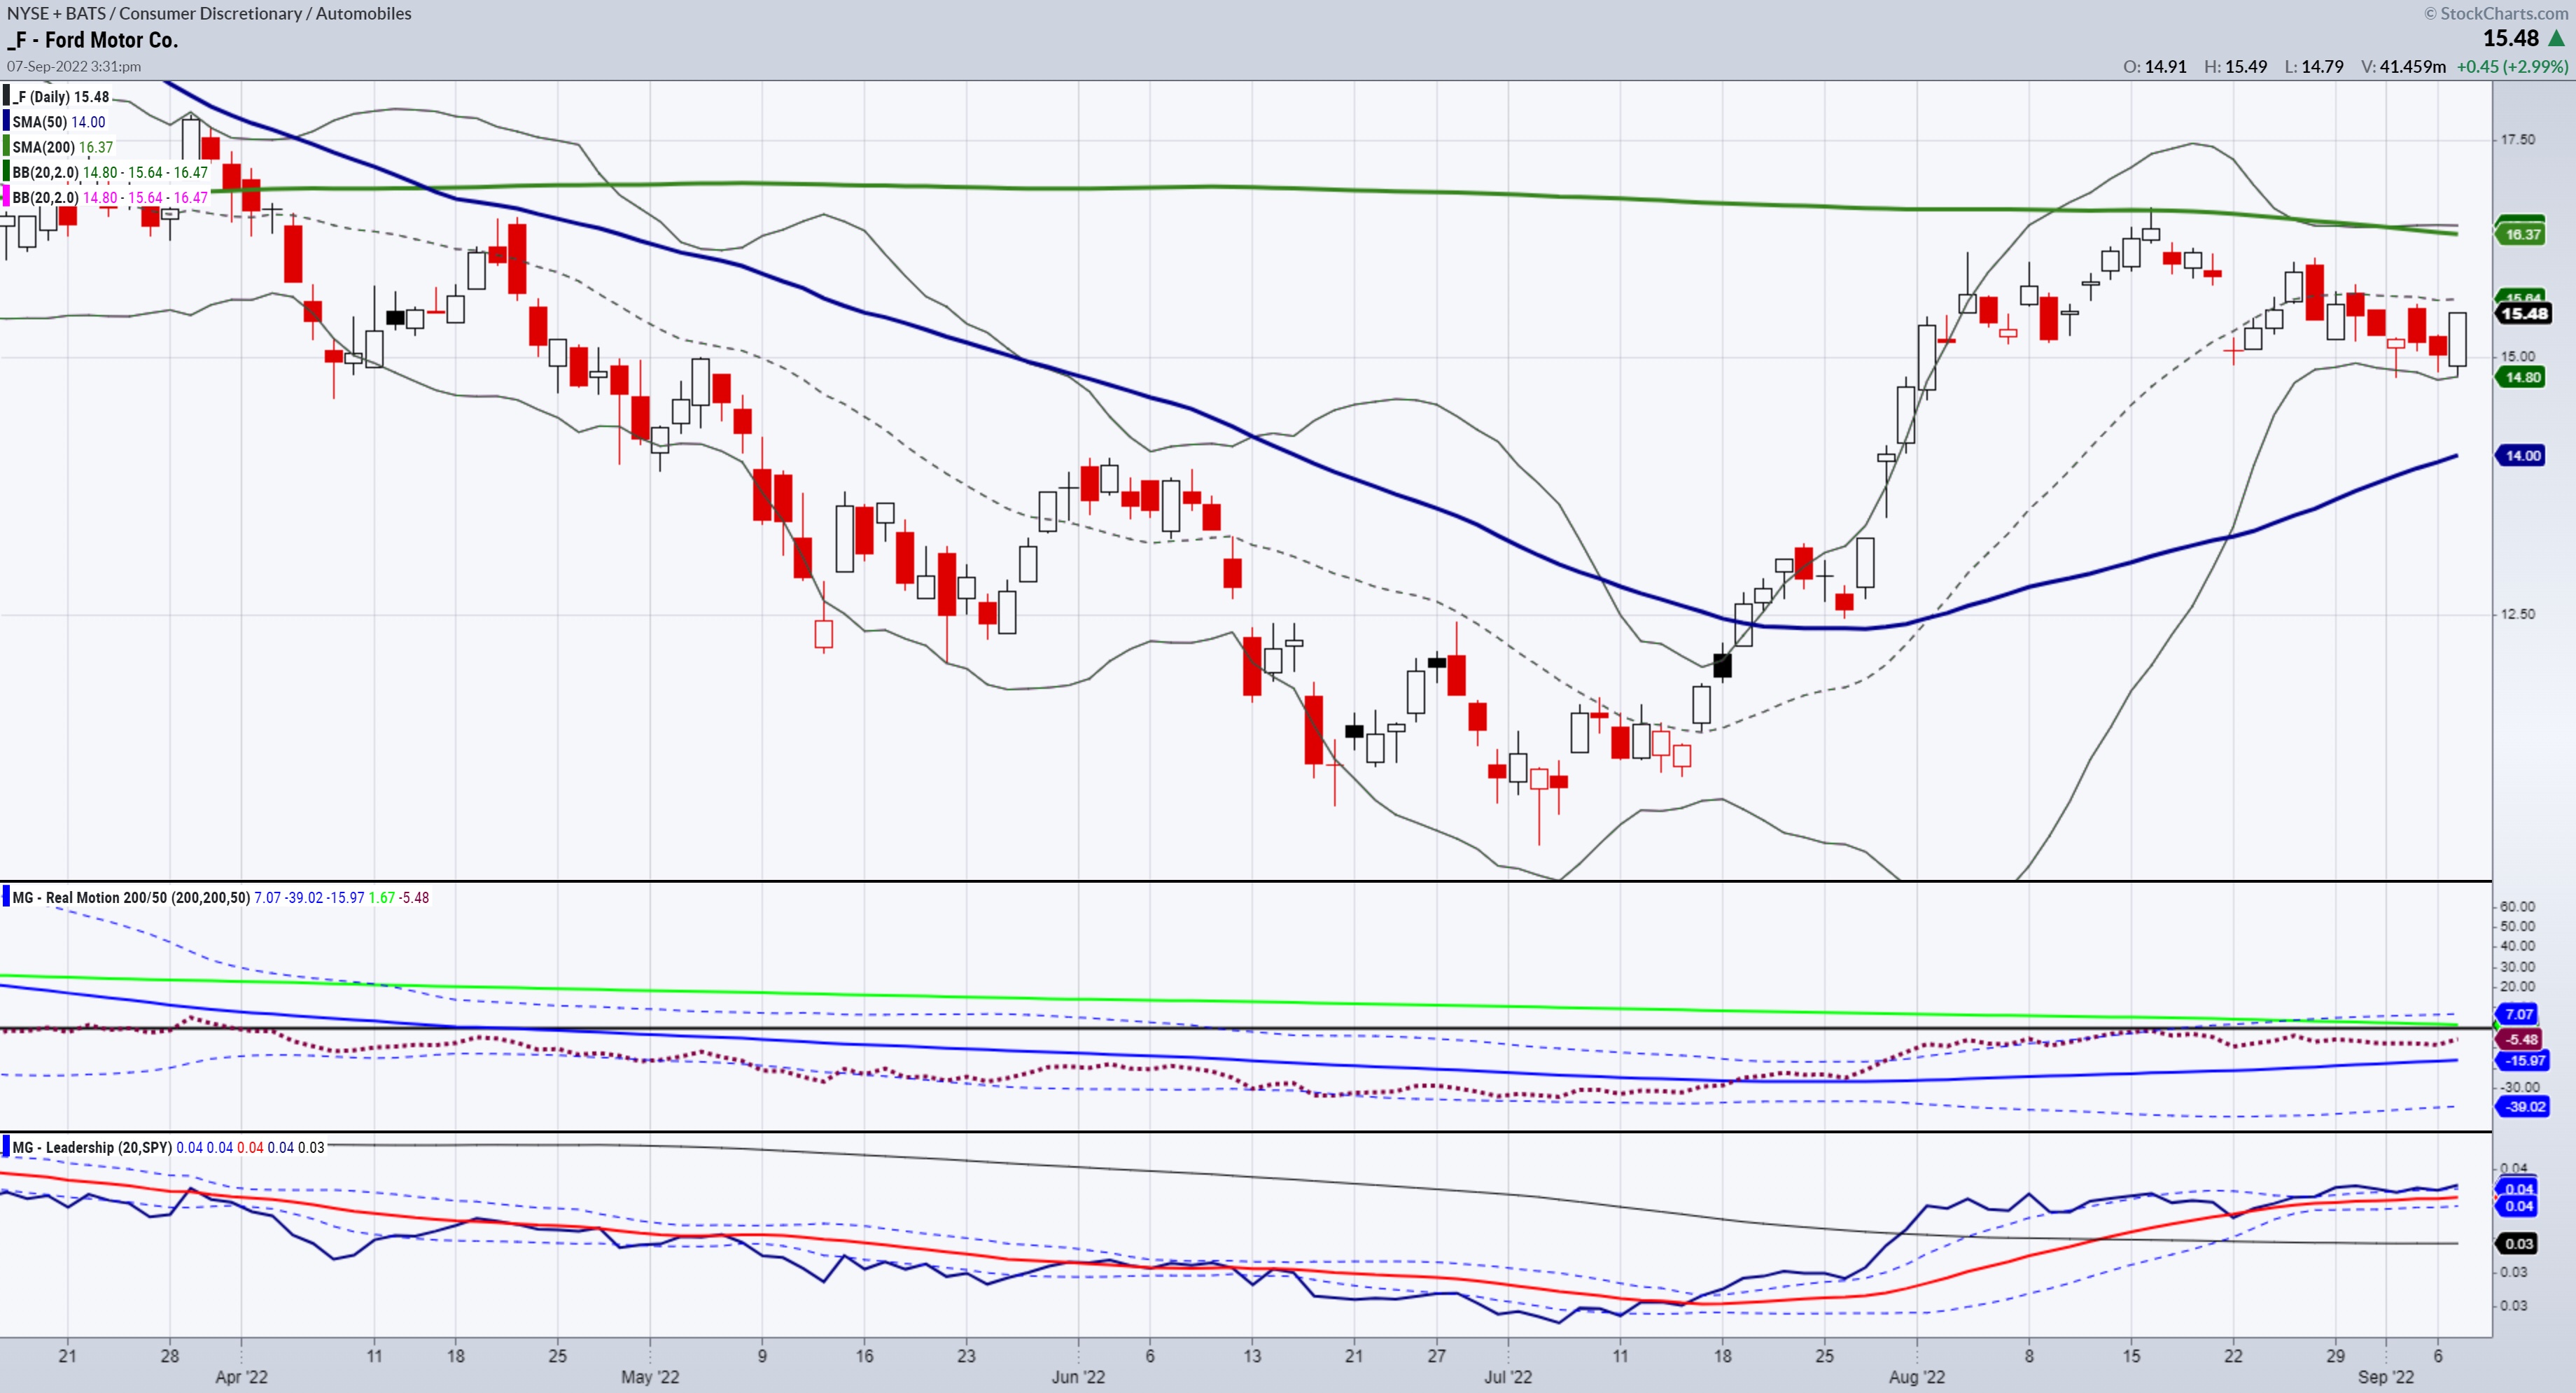
Mish's Daily: Why Ford is a Great Long-Term Investment
The Biden administration declared an intermediate target in August 2021 that 50% of all new automobiles would be electrified by 2030. This transition to lithium-ion battery power will potentially guard against climate change and counter China's aggressive push into the global EV automobile market. Electric car efforts are...
READ MORE
MEMBERS ONLY

Your Brain Before, During and After a Trade

by Dave Landry,
Founder, Sentive Trading, LLC
On this week's edition of Trading Simplified, Dave continues to follow up with his "Next 100 Trades" series by discussing recent mystery charts with lessons on how to avoid putting capital into harm's way. In his "Mind The Trade" segment, he discusses...
READ MORE
MEMBERS ONLY

This Chart Provides Tradable Bottom Signals and It's Flashing a MAJOR Buy Right Now

by Tom Bowley,
Chief Market Strategist, EarningsBeats.com
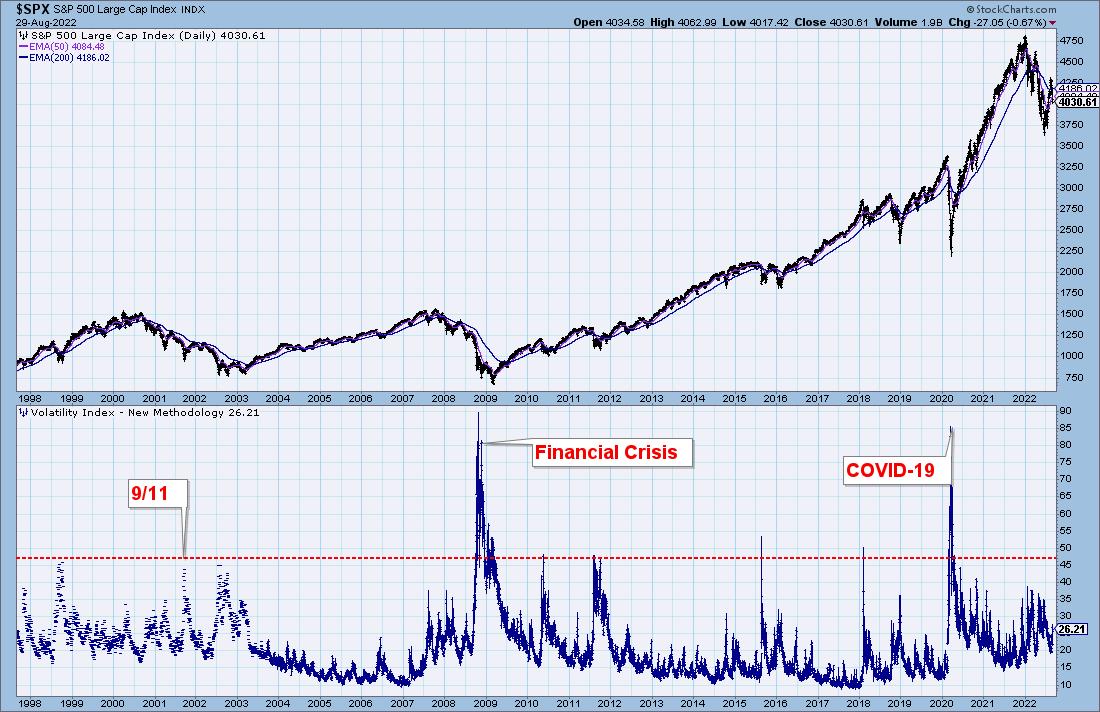
When we endure a lengthy bear market, many technical buy signals can be thrown right out the window. They don't work as pessimism and outright fear take over the market; instead, you have to be prepared for reversals based on extreme sentiment readings.
Historically, Volatility Index ($VIX) readings...
READ MORE
MEMBERS ONLY

Preparing for an Upcoming Bond Mini-Bull Market
by Martin Pring,
President, Pring Research
This may seem like a foolish title, given that the Fed could be about to raise short-term interest rates by as much as 75 basis points in September with further, but smaller, hikes following that. However, bonds revolve around the business cycle in a chronological sequence, as do stocks and...
READ MORE
MEMBERS ONLY

Mish's Daily: The Economic Modern Family Reveals All for Investors
Semiconductors have been a significant drag on Wall Street. Sister Semiconductors (SMH) needs to regain her -50week moving average to really see a major technical shift in the market. She is a good barometer of the overall direction of the stock market.
The "Modern Family" comprises seven key...
READ MORE
MEMBERS ONLY
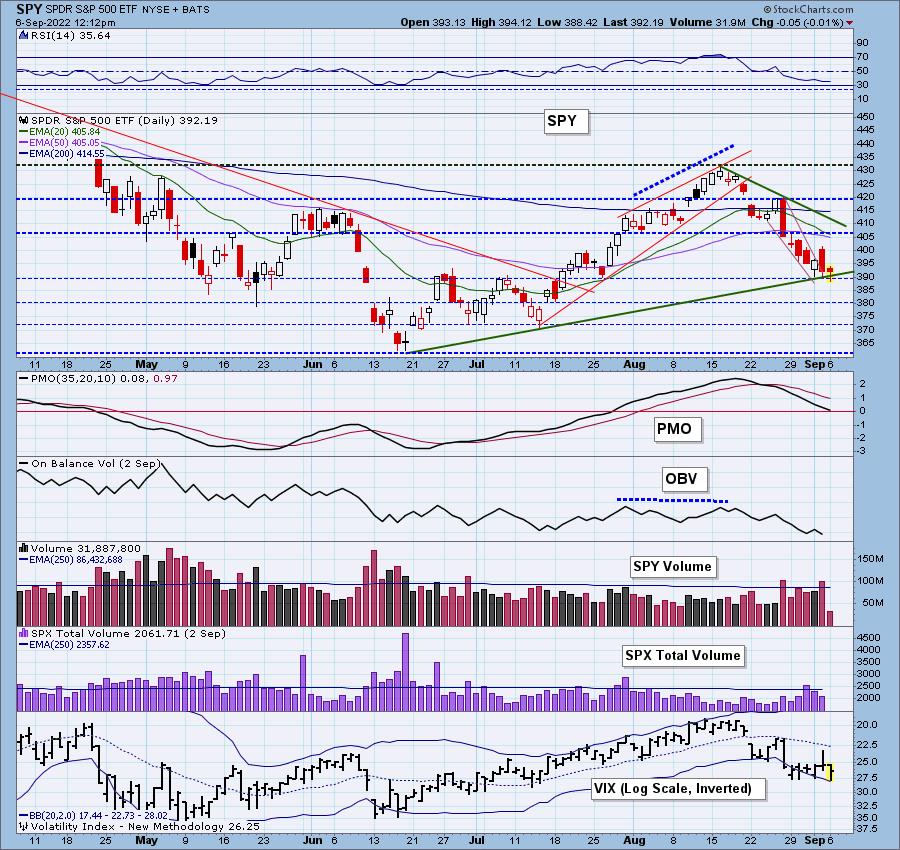
Decline Stalled by Short-Term Technicals
by Carl Swenlin,
President and Founder, DecisionPoint.com
For the last three trading days the SPY decline has stalled, and price has settled on the 390 level, at which we can see an horizontal line of support and a rising trend line converging to support price. The VIX is somewhat oversold, but nothing to write home about.
The...
READ MORE
MEMBERS ONLY
Sector Spotlight: 6/11 Sectors in Downtrend on Monthly Chart
by Julius de Kempenaer,
Senior Technical Analyst, StockCharts.com
In this week's edition of StockCharts TV's Sector Spotlight, for the first Tuesday of September, I dive into the monthly chart, which was completed last Thursday. We kick off with a view of sector rotation using the newly added monthly time frame on Relative Rotation Graphs;...
READ MORE
MEMBERS ONLY

I'm No Skeerdy Cat, I'll Fight The Fed
by Tom Bowley,
Chief Market Strategist, EarningsBeats.com
Yes, I'm very familiar with that old Wall Street adage, "Don't Fight The Fed!" But similar to the "Go Away In May" theory, I'm happy to poke holes in it. Rather than just blindly buy what the media is selling,...
READ MORE
MEMBERS ONLY

Week Ahead: Directional Move in NIFTY Unlikely So Long as the Index is in This Range; RRG Chart Shows Interesting Sector Rotations
by Milan Vaishnav,
Founder and Technical Analyst, EquityResearch.asia and ChartWizard.ae
Although the markets ended flat on a weekly note, the past five sessions remained quite volatile. The markets stepped into the week while inheriting a very weak global trade setup; the weakness was inflicted by very bearish reactions of the US markets following Jerome Powell's comments at the...
READ MORE
MEMBERS ONLY
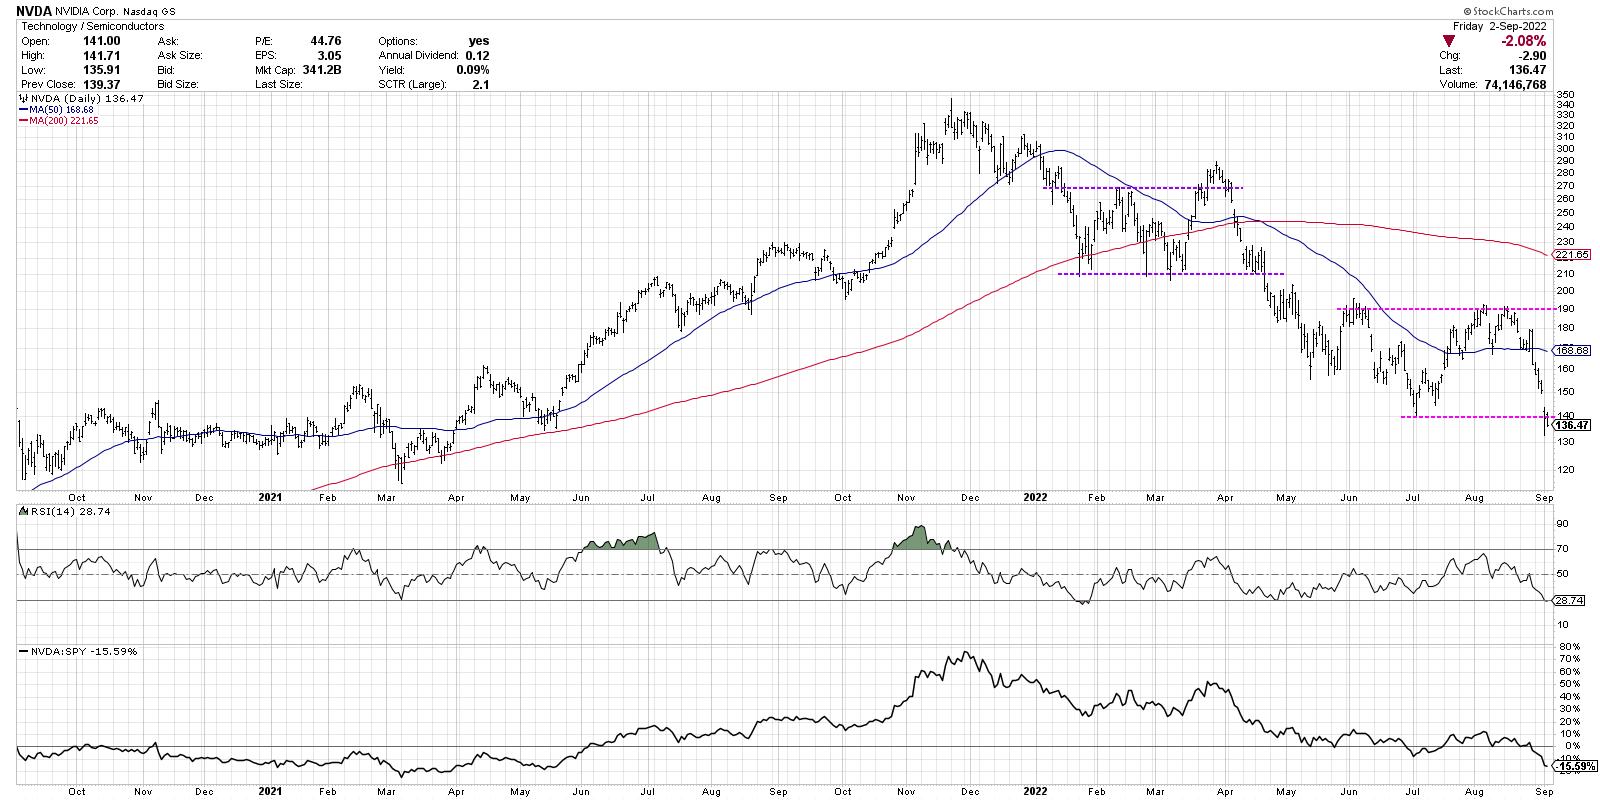
As Goes NVDA, So Goes the Market

by David Keller,
President and Chief Strategist, Sierra Alpha Research
I find semiconductors to be an important group to watch, given that they essentially provide the "backbone" to our modern information economy. Pretty much every product we use at this point has a chip involved, so if chip makers are doing well, then I can assume the economy...
READ MORE
MEMBERS ONLY
Weekend Daily: Trading Plan for the Week with the Economic Modern Family
Hello friends,
Labor Day is approaching, and the market is closed in observation, so it's time for some fantastic fun, entertainment for everyone, and relaxation.
I have been doing two videos a week along with the written commentary to introduce you to the one index and six sectors...
READ MORE
MEMBERS ONLY

Out of 104, Only Two Industry Groups Show Rising Momentum
by Erin Swenlin,
Vice President, DecisionPoint.com
DecisionPoint Diamonds scans have failed to produce. In order to get even a few results, we have had to ease the restrictions, particularly on EMA configurations. If we don't get scan results for "Diamonds in the Rough", we dive into the Industry Summary on StockCharts.com...
READ MORE
MEMBERS ONLY

MEM TV: Negative Bias Remains Ahead of Holiday Weekend
by Mary Ellen McGonagle,
President, MEM Investment Research
On this week's edition of StockCharts TV'sThe MEM Edge, Mary Ellen reviews where upside resistance is for the S&P 500, as well as why Growth stocks are getting hit the hardest. She also shares select inverse funds to buffer your holdings.
This video was...
READ MORE
MEMBERS ONLY
Called the Top and the Destination
by TG Watkins,
Director of Stocks, Simpler Trading
Recently, the market has been moving in ways that perfectly capture the Moxie setups and rules that TG has developed. On this week's edition of Moxie Indicator Minutes, TG stresses that when you see Moxie patterns line up in such clear ways, you really need to act on...
READ MORE
MEMBERS ONLY
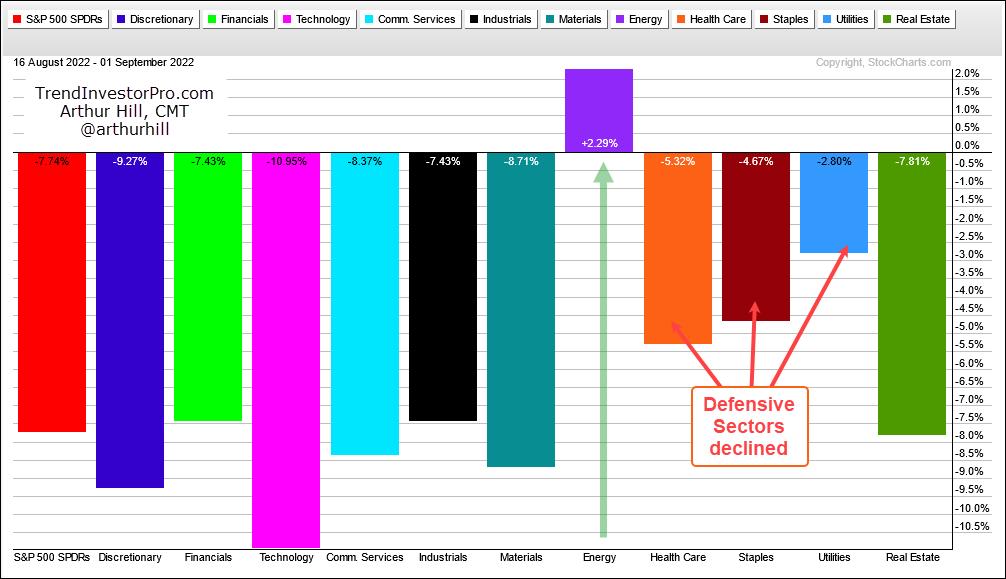
So Called Defensive ETFs are Not Immune
by Arthur Hill,
Chief Technical Strategist, TrendInvestorPro.com
The short-term trends for the big three are down (SPY, QQQ, IWM) and we are in a bear market. Over the last two weeks, the short-term trend (down) aligned with the long-term trend (down). This is a powerful combination that can lead to rising correlation among stocks. Note that downside...
READ MORE
MEMBERS ONLY
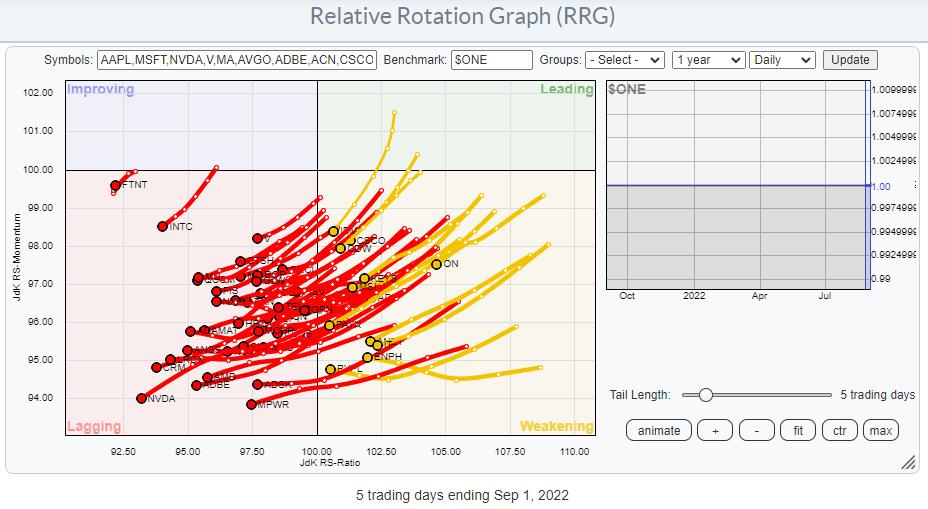
Inside Tech, It's Really AAPL vs. MSFT
by Julius de Kempenaer,
Senior Technical Analyst, StockCharts.com
Plotting the components of the Information Technology Sector against $ONE provides us with a sobering picture. Pretty much every single stock in that index is in a downtrend, inside lagging, and/or inside weakening (and very close to entering lagging).
Plotting that same graph on a weekly timeframe shows almost...
READ MORE
MEMBERS ONLY
GNG TV: US Equities Back in "NoGo" Trend
by Alex Cole,
Co-founder, GoNoGo Charts®
by Tyler Wood,
Co-founder, GoNoGo Charts®
In this week's edition of the GoNoGo Charts show, Alex and Tyler examine the weight of the evidence and use GoNoGo to react responsibly to market trends. S&P 500 trends are in NoGo conditions across weekly, daily, and intraday timeframes. US Interest rates ($TNX) decisively broke...
READ MORE
MEMBERS ONLY
Use MACD to Find Trade Location
by Joe Rabil,
President, Rabil Stock Research
On this week's edition of Stock Talk with Joe Rabil, Joe shows how to use the MACD indicator to zero in on the best trade locations. This indicator is a trend/momentum tool, but also functions as an overbought/oversold oscillator, and Joe explains when how to recognize...
READ MORE
MEMBERS ONLY
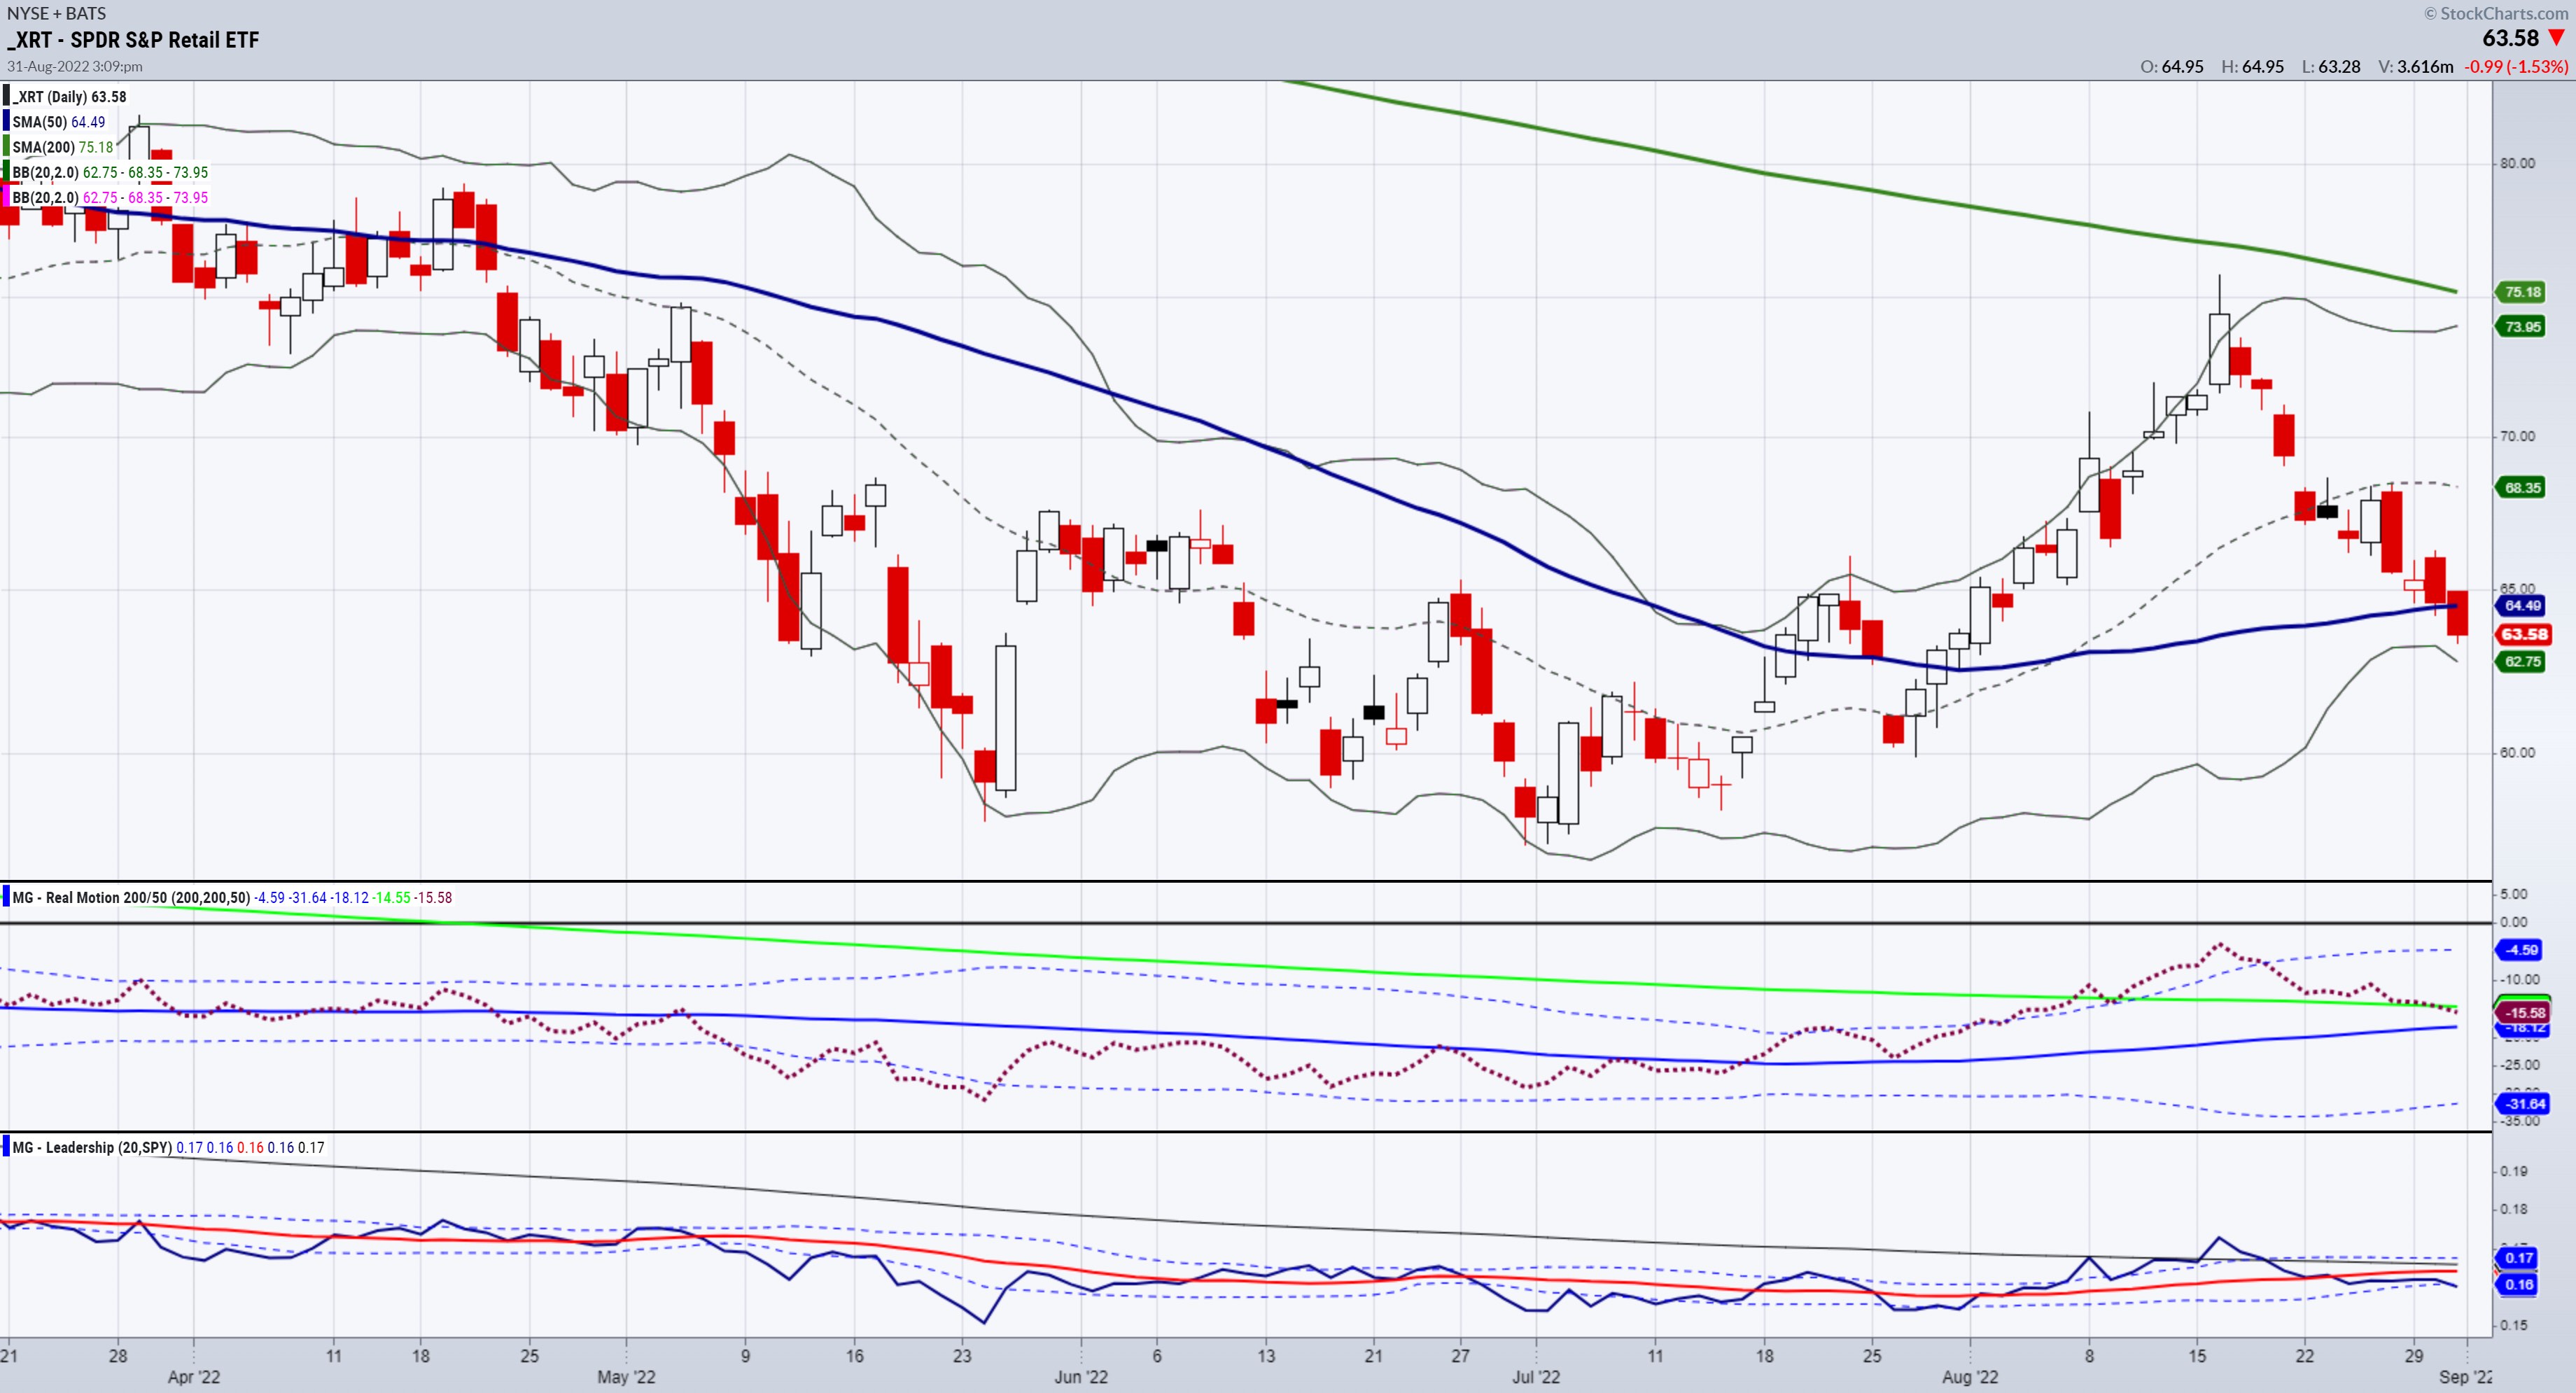
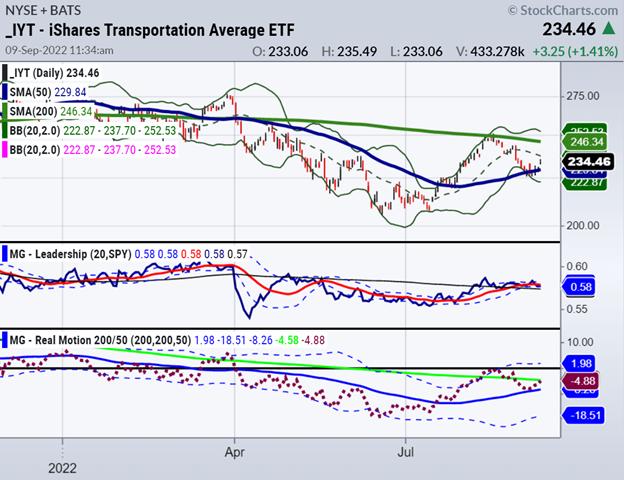
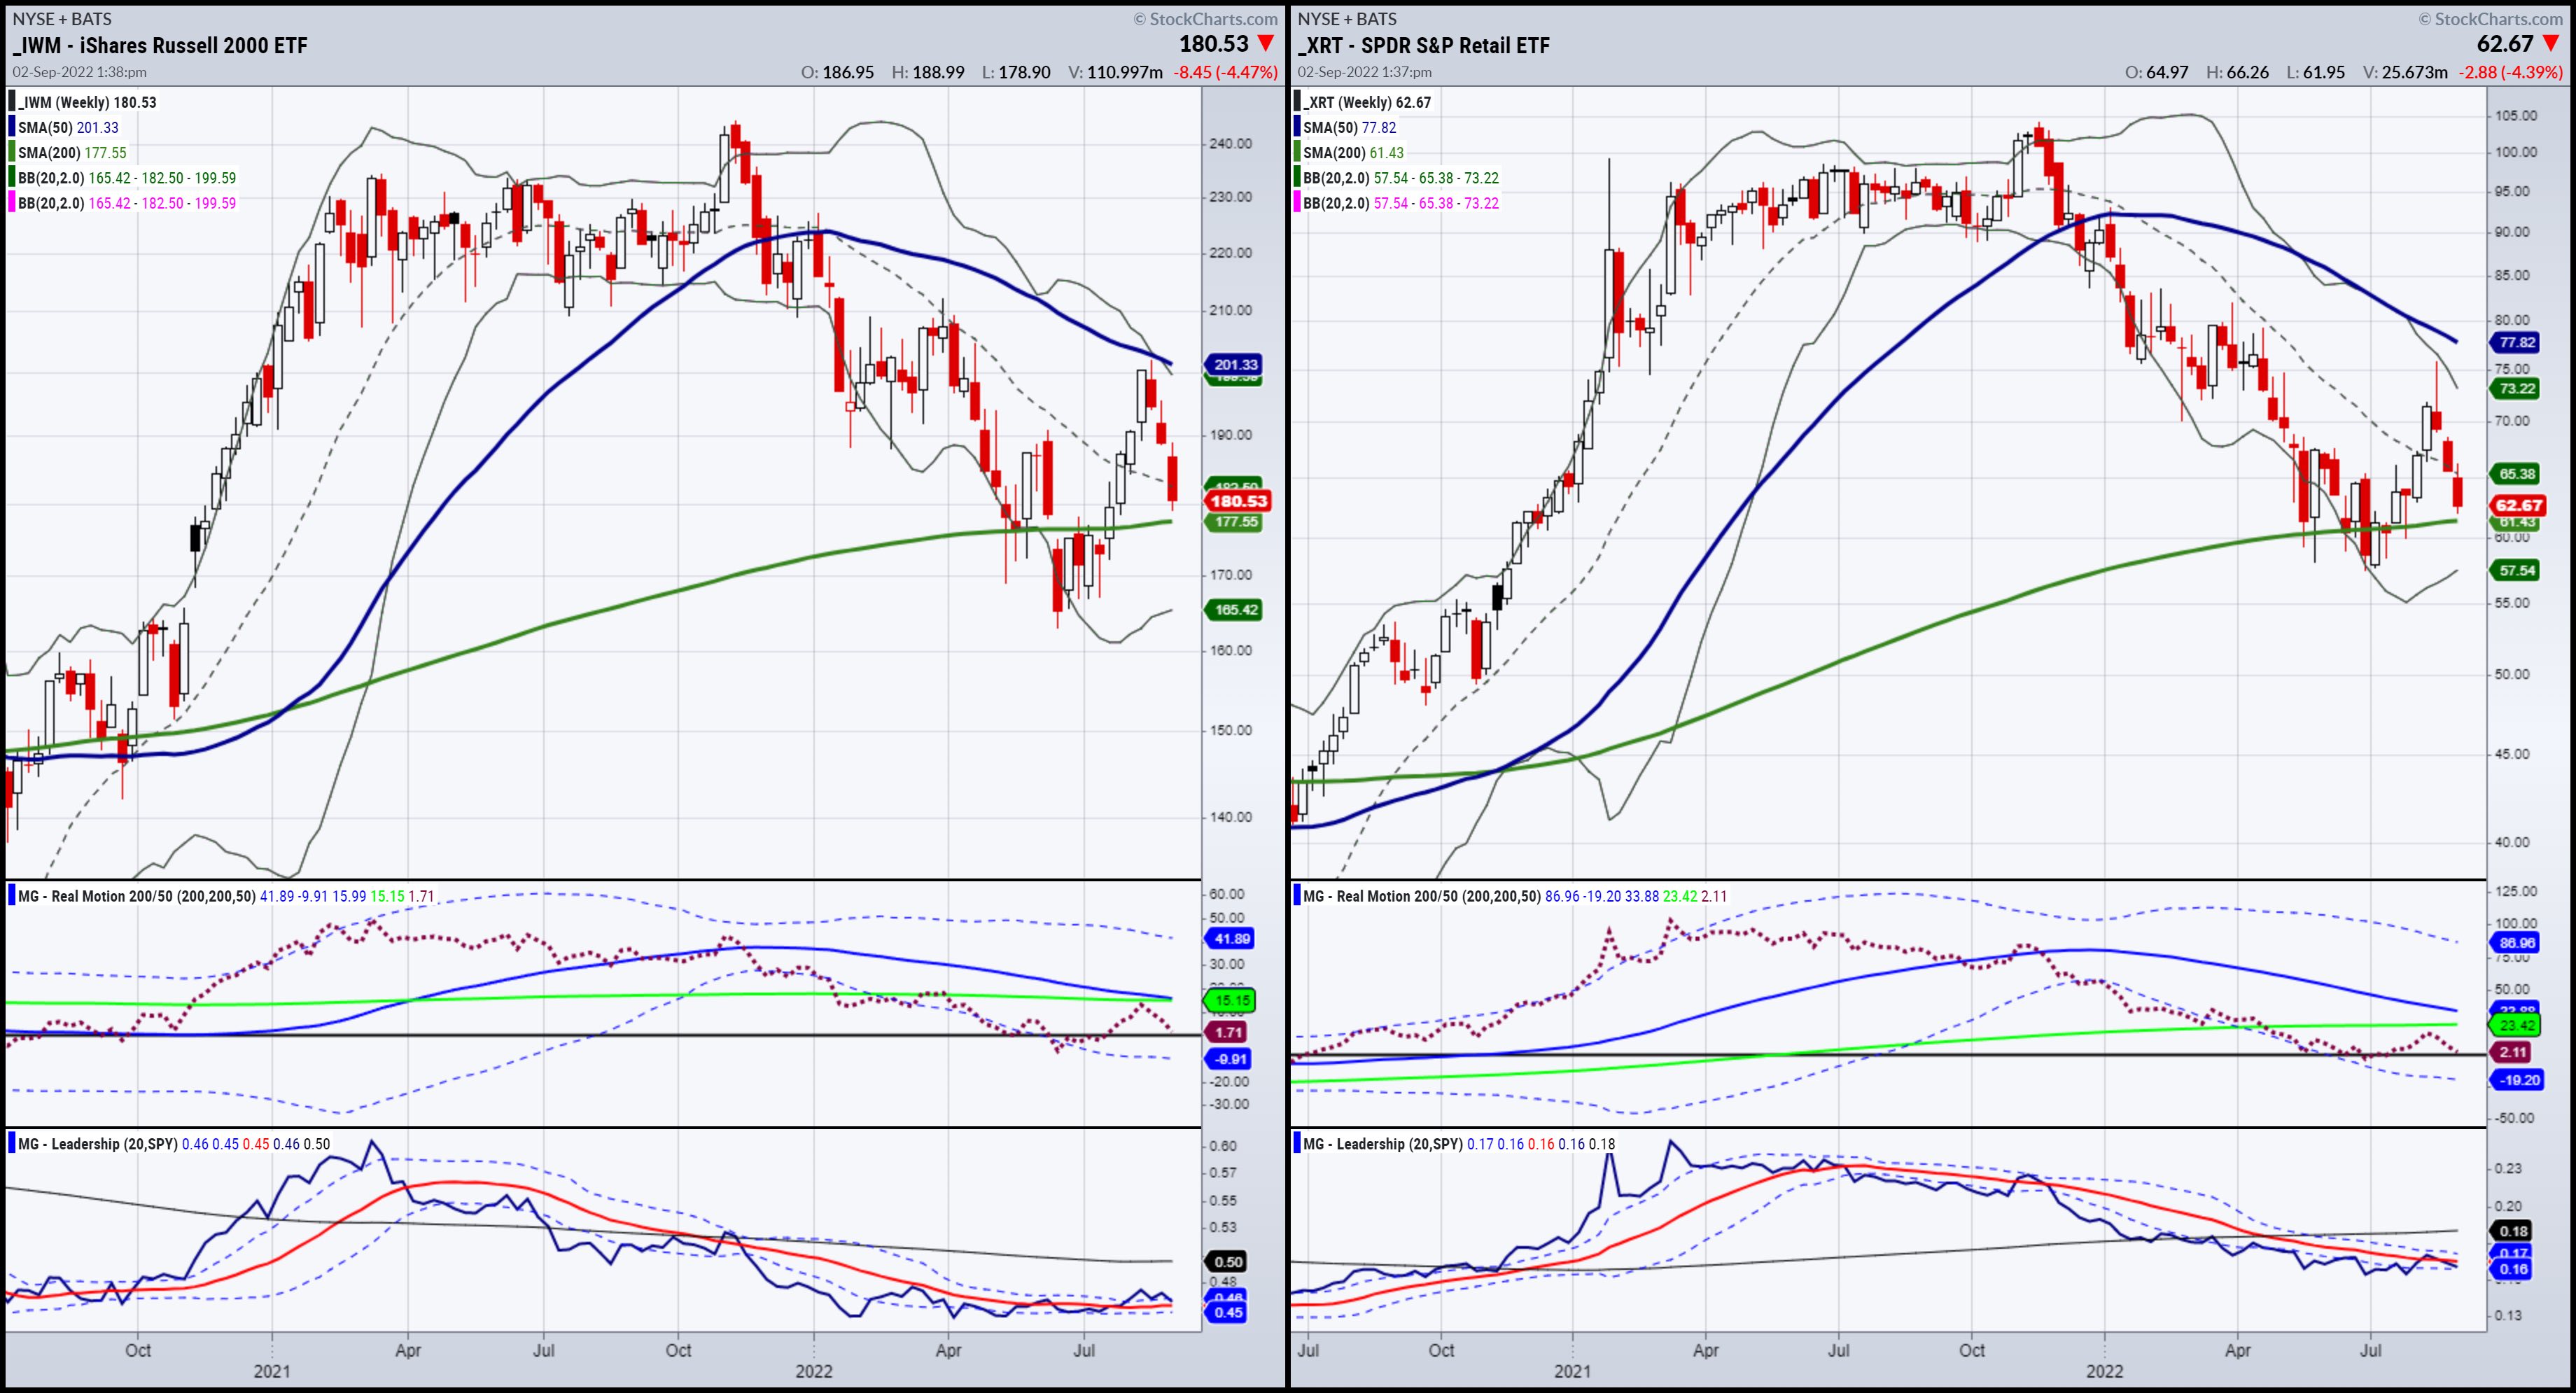
Mish's Daily Video: The Russell 2000, Retail and Transportation Tell a Story
In today's video, I'm going to introduce you to my favorite way to explain markets, price action and where the market might be headed, plus cover a few technicals with you. We will talk with three finance experts within our Modern Family to find out more....
READ MORE
MEMBERS ONLY
Questions That You MUST Ask
by Dave Landry,
Founder, Sentive Trading, LLC
On this week's edition of Trading Simplified, Dave shows his methodology in action by sharing a new mystery chart, then follows up on his "Next 100 Trade" series. For the "Mind the Trade" segment (trading psychology), he reiterates an important question that you must...
READ MORE
MEMBERS ONLY

The Direction of the Secular Trend Will Determine Whether the June Low Holds
by Martin Pring,
President, Pring Research
The big daddy of all market trends is the secular or very long-term one, and it's about to have a big influence as to whether the June low will hold, meaning prices are about to reach new all-time highs, or if we are going to return to a...
READ MORE
MEMBERS ONLY
What, Me Worry?
by Erin Swenlin,
Vice President, DecisionPoint.com
In yesterday's DecisionPoint Trading Room (airs 3p ET), Carl took a close look at the VIX over the years. We discussed last week in our DecisionPoint Alert subscriber blog that sentiment simply wasn't THAT bearish yet. This chart really reflects what we're talking about....
READ MORE
MEMBERS ONLY
Sector Spotlight: Weak Sector Rotation Puts $SPX on Track for 3900
by Julius de Kempenaer,
Senior Technical Analyst, StockCharts.com
In this week's edition of StockCharts TV's Sector Spotlight, I look at seasonality and try to align the theoretical expectations for the relative performance of sectors against the S&P 500 going into September with the current reality as it is playing out on the...
READ MORE
