MEMBERS ONLY

Sector Spotlight: Weak Sector Rotation Puts $SPX on Track for 3900

by Julius de Kempenaer,
Senior Technical Analyst, StockCharts.com
In this week's edition of StockCharts TV's Sector Spotlight, I look at seasonality and try to align the theoretical expectations for the relative performance of sectors against the S&P 500 going into September with the current reality as it is playing out on the...
READ MORE
MEMBERS ONLY

Mish's Daily Video: Why Watch the Transportation Sector
I have created a video recap for today's daily; the link to watch is below.
Transportation stocks are an excellent measure of industrial and manufacturing strength and supply and demand. In this video, I discuss the Transport (IYT) ETF, which is a good indicator of economic health, as...
READ MORE
MEMBERS ONLY

DP Trading Room: Dividend Investing

by Erin Swenlin,
Vice President, DecisionPoint.com

by Carl Swenlin,
President and Founder, DecisionPoint.com
On this week's edition of The DecisionPoint Trading Room, Carl opens things with a discussion regarding the benefits of dividend investing, particularly if/when we finally begin to see an end to the current bear market conditions. He gives us his perspective on today's market action...
READ MORE
MEMBERS ONLY

Improving Odds by Focusing on ETFs with Leading Uptrends

by Arthur Hill,
Chief Technical Strategist, TrendInvestorPro.com
Traders can improve the odds of success by focusing on ETFs in leading uptrends. TrendInvestorPro identifies such ETFs with a table that shows Trend Composite signals and the 52-week range indicator. These ETFs are then singled out for chart analysis and we are featuring the DB Energy ETF (DBE) today....
READ MORE
MEMBERS ONLY

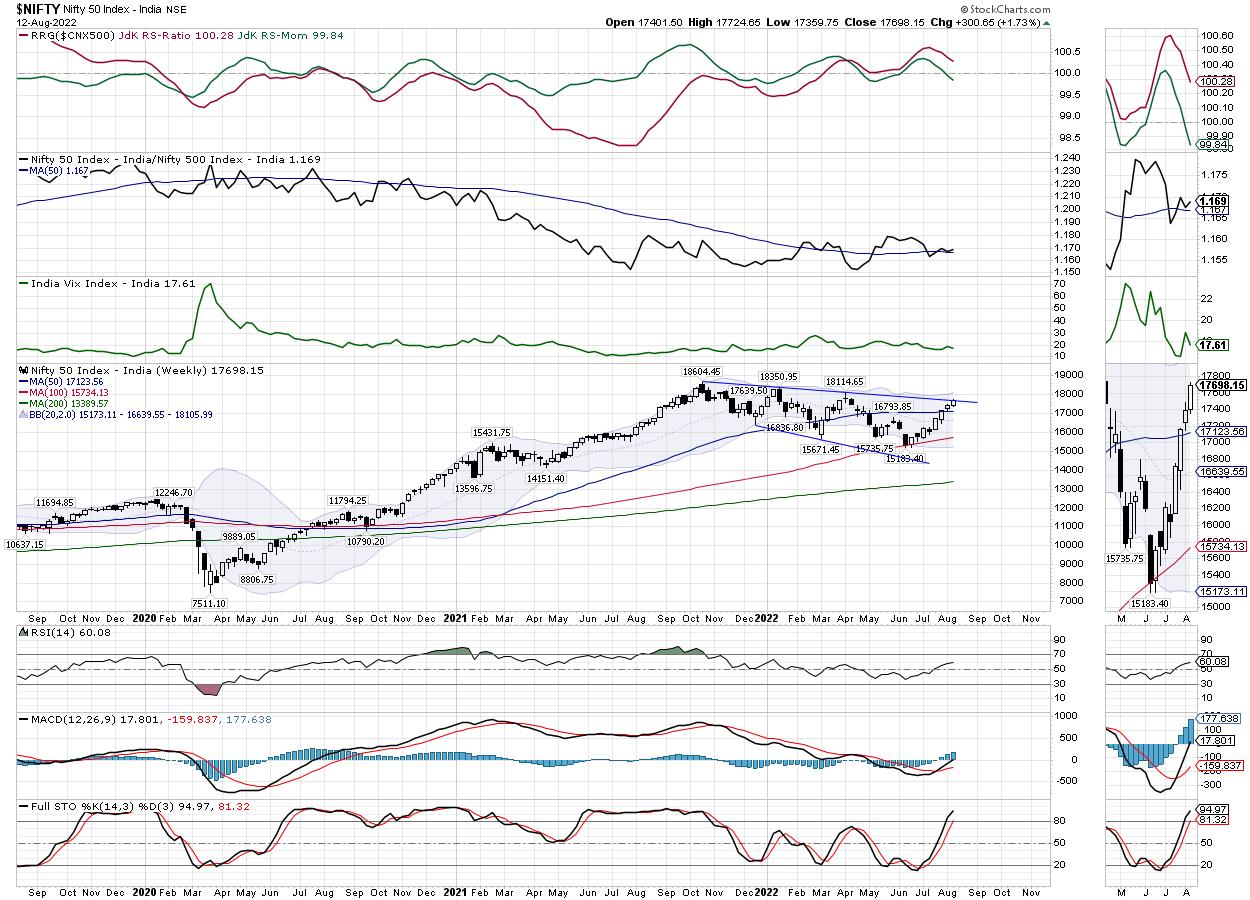
Week Ahead: NIFTY Likely to See Shaky Start to Truncated Week; Stay Highly Selective in Your Approach

by Milan Vaishnav,
Founder and Technical Analyst, EquityResearch.asia and ChartWizard.ae
The week that went by fared very much on the expected lines. In the previous technical note, it was mentioned that, given the unabated up-move in the markets for a couple of weeks, perhaps it was time that the markets take a breather. In the week before this one, the...
READ MORE
MEMBERS ONLY
S&P 500 Has Broken Below Key Level - Here's What to Watch For Going Forward

by Mary Ellen McGonagle,
President, MEM Investment Research
Fed Chair Powell's comments today that bringing down prices "is likely to require a sustained period of below-trend growth and an increase in unemployment" brought the markets to its knees. The remarks increased fears of a prolonged rate-hike cycle which, in turn, pushed stocks sharply lower....
READ MORE
MEMBERS ONLY

MEM TV: Volatility Spikes As Markets Break Down
by Mary Ellen McGonagle,
President, MEM Investment Research
On this week's edition of StockCharts TV'sThe MEM Edge, Mary Ellen shares a key level that was broken in the S&P 500, as well as what to be on the lookout for going forward. She also reviews stocks that are bucking the downtrend and...
READ MORE
MEMBERS ONLY

Making Sense of Mass Hysteria

by David Keller,
President and Chief Strategist, Sierra Alpha Research
Friday's sudden 3-4% drop felt like a wake-up call of sorts. At least it did for me, as I remained bearish through much of the recent rally phase. How could the market rally given all the macro headwinds -- inflationary pressures, higher interest rates, a hawkish Fed?
Tony...
READ MORE
MEMBERS ONLY
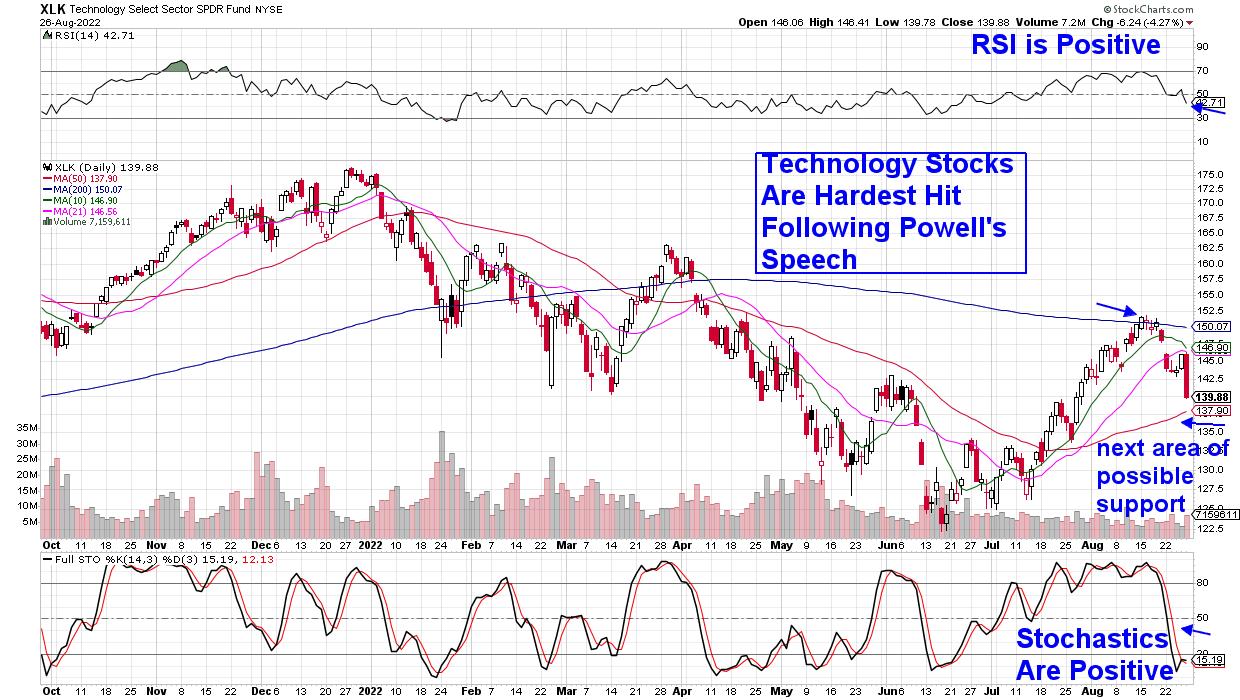
Powell: Inflation is Public Enemy #1 to the Stock Market
The Economic Modern Family tells us the macro story, and the charts are warning us. The indices and sectors closed the week lower and very stressed out.
The speech by Fed Chair Powell on Friday clarified what some did not want to believe, while others knew and were prepared for:...
READ MORE
MEMBERS ONLY

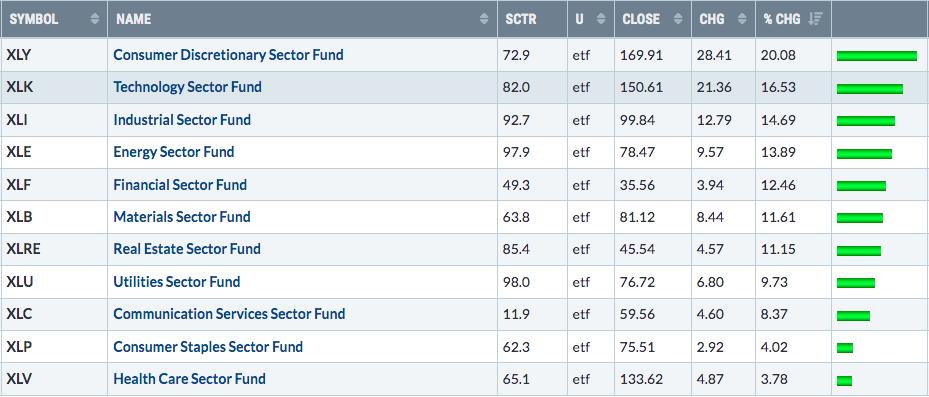
Don't Even Think About Buying... (This Sector)
by Julius de Kempenaer,
Senior Technical Analyst, StockCharts.com
Staying out of a sector can be as important as being in the right sector. This is particularly true for the Communication Services Sector, and has been for a long time already.
The Relative Rotation Graph above shows the rotation over the last 30 weeks, starting the week of 1/...
READ MORE
MEMBERS ONLY

STOCKS SELL OFF ON HAWKISH FED -- MAJOR DOWNTREND IS STILL INTACT

by John Murphy,
Chief Technical Analyst, StockCharts.com
STOCKS SELL OFF FOLLOWING POWELL SPEECH... A modest rally attempt was turned back pretty decisively today following a speech by Fed chief Powell that sounded more hawkish than the market was expecting. Friday's heavy selling also reinforced the view expressed last Friday that the summer rally in stocks...
READ MORE
MEMBERS ONLY

Running Up into Resistance

by TG Watkins,
Director of Stocks, Simpler Trading
Jerome Powell speaks at Jackson Hole later today. If he is somewhat dovish, TG wonders, will the market pop a little? But that pop might be into some major resistance.
On this week's edition of Moxie Indicator Minutes, TG talks about how the Moxie Indicator is telling us...
READ MORE
MEMBERS ONLY
Here are the Two Industry Groups We Need to Watch Closely

by Tom Bowley,
Chief Market Strategist, EarningsBeats.com
It's no secret that I've turned very bullish. I stuck my neck out and made my bullish call on June 16th -- right at the bottom. I've seen absolutely nothing to change my mind since that bottom. The biggest question to me is whether...
READ MORE
MEMBERS ONLY

Stocks at a Crossroad

by Bruce Fraser,
Industry-leading "Wyckoffian"
Determining the stride of an uptrend or downtrend is an essential Wyckoff technique. The stride of a trend is often set early in that trend and then prices can adhere to that pace of advance or decline for the majority of the bull or bear run. Trend determination techniques have...
READ MORE
MEMBERS ONLY

GNG TV: Cross Asset Trends as the Summer Ends

by Alex Cole,
Co-founder, GoNoGo Charts®

by Tyler Wood,
Co-founder, GoNoGo Charts®
In this week's edition of the GoNoGo Charts show, Alex and Tyler review the important macro forces influencing equity performance this week. As rising rates resume and the dollar churns higher, short-term headwinds for risk assets deliver consolidation within our recent "Go" trend. The blended weight...
READ MORE
MEMBERS ONLY

MACD Trading Technique in Multiple Timeframes

by Joe Rabil,
President, Rabil Stock Research
On this week's edition of Stock Talk with Joe Rabil, Joe explains how he learned to trade in multiple timeframes. He shows how the simplicity of MACD can be a great launching pad for understanding multiple timeframe confluence. Joe then covers the stock requests that came through this...
READ MORE
MEMBERS ONLY
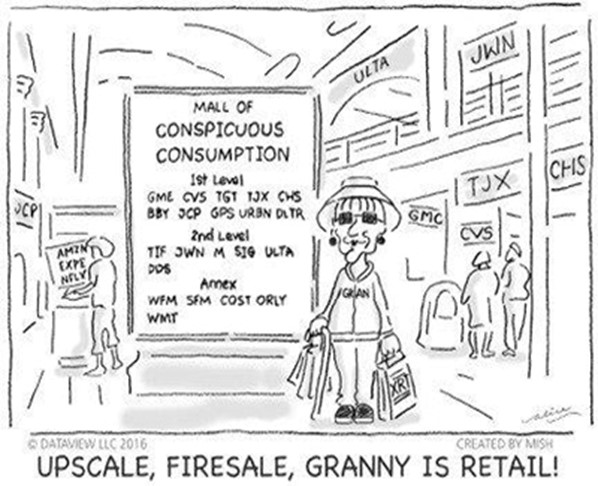
Mish's Daily Video: Granny Retail -- Can the Consumer Hang in There?
I have created another video recap for today's Daily. The link to watch is below. The focus is on our Grandma of the Economic Modern Family -- Granny Retail. I use the ETF XRT as the benchmark.
XRT is the largest retail ETF, but not the only one...
READ MORE
MEMBERS ONLY

Conditions That Influence Your Trades

by Dave Landry,
Founder, Sentive Trading, LLC
On this week's edition of Trading Simplified, Dave continues his "Next 100 Trades" series by showing a mystery chart for his next trade and following up on recent trades, warts and all. He then continues his "Mind The Trade" (trading psychology) segment. This week,...
READ MORE
MEMBERS ONLY

Energy Gets a New Lease on Life

by Martin Pring,
President, Pring Research
Back in June, I wrote an article entitled Are Commodities Losing their Mojo?It drew attention to the fact that some long-term indicators were pointing to at least a temporarypull-back in prices. That process is already underway, but the article also pointed out that energy usually lags other industrial commodity...
READ MORE
MEMBERS ONLY
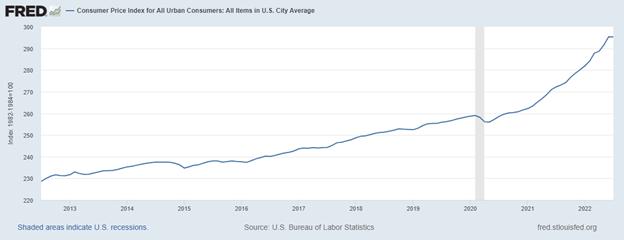
Mish's Daily: Grain Prices Suggest Inflation Far From Peaking
The chart above is the Consumer Price Index for All Urban Consumers, and reflects that inflation is historically high. The Fed has been trying to get a handle on the inflation problem, but the graph seems to illustrate that inflation may not be contained.
The Fed has had to act....
READ MORE
MEMBERS ONLY
Sector Spotlight: Rotation to Utilities Signals Caution for S&P 500
by Julius de Kempenaer,
Senior Technical Analyst, StockCharts.com
In this week's edition of StockCharts TV's Sector Spotlight, I share my thoughts on potential developments for the S&P 500. First, from an asset allocation perspective, I focus on the development of the USD and interest rates in relation to the stock market. Then,...
READ MORE
MEMBERS ONLY

Using Options-Related Weakness To Find Excellent Trades
by Tom Bowley,
Chief Market Strategist, EarningsBeats.com
I alerted EarningsBeats.com members to the probability of short-term weakness at the start of options expiration week last Monday. There are plenty of short-term inefficiencies in the stock market and none are bigger than the manipulation around options-expiration week. It's the primary reason why the S&...
READ MORE
MEMBERS ONLY
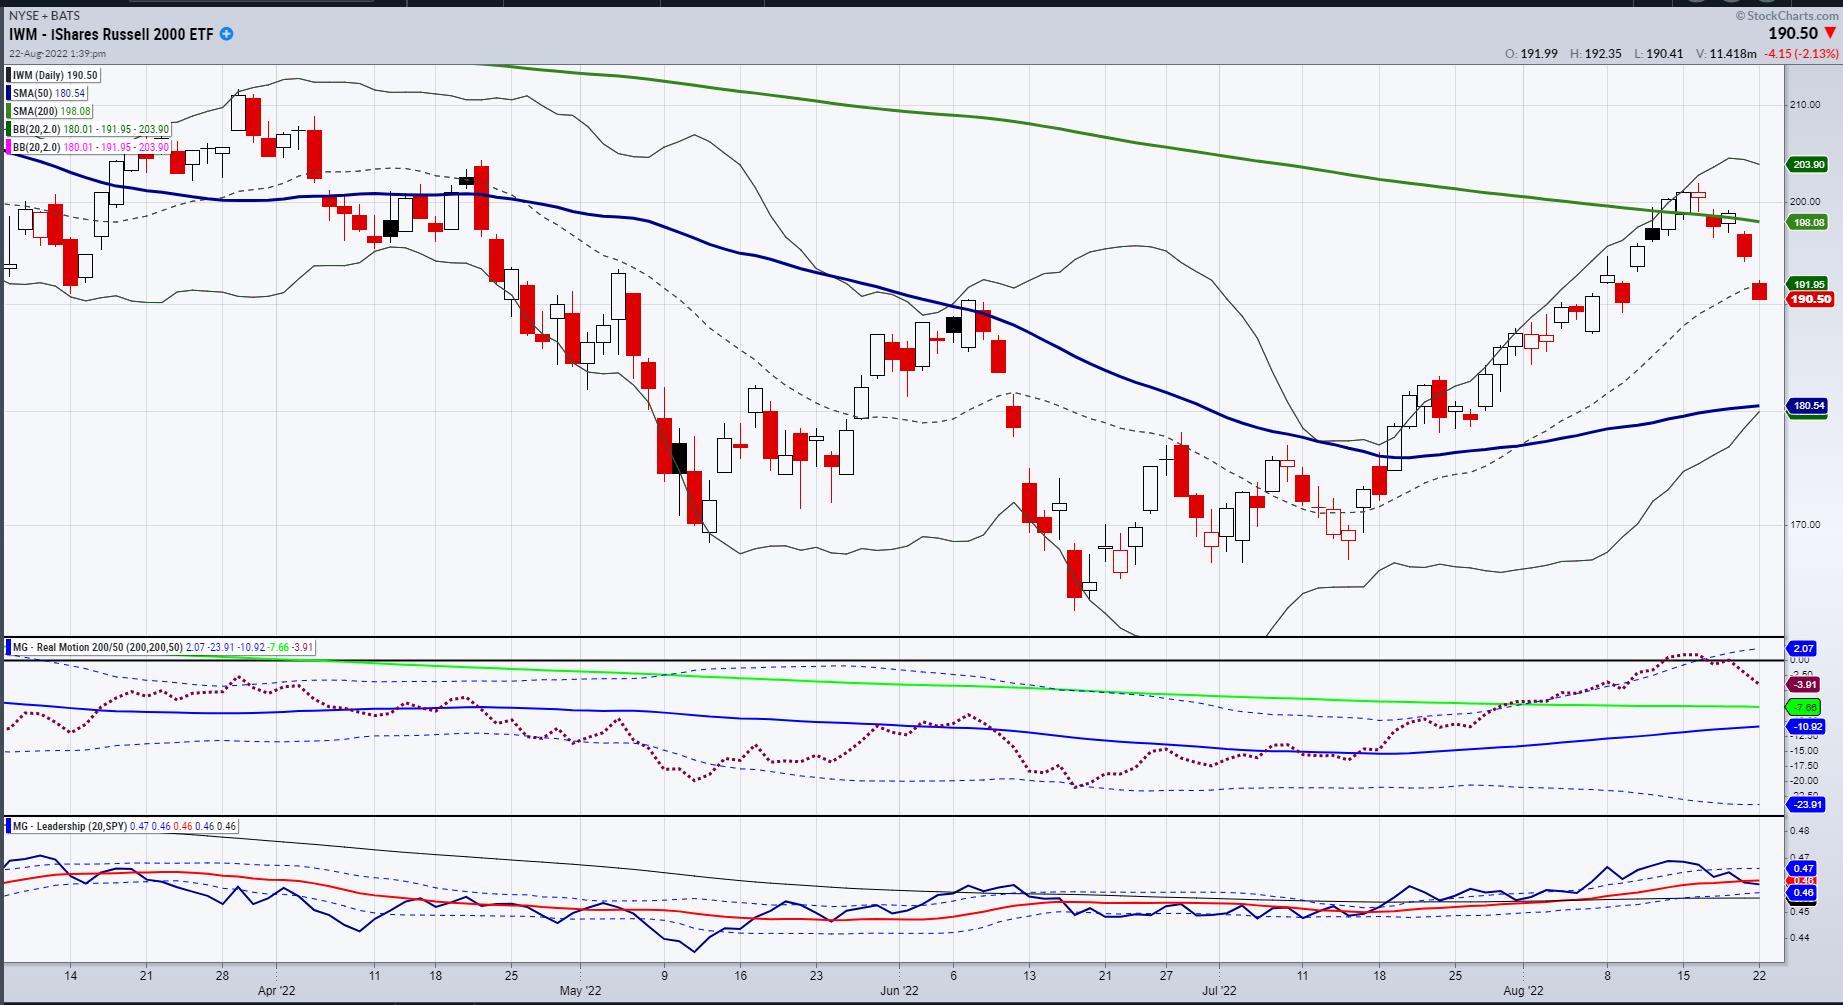
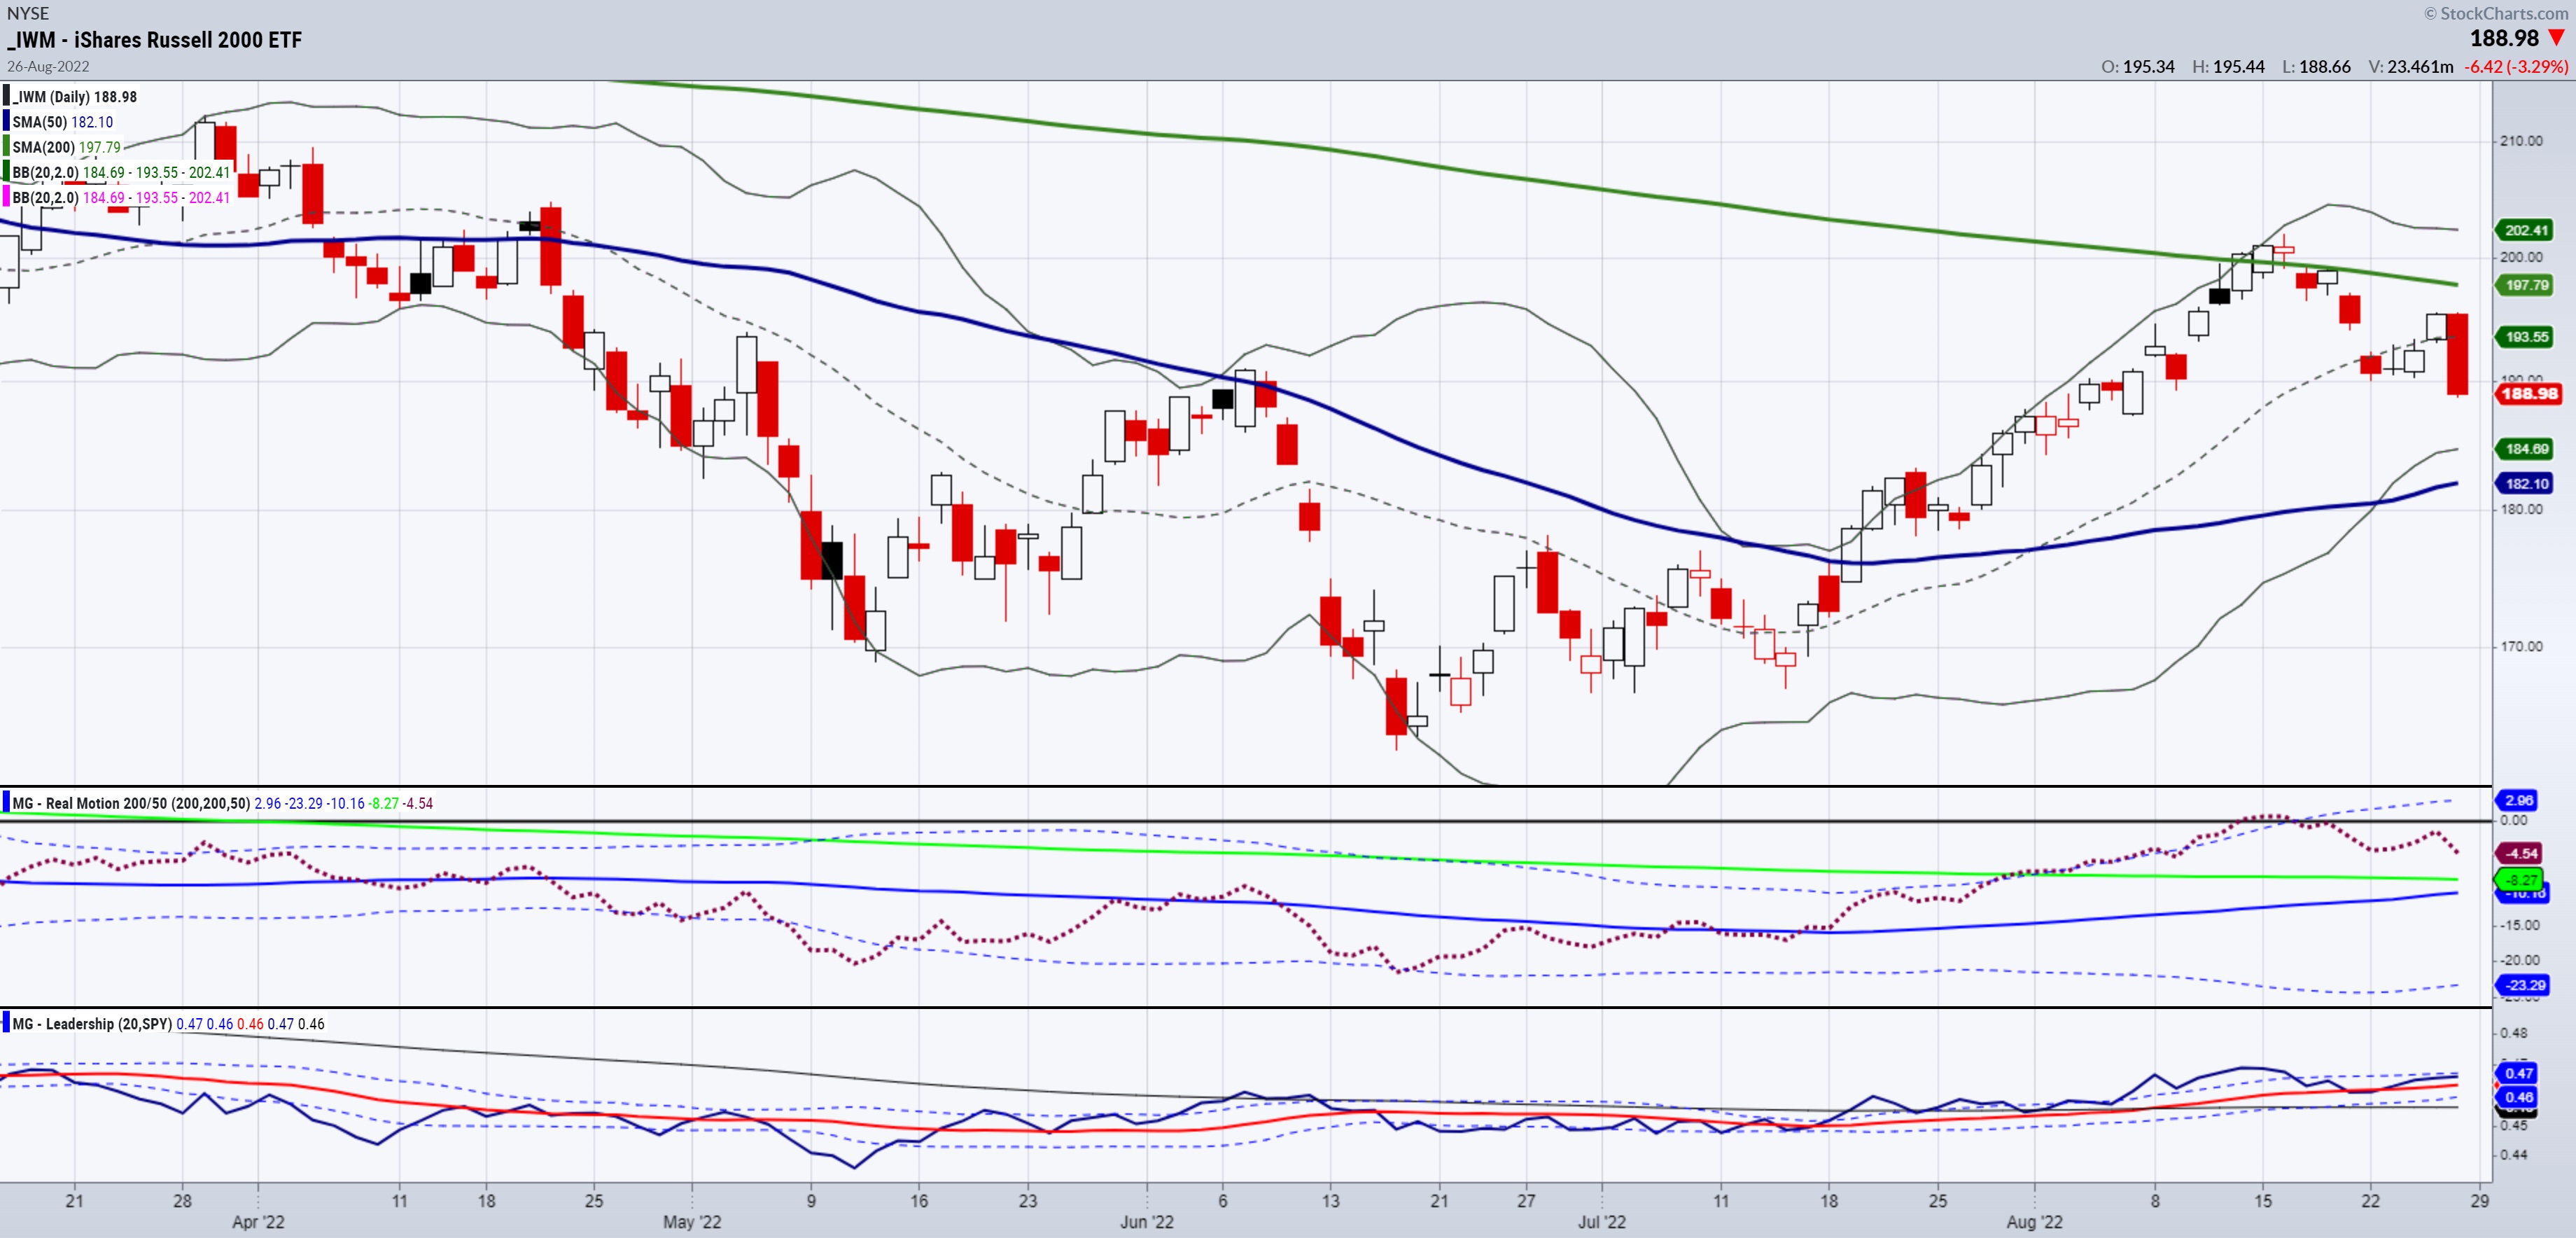
Mish's Daily: Granddad Russell 2000 and His Best Friend
Now that I am back from vacation, I thought we would mix it up for you all and do the Daily as a video a couple of times per week, so that I can explain the charts in more detail and speak directly to all of you. We will continue...
READ MORE
MEMBERS ONLY
DP Trading Room: DP Indicators Called It!
by Erin Swenlin,
Vice President, DecisionPoint.com
by Carl Swenlin,
President and Founder, DecisionPoint.com
On this week's edition of The DecisionPoint Trading Room, Carl opens this week's show by covering the major markets and asset classes. He reviews the mega-cap stocks that are leading the market lower. DP indicators came through on warning that there was trouble ahead; Carl explains...
READ MORE
MEMBERS ONLY
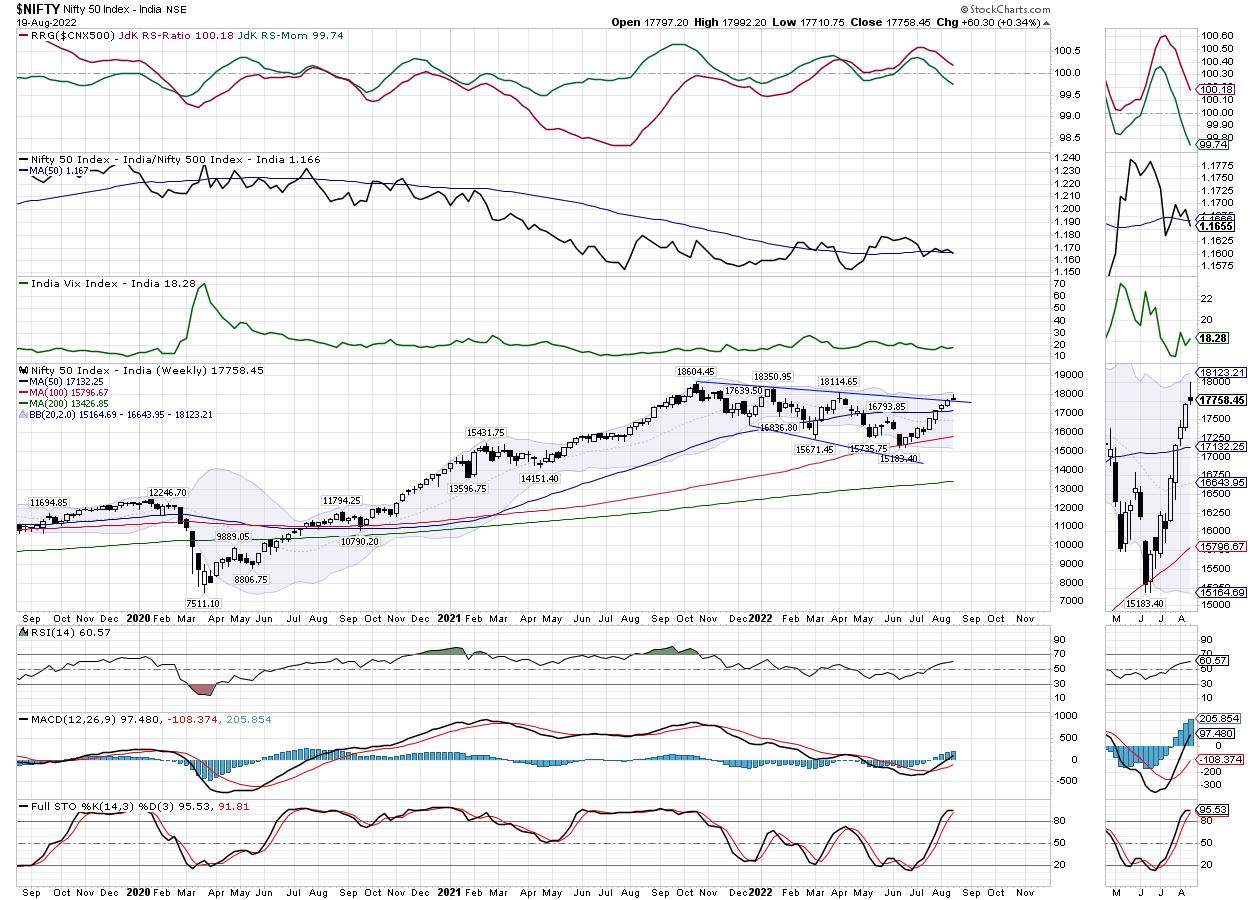
Week Ahead: NIFTY Stares at Potential Stalling of Rally; Upsides (If Any) to Stay Capped at This Level
by Milan Vaishnav,
Founder and Technical Analyst, EquityResearch.asia and ChartWizard.ae
After continuing to rise in an unabated manner for three sessions out of four in the truncated week, the Indian equity markets managed to end the week on a positive note, but also witnessed a sharp profit-taking bout in the last trading session. The markets began the week a bit...
READ MORE
MEMBERS ONLY

Five Decades Of Personal Stock Market Passages, Tools, Lessons And Stories: Part 1

by Gatis Roze,
Author, "Tensile Trading"
Successful investing calls for much the same prerequisites as those required to become a professional athlete. Fortunately, we investors have a much longer shelf life than pro athletes. Here's how I took advantage of this reality.
Maturing as an investor does not automatically mean you are becoming a...
READ MORE
MEMBERS ONLY

I'm Calling the Top in the S&P 500
by David Keller,
President and Chief Strategist, Sierra Alpha Research
A key breadth indicator, which has indicated every swing top thus far in 2022, generated another sell signal on Friday.
By the way, in case you're wondering, today's title is a direct reference to my friend Tom Bowley's quite well-timed show on StockCharts TV,...
READ MORE
MEMBERS ONLY
MEM TV: Is It Time to Get Defensive?
by Mary Ellen McGonagle,
President, MEM Investment Research
In this special presentation courtesy of StockCharts TV'sThe MEM Edge, Mary Ellen reviews last week's stalling action in the broader markets, as well as the rotation into more defensive areas. She also highlights 2 key metrics to pay close attention to determine if it's...
READ MORE
MEMBERS ONLY

Combining RRG with the Turtle Soup Scan is Now More Powerful
by Julius de Kempenaer,
Senior Technical Analyst, StockCharts.com
Since my introductory article on the topic, 2018's "Combining Relative Rotation Graphs and the "Turtle Soup" setup", I have mentioned and used this strategy a few times in my articles and analyses. The main goal has been to combine the power of RRG and...
READ MORE
MEMBERS ONLY

Quantifying the Battle for the 200-day – It's Elementary
by Arthur Hill,
Chief Technical Strategist, TrendInvestorPro.com
The S&P 500 SPDR (SPY) surged to its falling 200-day SMA here in August and even edged above this key level intraday on Tuesday. Even though the ETF is close to crossing above the 200-day, chartists would be better off taking a step back to avoid a whipsaw....
READ MORE
MEMBERS ONLY

S&P 500 MEETS RESISTANCE AT ITS 200-DAY MOVING AVERAGE AS BOND YIELDS REBOUND -- SUMMER STOCK RALLY HAS REACHED CRITICAL JUNCTURE AS IT TESTS MAJOR RESISTANCE LINES
by John Murphy,
Chief Technical Analyst, StockCharts.com
S&P 500 STALLS AT 200-DAY AVERAGE...The two month rally in stocks has run into a couple of formidable resistance lines while in an overbought condition. Last week's message showed the S&P 500 nearing a test of its 200-day moving average and a falling...
READ MORE
MEMBERS ONLY
Looking at Topping Patterns
by TG Watkins,
Director of Stocks, Simpler Trading
On this week's edition of Moxie Indicator Minutes, TG discusses how the market has been on a bullish streak for several weeks now and run into several overhead MAs that will probably be resistance. This doesn't mean that the market has to fall apart right away...
READ MORE
MEMBERS ONLY
4 Signs to Anticipate a Reversal
by Joe Rabil,
President, Rabil Stock Research
On this week's edition of Stock Talk with Joe Rabil, Joe shows 4 patterns that can be helpful in looking for a reversal when a trend still appears to be in place. He shows the different patterns, along with Moving Average and MACD configuration. Since there were lots...
READ MORE
MEMBERS ONLY
Continue to Learn from My Trades
by Dave Landry,
Founder, Sentive Trading, LLC
On this week's edition of Trading Simplified, Dave continues his "My Next 100 Trades" series with some trades and follows up on existing trades. He also touches upon nuances of trend following, stock selection, money management and the psychology of sticking with the methodology vs. the...
READ MORE
MEMBERS ONLY

Dollar Bull Market Due for an Intermediate Correction, But It's Not an Easy Call
by Martin Pring,
President, Pring Research
It's a Primary Bull Market for the Dollar
Chart 1 shows that the US Dollar Index is very much in a primary bull market, having violated a (dashed) secular down trendline a few months ago and, more recently, completed a 7-year rectangle formation. The green-shaded areas identify those...
READ MORE
MEMBERS ONLY
Sector Spotlight: End of Downtrend ≠ New Uptrend
by Julius de Kempenaer,
Senior Technical Analyst, StockCharts.com
In this week's edition of StockCharts TV's Sector Spotlight, I take a look at recent rotations in asset classes and sectors. The recent strength for stocks over bonds at asset class level is clear, but the rotational picture for the weekly and daily time frames is...
READ MORE
MEMBERS ONLY
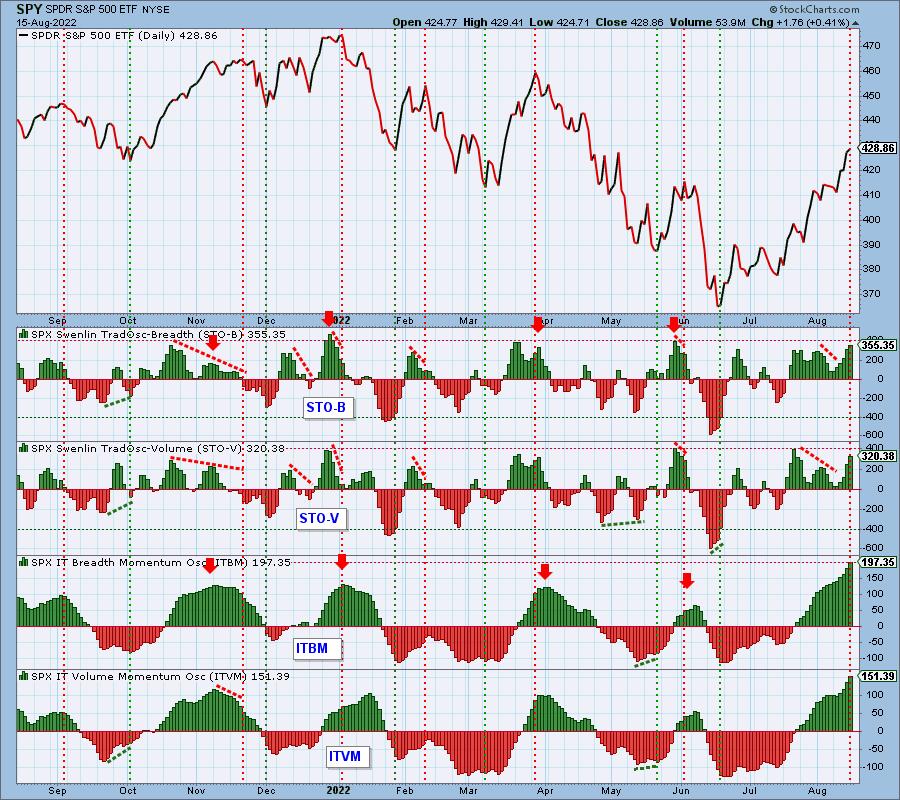
This Is What Overbought Looks Like
by Carl Swenlin,
President and Founder, DecisionPoint.com
It occurred to me that some of our primary indicators have created a teachable moment. Specifically, our short-term and intermediate-term indicators are both at fairly extreme overbought levels, and now is a good time to talk about what that means.
The Swenlin Trading Oscillators for breadth and volume (STO-B and...
READ MORE
MEMBERS ONLY
Zeroing In On Renewed Relative Strength
by Tom Bowley,
Chief Market Strategist, EarningsBeats.com
In the very near-term, we have options issues that could take a toll on key technology (XLK) and consumer discretionary (XLY) stocks. If those options issues kick in this week, the overall market is likely to struggle. That will definitely be one headwind as we start the new week. But...
READ MORE
MEMBERS ONLY
Week Ahead: Short Trading Week May Offer Nifty Resistance In This Zone; RRG Shows These Sectors Rolling Inside Leading Quadrant
by Milan Vaishnav,
Founder and Technical Analyst, EquityResearch.asia and ChartWizard.ae
The Indian equity markets had a definite directional move over the past five days; it practically nullified the potentially bearish setup that indicated a likely stalling of the present up-move as it trended during the week to end with gains. The markets saw themselves inching higher and opening up some...
READ MORE
MEMBERS ONLY
Is the Bear Market Really Over?
by Mary Ellen McGonagle,
President, MEM Investment Research
Last week's rally in the Nasdaq marked a 21% rise from its June 16th closing low and, according to widely-followed criteria, this signals the end of its bear market status. The gains occurred following news of a slight easing of inflation in July and, if we continue to...
READ MORE
