MEMBERS ONLY
Sectors Don't Look So Bad - "Bear Market Special" Coming to a Close!

by Erin Swenlin,
Vice President, DecisionPoint.com

by Carl Swenlin,
President and Founder, DecisionPoint.com
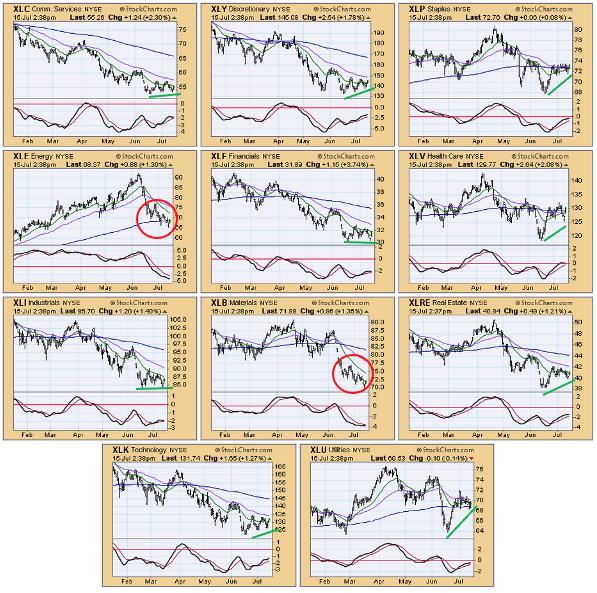
While we have negative long-term expectations for the market, we notice that most of the eleven S&P sectors are looking rather bullish intermediate-term. Only two sectors -- Energy and Materials -- have been making new lows, but the rest are either showing rising bottoms from the June low...
READ MORE
MEMBERS ONLY
Financials Rallied on Friday, But Is It Enough?

by David Keller,
President and Chief Strategist, Sierra Alpha Research
The top gainer in the S&P 500 index on Friday was Citigroup (C), up over 13% on a strong earnings report. So the chart is obviously bullish, right?
Not so fast.
It is very easy to get drawn into short-term signals like one-day price movements. But the trick...
READ MORE
MEMBERS ONLY

MEM TV: Earnings Season Starts with a Bang

by Mary Ellen McGonagle,
President, MEM Investment Research
On this episode of StockCharts TV'sThe MEM Edge, Mary Ellen reviews the rally in QCOM and other Semiconductor stocks as select Technology stocks begin to firm up. She also shares insights into top stocks due to report earnings next week.
This video was originally broadcast on July 15,...
READ MORE
MEMBERS ONLY

ONE VERSION OF YIELD CURVE INVERTS -- ANOTHER IS WEAKENING -- ENERGY SECTOR REMAINS WEAK

by John Murphy,
Chief Technical Analyst, StockCharts.com
TEN YEAR - TWO YEAR YIELD CURVE INVERTS... Chart 1 shows the spread between the ten year and two year Treasury yields falling below the zero line which signals an inverted yield curve. That means that the shorter two-year yield is now higher than the longer maturity ten-year yield. That...
READ MORE
MEMBERS ONLY

Inflation, Interest Rates and Chop

by TG Watkins,
Director of Stocks, Simpler Trading
On this week's edition of Moxie Indicator Minutes, TG discusses how inflation is higher than expected across the board and how, even though the market didn't like it, things managed to stay afloat. He then explores how there continues to be chop in the major indexes,...
READ MORE
MEMBERS ONLY

GNG TV: Open to All Outcomes

by Alex Cole,
Co-founder, GoNoGo Charts®

by Tyler Wood,
Co-founder, GoNoGo Charts®
GoNoGo Charts combine a broad scope of the most widely used technical indicators to provide a weight of the evidence perspective on Trend, Momentum, Volume and Volatility. Within the "NoGo" environment for equities, many investors have "anticipatory excitement" about the potential bottom in price and a...
READ MORE
MEMBERS ONLY

3 Criteria to Help You Avoid Losing Trades

by Joe Rabil,
President, Rabil Stock Research
On this week's edition of Stock Talk with Joe Rabil, Joe illustrates 3 criteria that will help to avoid losing trades. The current market environment is difficult, which means we need more strict criteria before investing. Joe explains how Moving Average slope, location and triggers can help. He...
READ MORE
MEMBERS ONLY
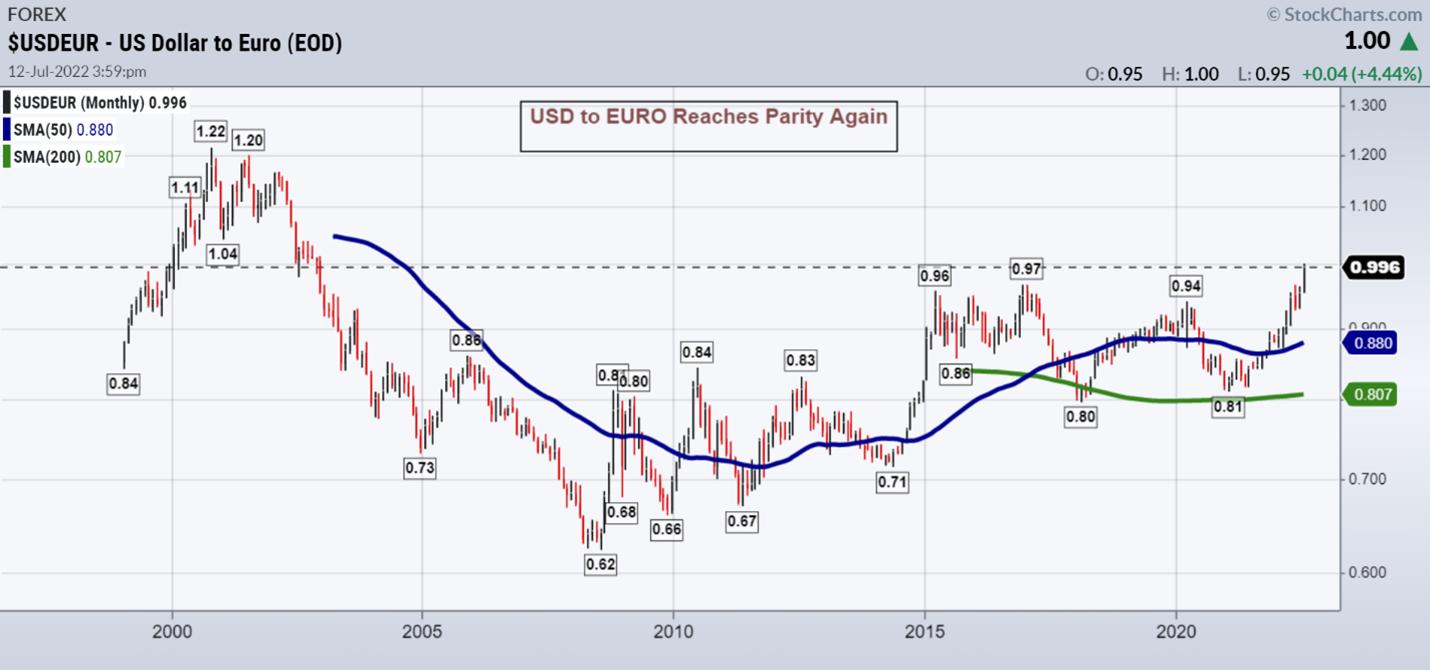
Mish's Daily: USD & EUR — Is This the Dollar's Last Hurrah?
US Dollar and Euro at Parity Again
Investors are flocking to the US Dollar as Europe braces for a potential energy crisis in the Fall. The euro has been under pressure recently, with investors pulling their money out in favor of the haven currency—the Dollar.
This is the first...
READ MORE
MEMBERS ONLY

Trading Psychology in a Nutshell

by Dave Landry,
Founder, Sentive Trading, LLC
On this week's edition of Trading Simplified, Dave continues his discussion of his methodology in action by revealing a mystery chart and walking viewers through the next two of his 100 trades. He then presents a brief update on his TFM 10% system, touches upon his money management...
READ MORE
MEMBERS ONLY

The Bears Have Lost Their Best Friend

by Tom Bowley,
Chief Market Strategist, EarningsBeats.com
Every day's action convinces me more that the bottom is in. I called it in mid-June and nothing has changed my mind. This morning we got the horrible inflation news (a bit of sarcasm). Here was a CNBC headline:
And if you'd like to spend some...
READ MORE
MEMBERS ONLY
Mish's Daily: Strengthen Your Portfolio with Real Assets
As we head into the second half of the year, it's essential to keep an eye on real assets. Real asset prices provide clues to what's happening in the global economy and can provide valuable insight. If commodity prices start to fall, it could indicate that...
READ MORE
MEMBERS ONLY

Sector Spotlight: Sector Rotation Model Says It's Not Over Yet

by Julius de Kempenaer,
Senior Technical Analyst, StockCharts.com
In this edition of StockCharts TV's Sector Spotlight, after an update on the current rotations for various asset classes, I look at the sector rotation model and and try to make an assessment on where, and which phase, we currently are in the market cycle. I evaluate the...
READ MORE
MEMBERS ONLY

Will the Bond Market Surprise Us?

by Martin Pring,
President, Pring Research
In late April, I wrote that bond yields had run into resistance and a pause in the on-going uptrend was likely. Yields on longer-dated maturities initially moved slightly higher, but are now at approximately the same level as that April article. However, more corrective activity appears likely, as commodities (e....
READ MORE
MEMBERS ONLY
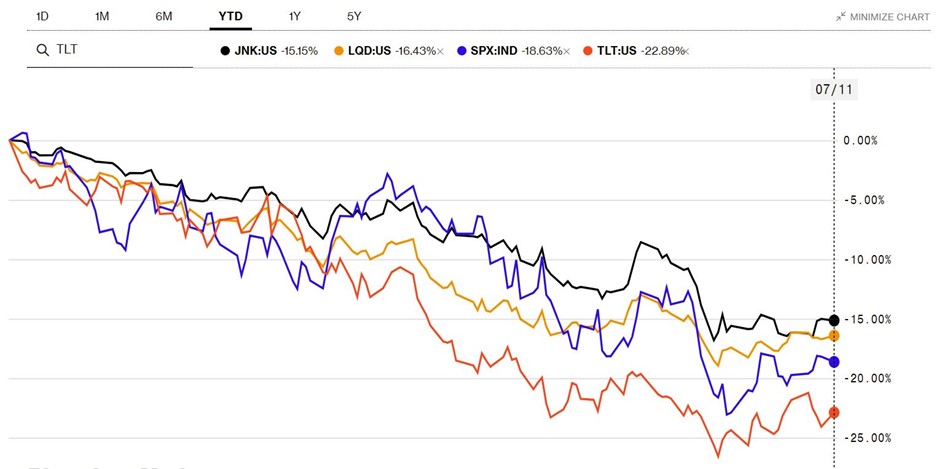
Mish's Daily: What are the Corporate Bond Markets Telling Us?
The two bond ETFs we've highlighted suggest something is brewing in the corporate credit market. Keep an eye on these two corporate bonds ETFs to stay ahead of the curve in the stock market.
Maybe you've heard that the high-yield market is in trouble, but is...
READ MORE
MEMBERS ONLY

The DP Trading Room: NVDA at a Buy Point?
by Erin Swenlin,
Vice President, DecisionPoint.com
by Carl Swenlin,
President and Founder, DecisionPoint.com
Carl and Erin present the premiere of StockCharts TV's new series, The DecisionPoint Trading Room! Carl takes questions on options, his favorite indicators and market trend following. Erin deep dives into Technology, Healthcare and Real Estate, plus covers symbol requests.
This video was originally recorded on July 11,...
READ MORE
MEMBERS ONLY
MarketGauge's Forecast: Profitable Investments During Stagflation
At MarketGauge, we believe we are in a stagflation period that could last six months to three years. Nevertheless, we continue to find profitable investments in this new regime.
Some of our forecasting can be traced directly to the war in Ukraine, so if the war ends tomorrow, our forecasts...
READ MORE
MEMBERS ONLY

STOCKS SHOW MODEST GAINS ON THE WEEK -- SECTOR BREADTH REMAINS WEAK -- COMMODITIES TEST SUPPORT LINES
by John Murphy,
Chief Technical Analyst, StockCharts.com
MAJOR STOCK INDEXES GAIN ON THE WEEK... Stocks saw modest gains on the week but not enough to disturb their major downtrend. Chart 1 shows the Dow Industrials gaining .77% for the week but remaining well below overhead resistance levels and moving average lines. Chart 2 shows the S&...
READ MORE
MEMBERS ONLY
Week Ahead: NIFTY's Consolidation Shouldn't Surprise Us; These Sectors Improving their Relative Performance

by Milan Vaishnav,
Founder and Technical Analyst, EquityResearch.asia and ChartWizard.ae
After taking a breather in the week before this one, the Indian equity markets resumed their up move. The headline index continued with its pullback and moved past a few important levels while protecting the key supports. Over the past five sessions, the markets remained largely in the upward rising...
READ MORE
MEMBERS ONLY
MEM TV: Growth Stocks Explode Higher!
by Mary Ellen McGonagle,
President, MEM Investment Research
On this episode of StockCharts TV'sThe MEM Edge, Mary Ellen reveals areas of growth that are on the move, as well as which groups have turned positive. She also shares best practices for building your watchlist so that you can take advantage of the new bull market.
This...
READ MORE
MEMBERS ONLY
What Happens if FAANGs Break Out?
by David Keller,
President and Chief Strategist, Sierra Alpha Research
Despite the long-term macro trends of higher interest rates, higher inflation and a hawkish Fed, growth stocks have managed to log some pretty decent gains in recent weeks.
I've spoken often on the importance of the FAANG stocksdue to their outsized influence on our very growth-oriented equity benchmarks....
READ MORE
MEMBERS ONLY
Markets Trying to Move Higher, But With Chop
by TG Watkins,
Director of Stocks, Simpler Trading
On this week's edition of Moxie Indicator Minutes, TG follows up on the PhD indicator theory, then discusses some paths for how the market could move higher. There are several names trending upward, but they sure aren't easy or smooth. While he can point out many...
READ MORE
MEMBERS ONLY
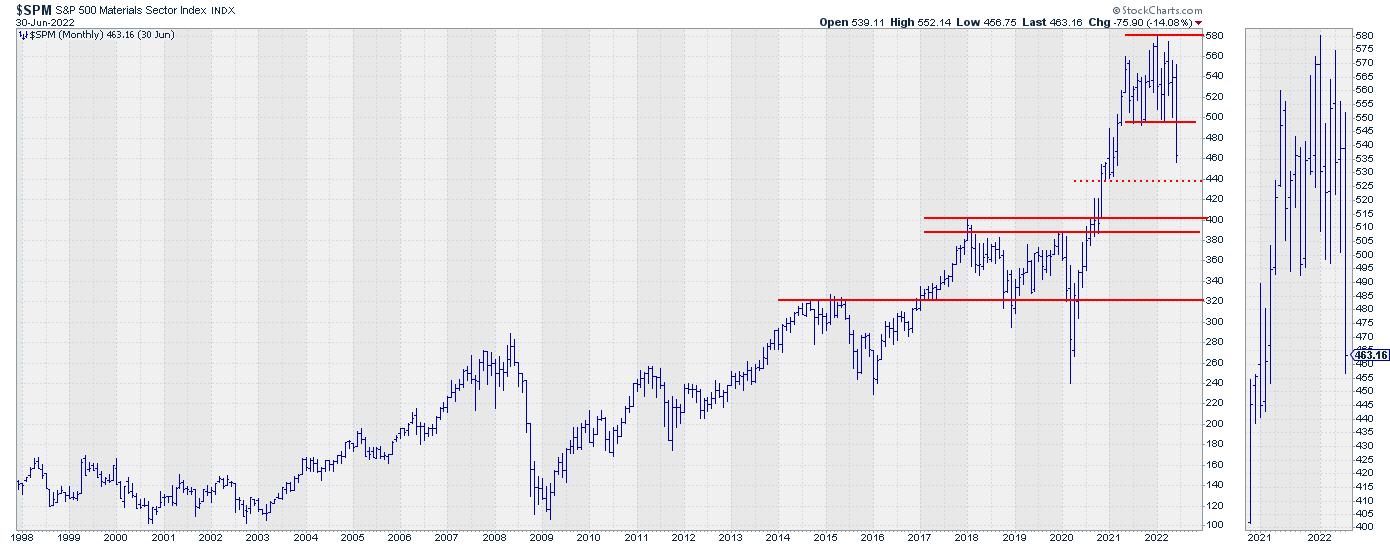
This Industry Group is Facing 60% Downside Risk
by Julius de Kempenaer,
Senior Technical Analyst, StockCharts.com
The chart above is the monthly chart for the materials sector $SPM, which I discussed in this week's episode of Sector Spotlight while going through the completed monthly charts for June.
Materials Sector Completing Big Top Formation
$SPM especially stands out, as the sector very clearly completed a...
READ MORE
MEMBERS ONLY
GNG TV: TP or Tech? Sysco vs. Cisco
by Tyler Wood,
Co-founder, GoNoGo Charts®
In this week's edition of the GoNoGo Charts show, Tyler looks at the nature of trends in defensive sectors through GoNoGo charts. Leading sectors include consumer staples and healthcare. Considering the ratio of SYY:CSCO, we can see through the GoNoGo Trend identifies that toilet paper is outpacing...
READ MORE
MEMBERS ONLY
1-2-3 Entry Signals
by Joe Rabil,
President, Rabil Stock Research
On this week's edition of Stock Talk with Joe Rabil, Joe shows the 3-5 different entry signals that can be taken based on your risk tolerance. He explains that, in most cases, you will have to pay higher prices for confirmation of a shift in trend. He also...
READ MORE
MEMBERS ONLY
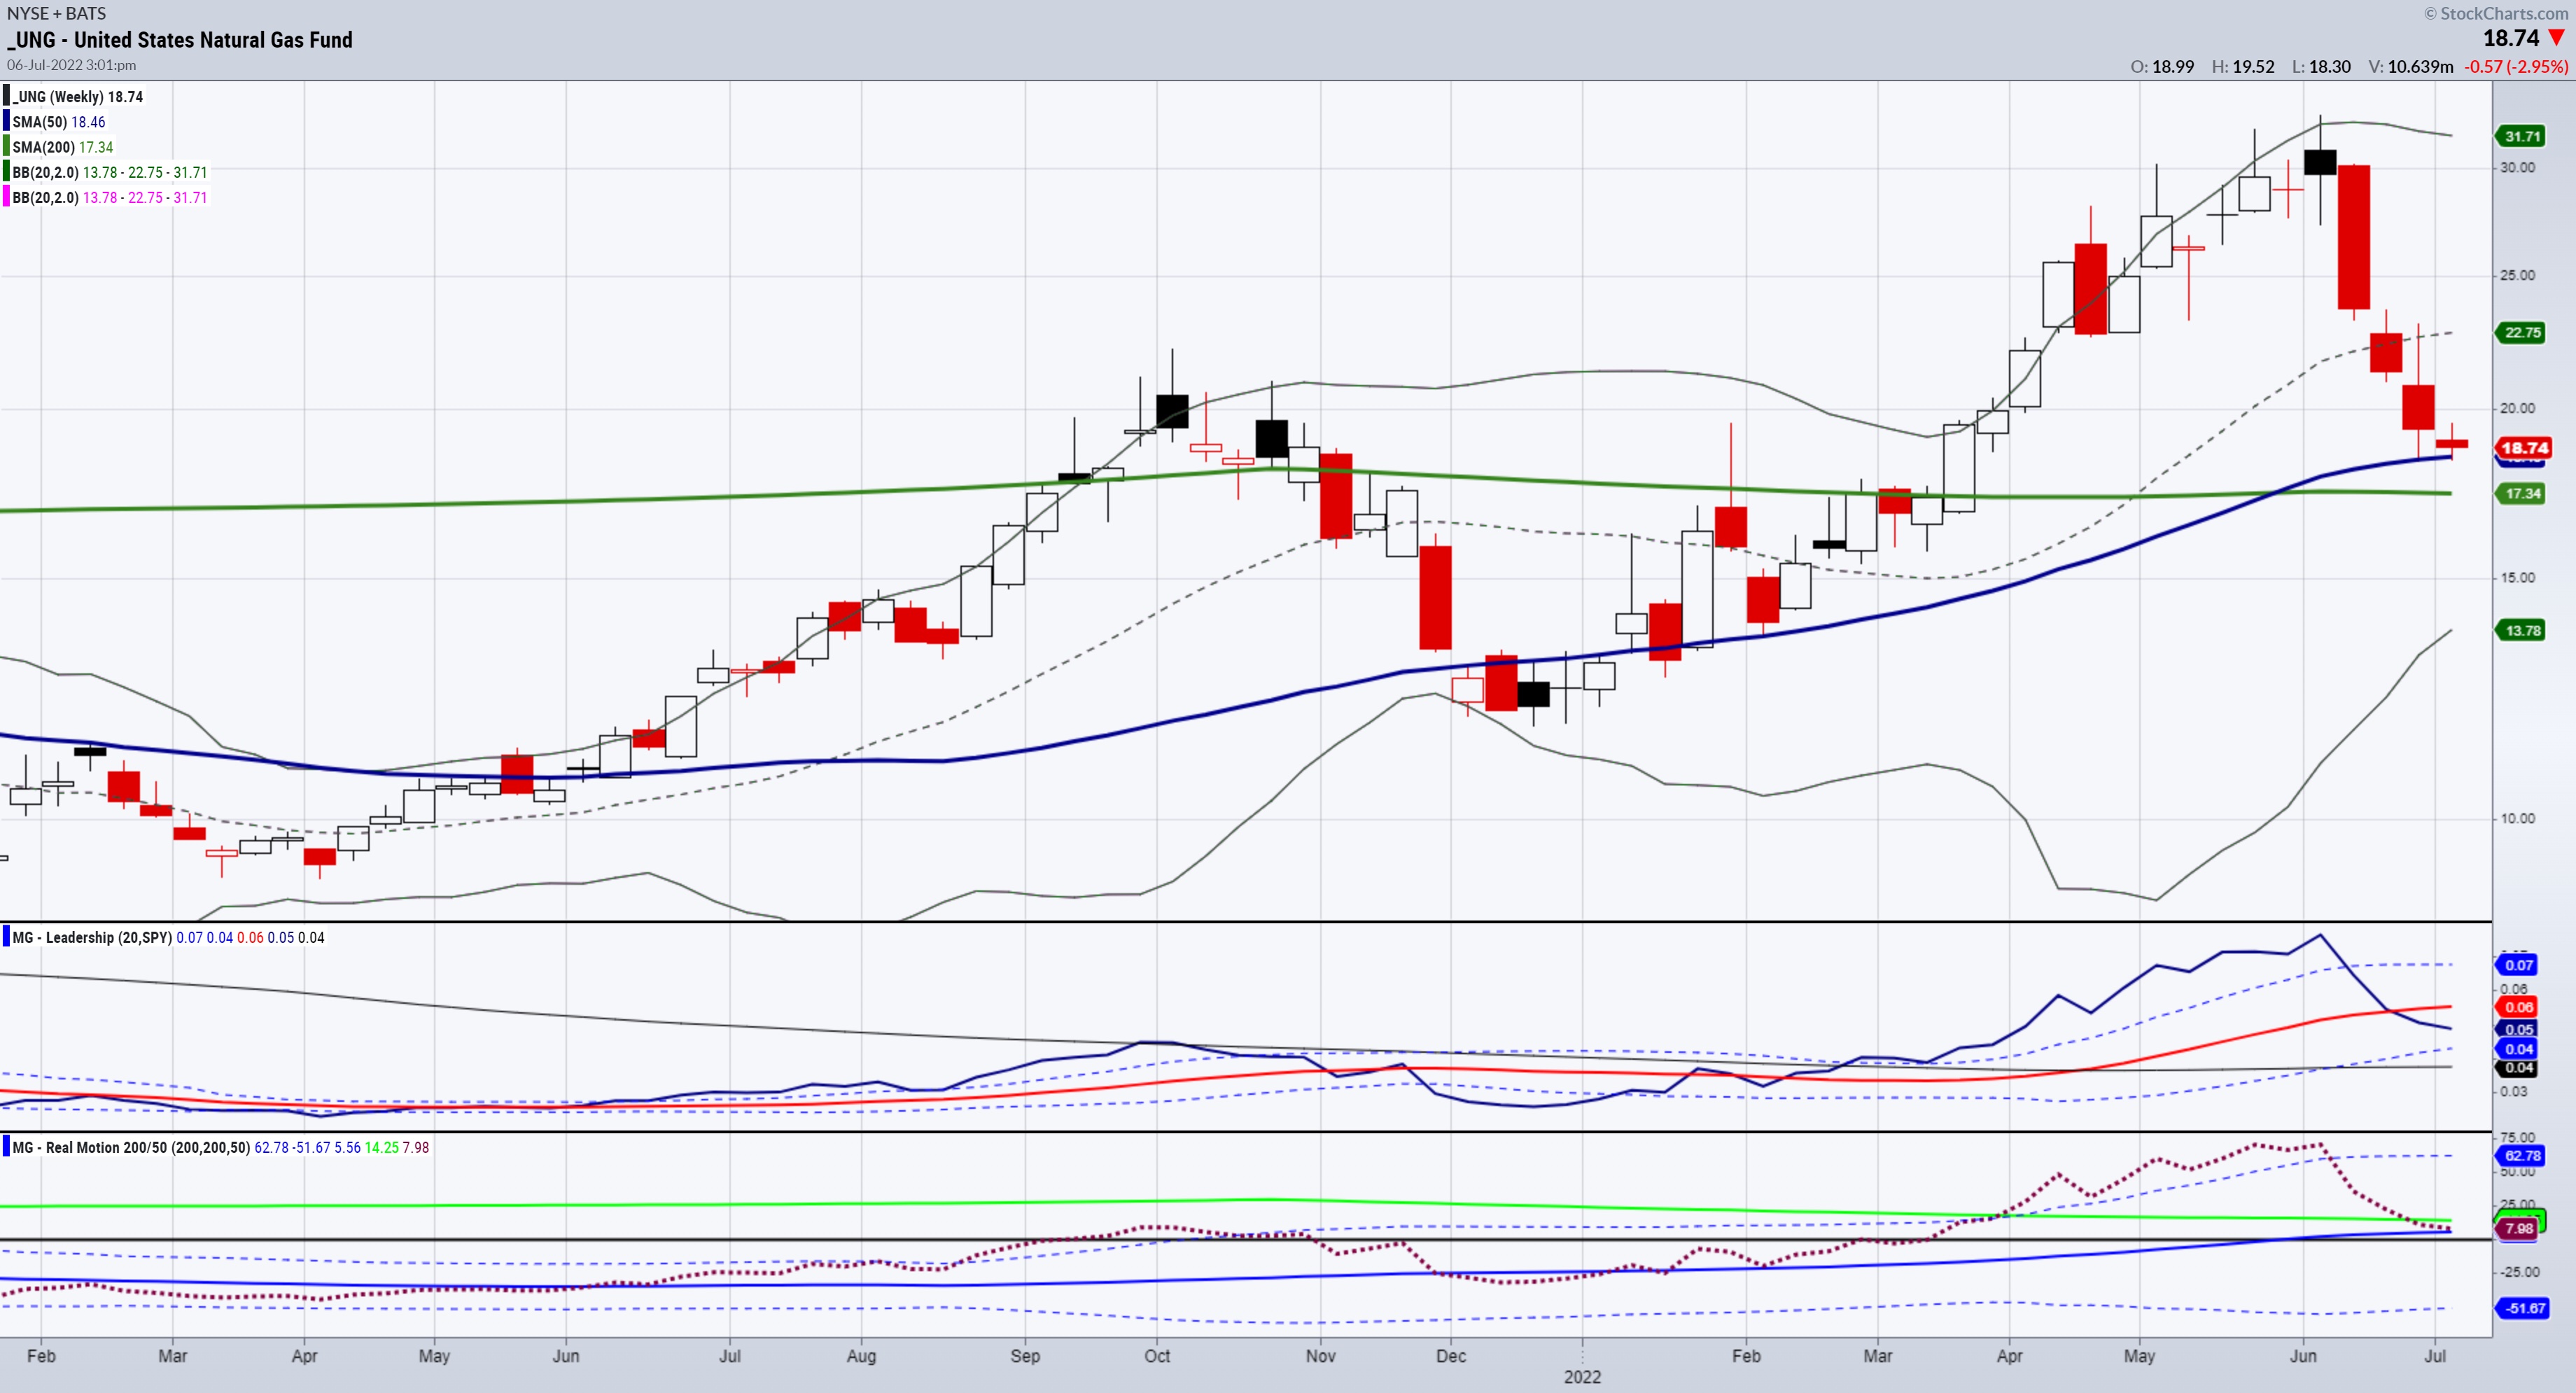
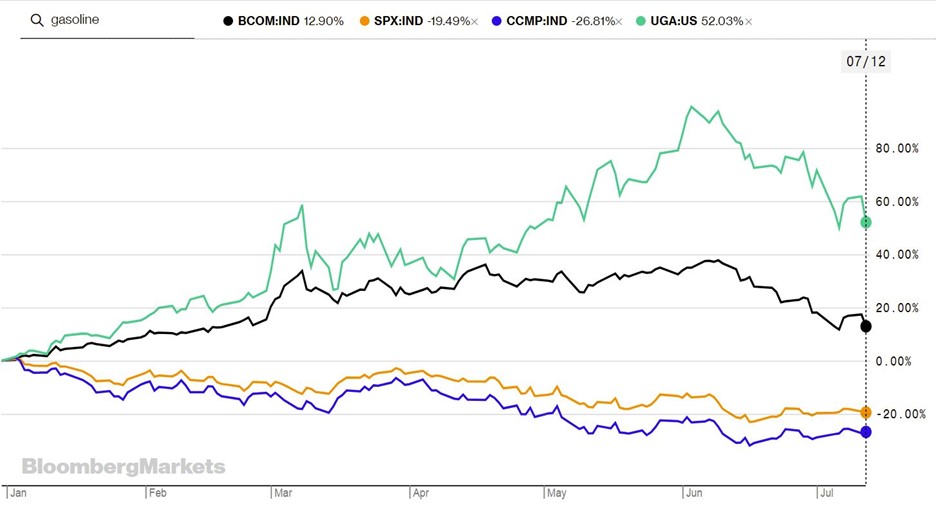
Mish's Daily: Dislocation -- Fundamentals vs. Price in Natural Gas
Global demand for natural gas continues to skyrocket in the wake of Russia's invasion of Ukraine.
Over the last year, demand for LNG has risen incredibly, as have LNG stockpiles. The United States is competing with Australia and Qatar for the world's largest exporter of natural...
READ MORE
MEMBERS ONLY

Credit Spreads May be the Canary in the Financial Mine
by Martin Pring,
President, Pring Research
Waterfall declines leading to capitulation are easy to observe and understand when we have the benefit of hindsight. However, they are almost impossible to identify ahead of time.
One characteristic often associated with such uncomfortable price moves is an unexpected weakening of economic activity, where confidence literally falls off a...
READ MORE
MEMBERS ONLY
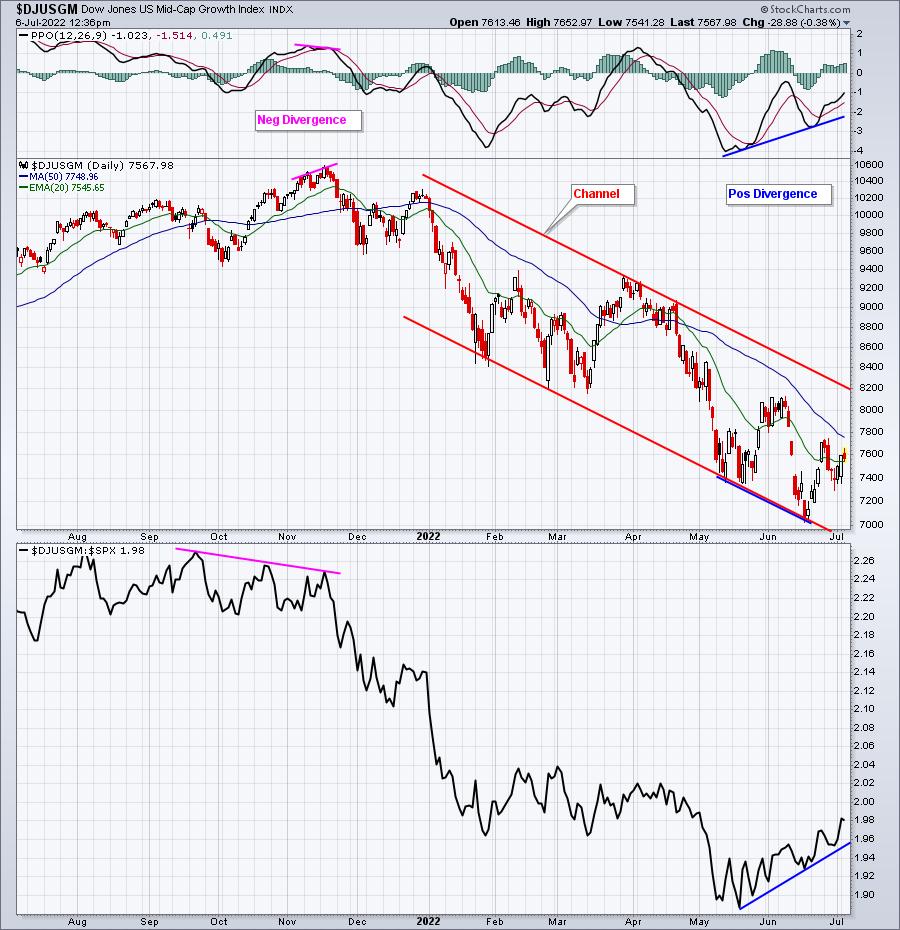
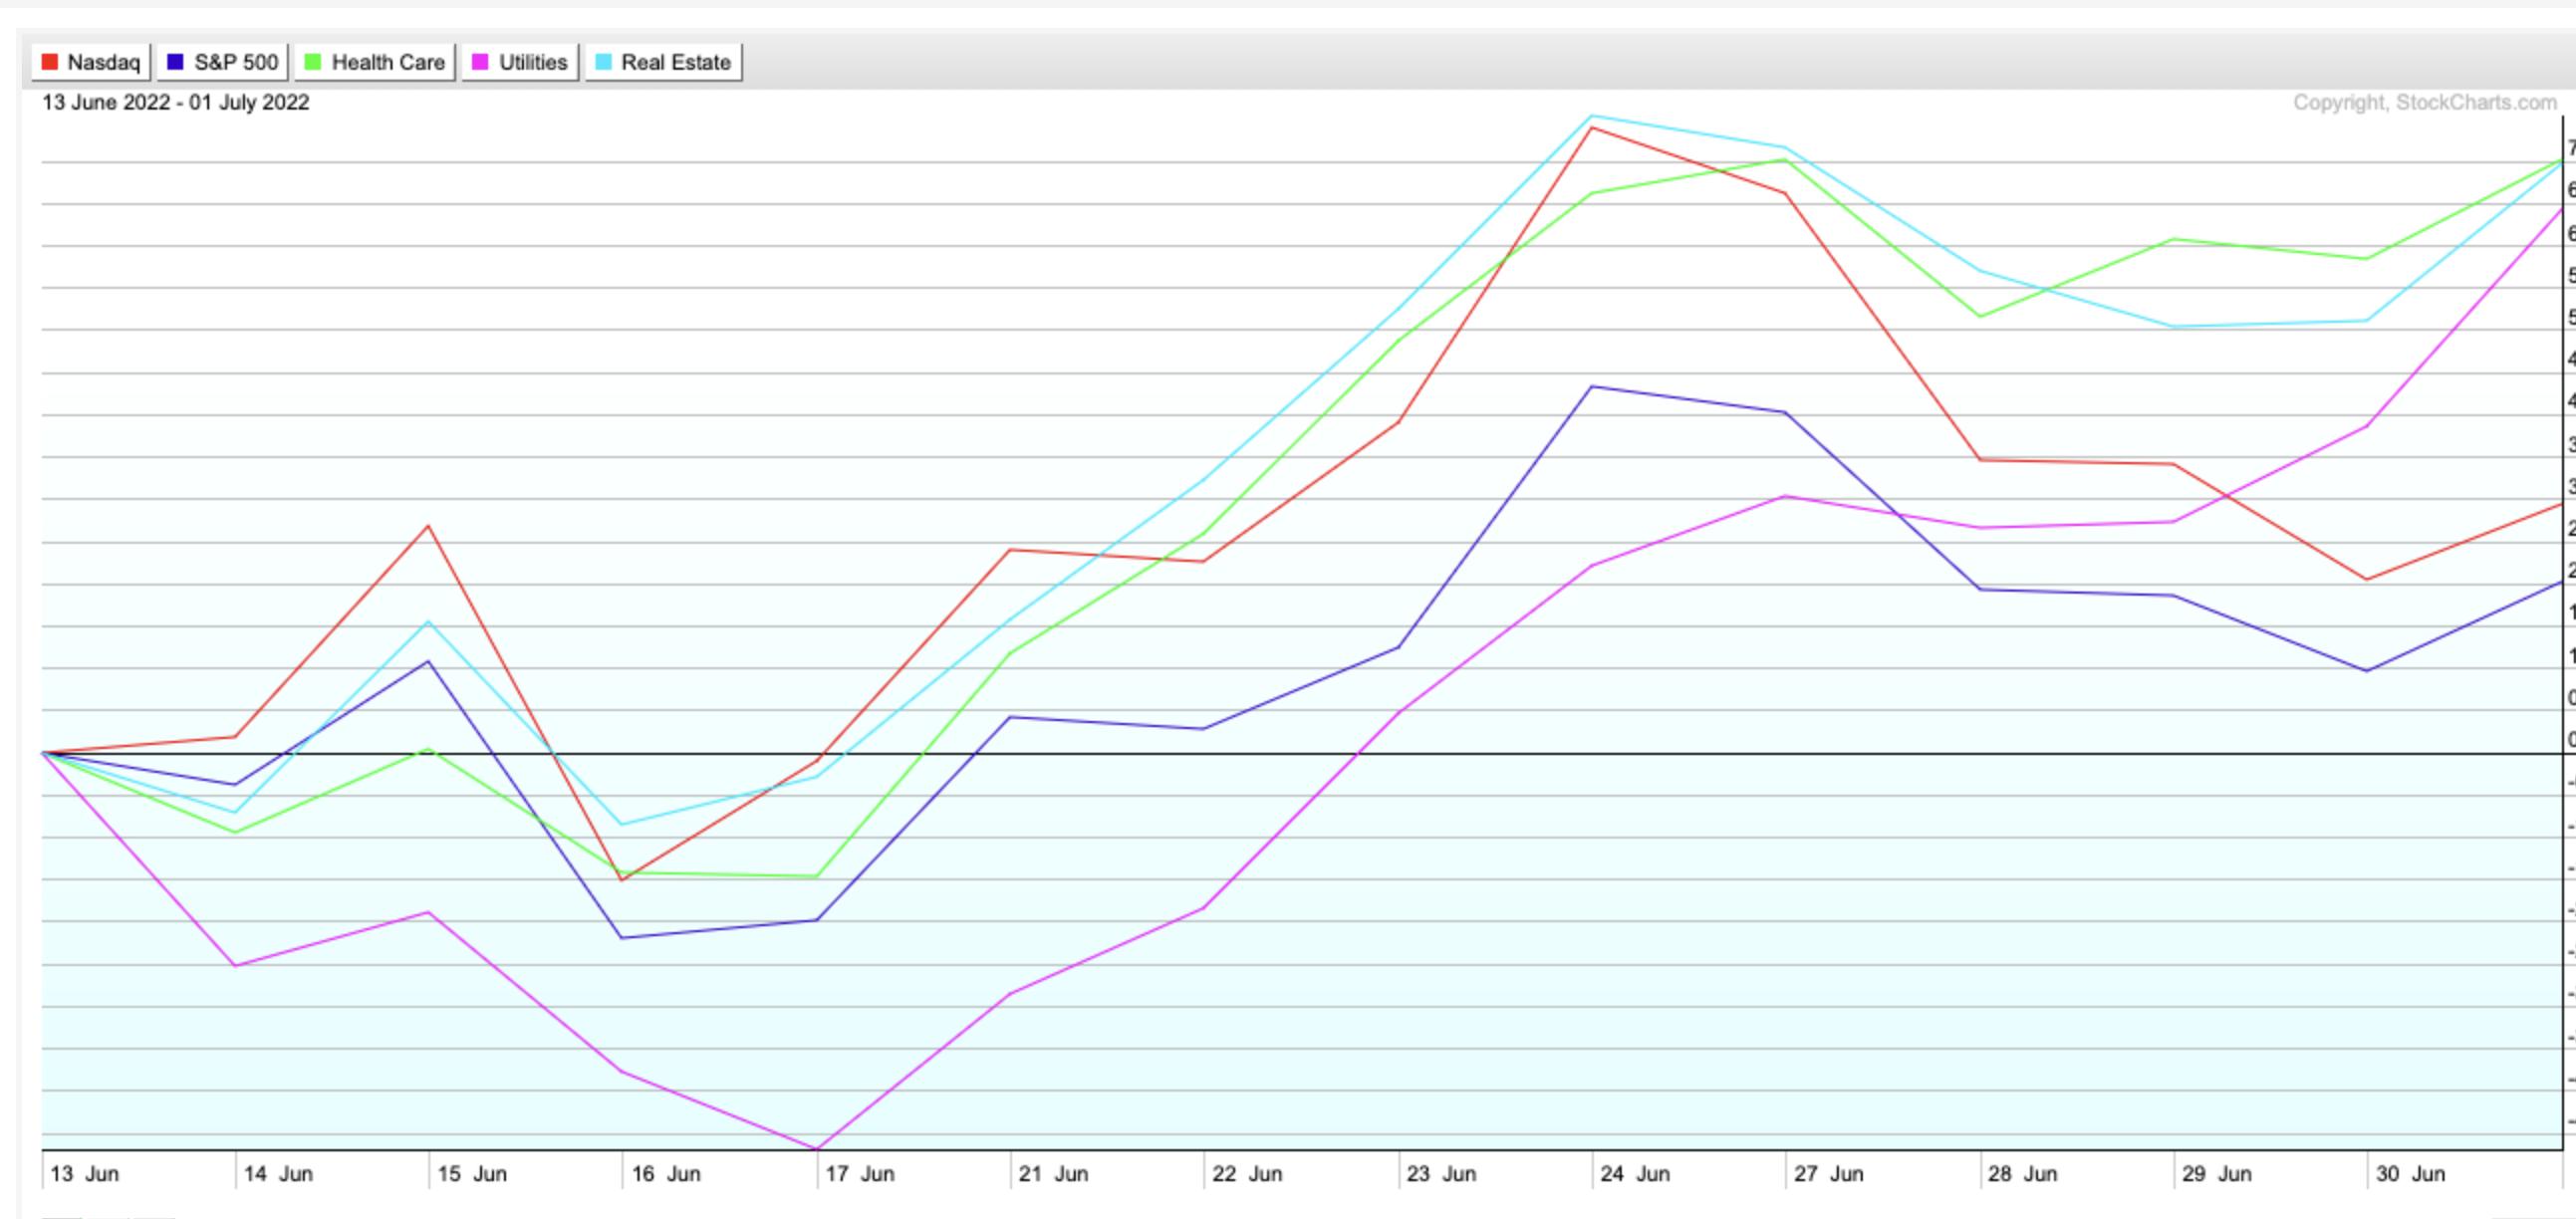
Shhhhh! Don't Tell Anyone, But Here's a Wall Street Secret!
by Tom Bowley,
Chief Market Strategist, EarningsBeats.com
One very interesting and intriguing part of stock trading is that Wall Street disguises their buying/selling and rotation, as many times the absolute charts don't tell us the REAL story. I want you to look at the absolute price action in both mid-cap growth ($DJUSGM) and mid-cap...
READ MORE
MEMBERS ONLY
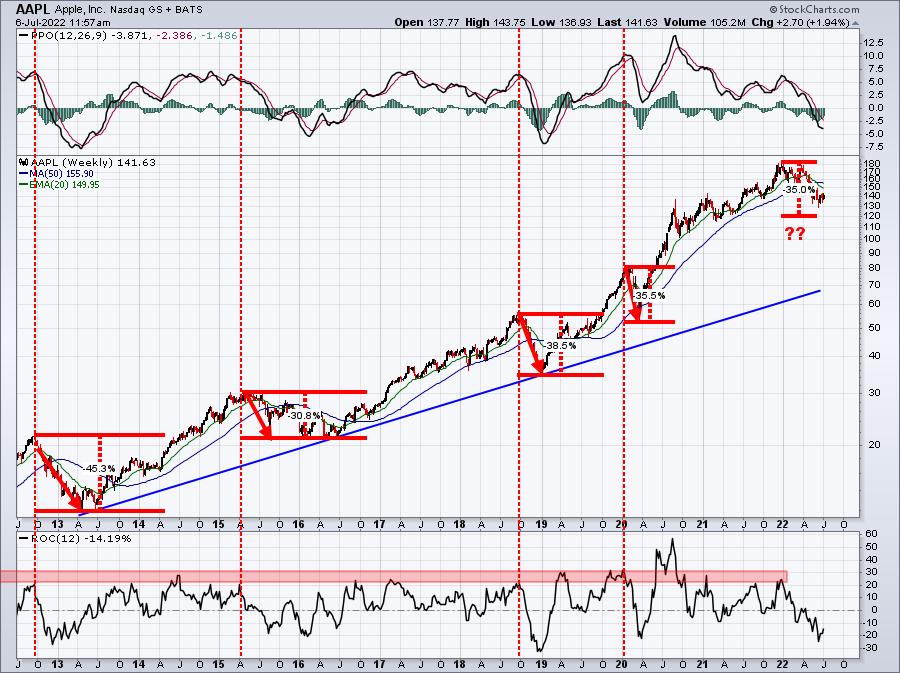
AAPL Is A Strong BUY Now, Here's Why
by Tom Bowley,
Chief Market Strategist, EarningsBeats.com
In case you haven't followed my work, I was very bearish U.S. equities as we opened 2022. I didn't wait to see the carnage to tell you that there was carnage. I predicted the carnage before we ever saw it. Included in those bearish predictions...
READ MORE
MEMBERS ONLY
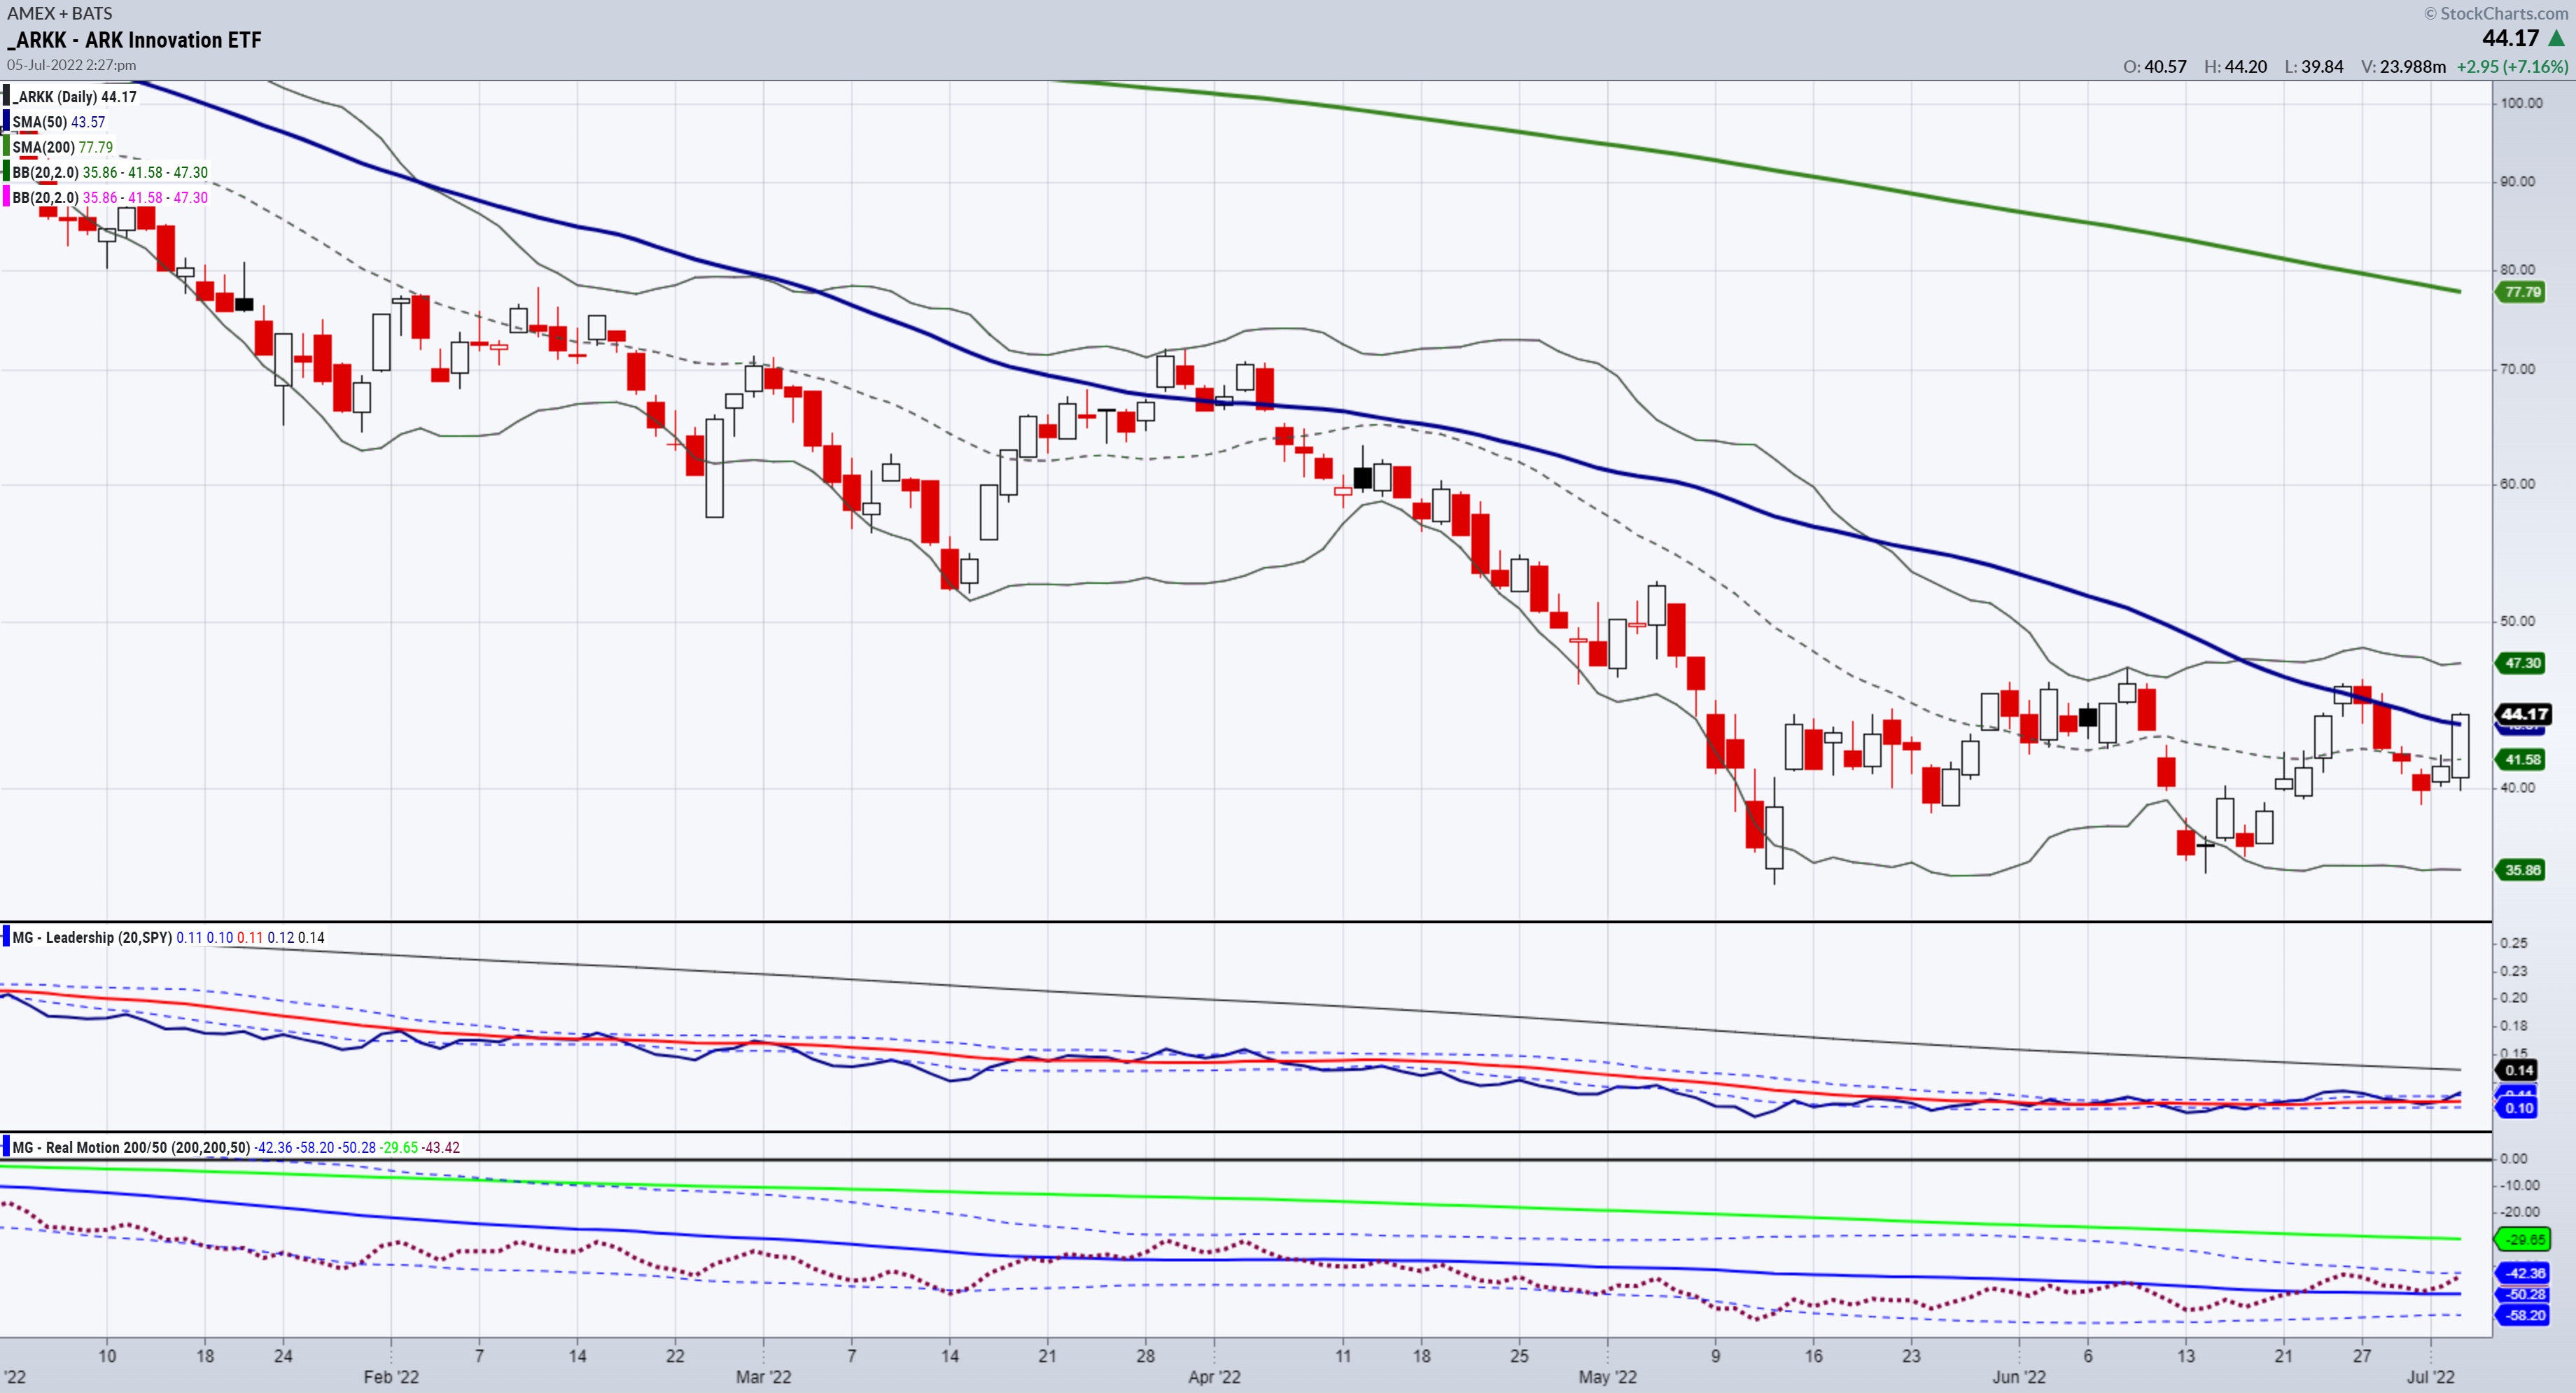
Mish's Daily: Did ARKK Bottom?
ARKK may be the most extraordinary example of sheer brilliance and horrific money management combined.
We all watched ARKK fly to its peak in early 2021. We all watched ARKK tumble to nearly 70% of that peak this year in 2022. And we all listened to Cathie Wood dig herself...
READ MORE
MEMBERS ONLY
Sector Spotlight: Bonds Drop, Money Leaves Materials Sector
by Julius de Kempenaer,
Senior Technical Analyst, StockCharts.com
In this edition of StockCharts TV's Sector Spotlight, to kick off the month of July, I dive into the status of the long-term trends as they are unfolding on the monthly charts. The main message from the asset classes is that the bond market is clear: Corporate- and...
READ MORE
MEMBERS ONLY
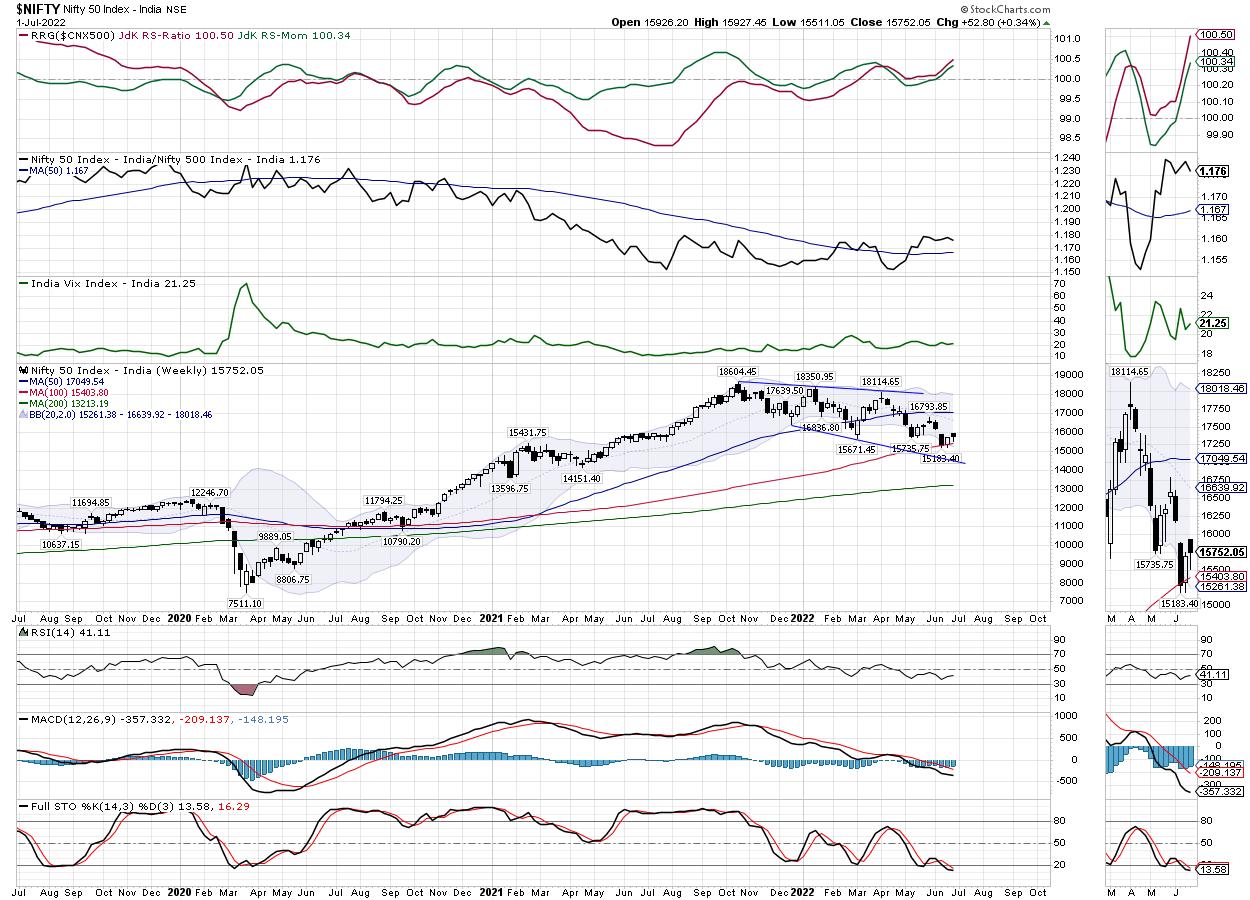
Week Ahead: NIFTY Must Move Past This Point for a Sustainable Move; RRG Shows Mixed Sectoral Setup
by Milan Vaishnav,
Founder and Technical Analyst, EquityResearch.asia and ChartWizard.ae
It was a week of consolidation for the Indian equities; the markets struggled to move past the key resistance levels. At the same time, the NIFTY also continued to hold on to the key support points. The last five sessions kept the markets largely in a broad but defined range....
READ MORE
MEMBERS ONLY
These "Recession Stocks" Are On The Move
by Mary Ellen McGonagle,
President, MEM Investment Research
It's been a tough year for the markets, with U.S. stocks posting their worst start to a year in over 50 years. The second half may bring additional woes, with investors increasingly on the lookout for a possible recession amid a slowdown in corporate and economic growth....
READ MORE
MEMBERS ONLY
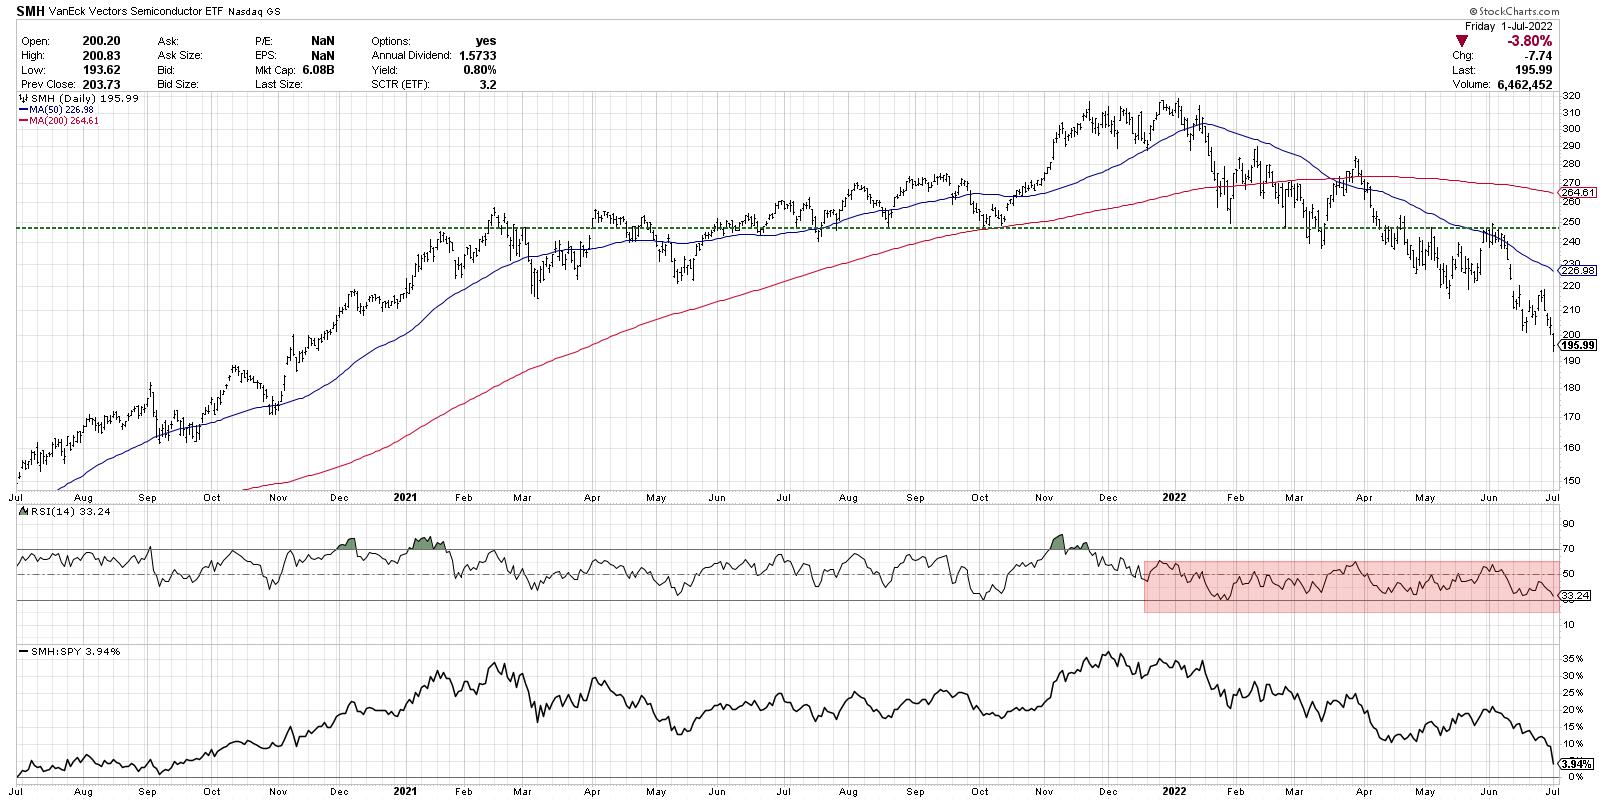
New Low for Semiconductors is Not Bullish
by David Keller,
President and Chief Strategist, Sierra Alpha Research
Semiconductors are what I consider a "bellwether" group. These companies truly provide the backbone of the modern information economy, so, when these stocks are doing well, the economic conditions are most likely strong. The SMH is featured a number of times on my Mindful Investor Live ChartList, mainly...
READ MORE
MEMBERS ONLY
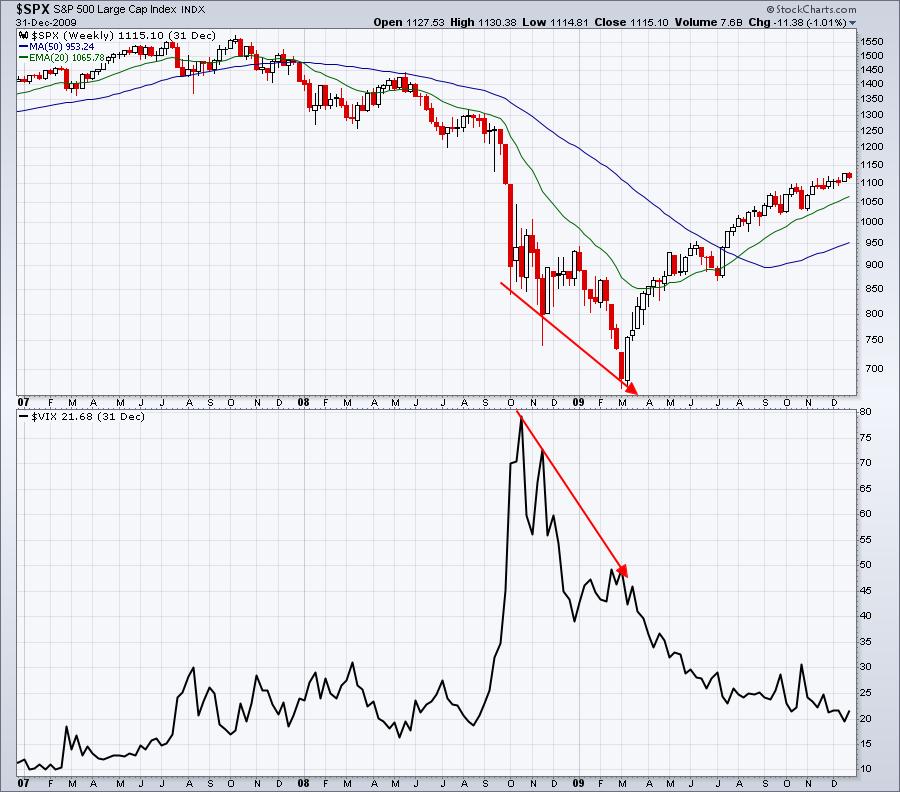
Falling VIX Spells BIG Trouble For The Bears
by Tom Bowley,
Chief Market Strategist, EarningsBeats.com
If there's one thing that a bear market - secular or cyclical - feeds on, it's fear. The further the drop, the bigger the spike we see in the Volatility Index ($VIX). From the CBOE.com website, the VIX "measures the level of expected volatility...
READ MORE
MEMBERS ONLY
MEM TV: Growth Stocks Suffer Despite Declining Rates
by Mary Ellen McGonagle,
President, MEM Investment Research
On this episode of StockCharts TV'sThe MEM Edge, Mary Ellen shares why Growth stocks suffered despite interest rates declining. She also reviews where the strength is in the markets and the best way you can participate.
This video was originally broadcast on July 1, 2022. Click on the...
READ MORE
MEMBERS ONLY
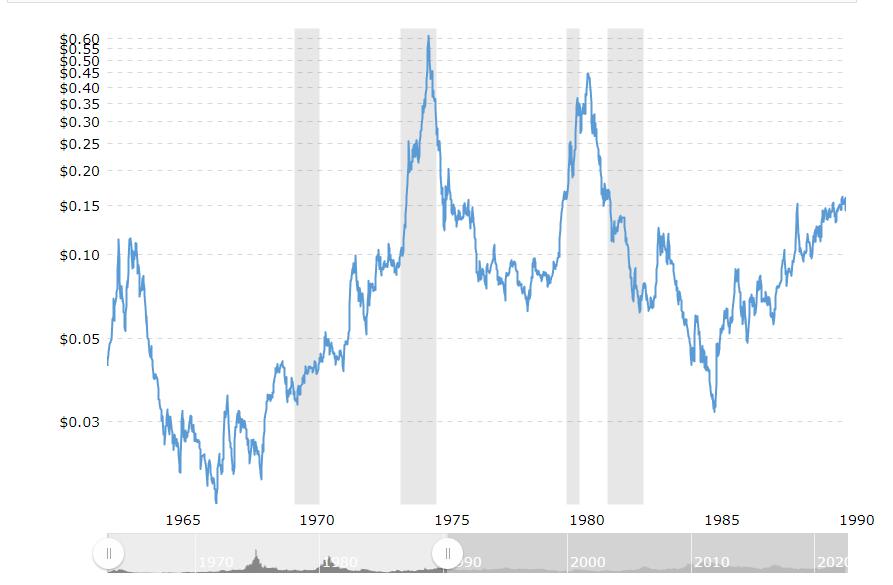
Mish's Daily: Sugar Futures Then and Now -- and Why it Matters
Some History First
In 1972, supply shortfalls, rising demand, unrest in Pakistan and the devaluation of the dollar all contributed to a large increase in the price of sugar. By February of 1974, with rising inflation, rising demand from China, rumors of a large purchase by the USSR on global...
READ MORE
MEMBERS ONLY

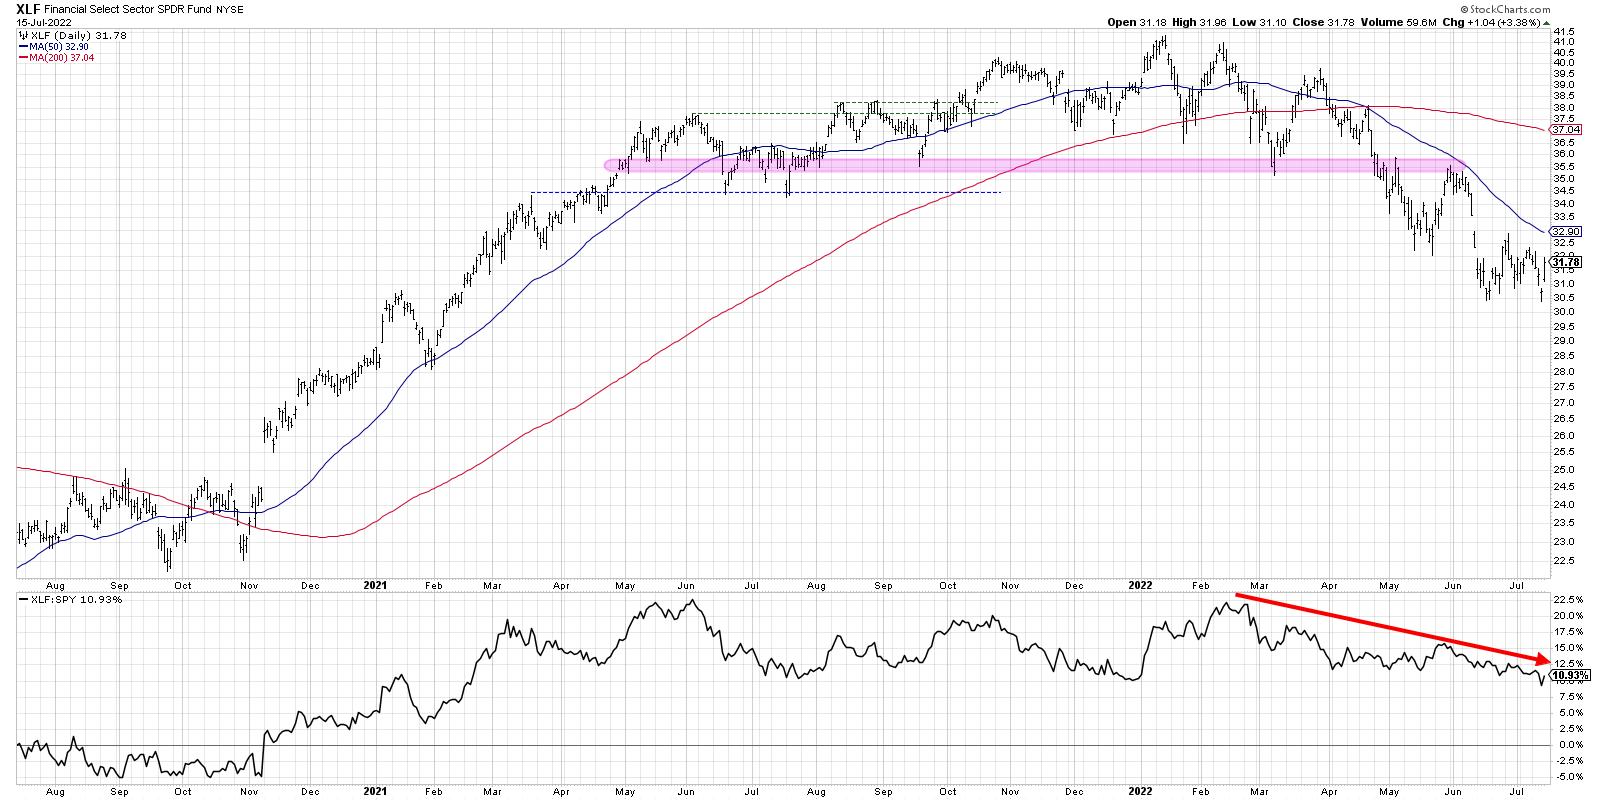
Money Rotating Out of Insurance Groups is Splitting The Financials Sector in Two
by Julius de Kempenaer,
Senior Technical Analyst, StockCharts.com
The Financial sector qualifies as an offensive, or cyclical, sector, together with Consumer Discretionary, Real-Estate and Materials.
On the Relative Rotation Graph for sectors, XLF is showing up inside the lagging quadrant, signaling a relative downtrend vs. the benchmark (SPY). It is interesting to see that XLF is the only...
READ MORE
MEMBERS ONLY
Markets Choppy Going into the 4th of July Weekend
by TG Watkins,
Director of Stocks, Simpler Trading
On this week's edition of Moxie Indicator Minutes, the markets pulled back the way TG was expecting them to; since then, he's been looking to see if the pullback was into strength. Typically, the market is bullish going into the 4th of July weekend, which is...
READ MORE
MEMBERS ONLY
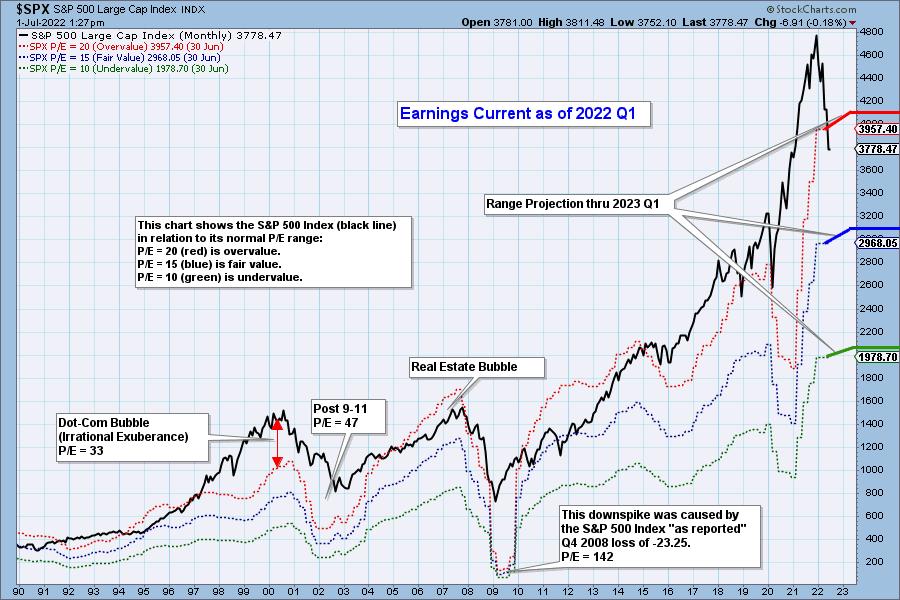
2022 Q1 Earnings Are In and Valuations Are No Longer Extreme
by Carl Swenlin,
President and Founder, DecisionPoint.com
The following chart shows us the normal value range of the S&P 500 Index, indicating where the S&P 500 would have to be in order to have an overvalued P/E of 20 (red line), a fairly valued P/E of 15 (blue line), or an...
READ MORE
MEMBERS ONLY
GNG TV: Overhead Resistance for Energy Trade
by Alex Cole,
Co-founder, GoNoGo Charts®
by Tyler Wood,
Co-founder, GoNoGo Charts®
Academic evidence solidifies that the market is a leading economic indicator. No one knows what will happen next in terms of an economic recession, but we can look at the weight of the evidence to put probabilities on our side. On this week's edition of the GoNoGo Charts...
READ MORE
