MEMBERS ONLY

How to Protect Yourself from Market Bias

by Joe Rabil,
President, Rabil Stock Research
On this week's edition of Stock Talk with Joe Rabil, Joe shows off one of his reports, called the "Heavyweights Review". He explains the importance of knowing the trends for the top stocks based on market cap, then shows the short, intermediate, and long-term trends for...
READ MORE
MEMBERS ONLY

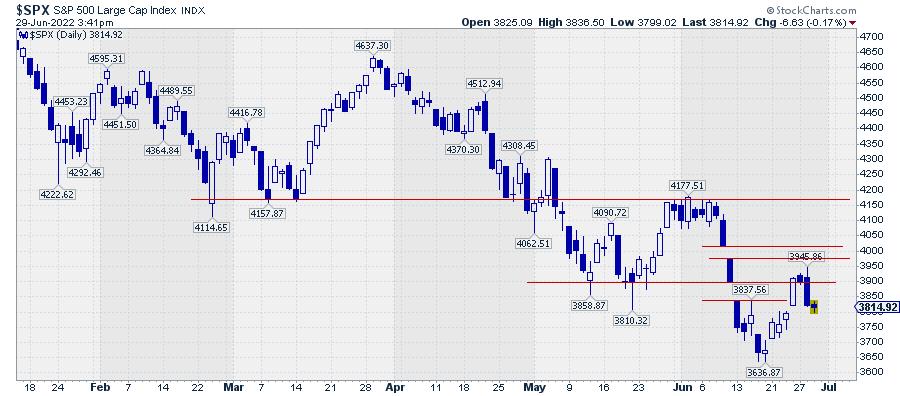
STOCKS END SECOND QUARTER ON THE DOWNSIDE -- YIELD CURVE NEARS INVERSION -- SECTOR RANKINGS REMAIN DEFENSIVE

by John Murphy,
Chief Technical Analyst, StockCharts.com
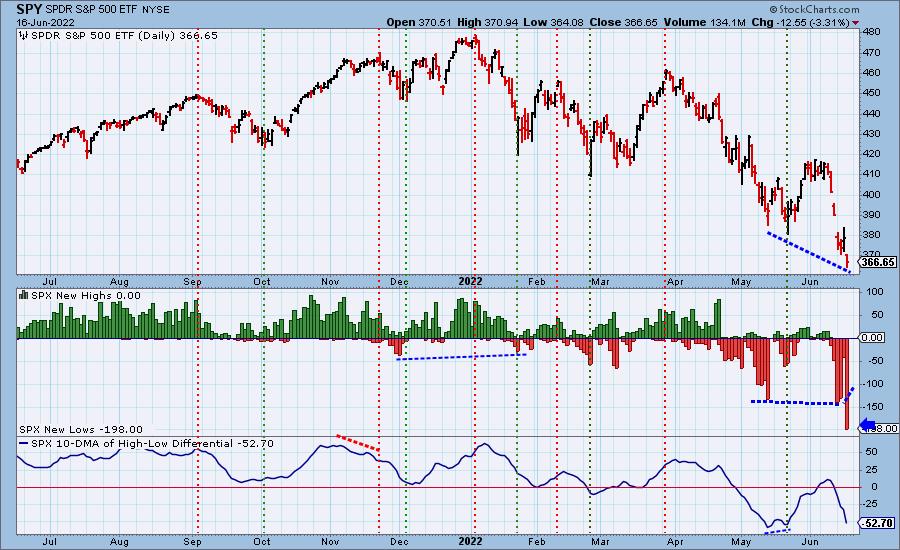
STOCKS REMAIN UNDER PRESSURE...Stocks are ending the quarter with more selling. The weekly bars in Chart 1 show the S&P 500 down more than 3% on the week with a monthly loss of more than 8%. For the year, the S&P 500 is down 20%...
READ MORE
MEMBERS ONLY
Isn't That Beautiful?

by Julius de Kempenaer,
Senior Technical Analyst, StockCharts.com
Yes, Technical Analysis can be (very) subjective at times. Different (types of) investors interpret charts differently. And yes, more quant-based technical approaches can make interpretation of charts or time series less subjective. Personally, I am probably somewhere in the middle of the spectrum.
BUT, looking at the chart of the...
READ MORE
MEMBERS ONLY
Mish's Daily: Post PCE -- What is the Pre-PCE Market Saying?
Stocks are primarily unchanged or trading slightly higher as pressures from rising food and energy prices persist.
As I reiterate, among the war's immediate external financial implications are disruptions in global supply lines for cereals, fertilizers, metals and energy, all of which are passed on to global consumers...
READ MORE
MEMBERS ONLY

The Fine Art of Keeping Capital Out of Harm's Way

by Dave Landry,
Founder, Sentive Trading, LLC
On this week's edition of Trading Simplified, Dave illustrates his methodology in action by showing why he avoided recent mystery charts that would have failed miserably. He also presents a new mystery chart that shows promise. He then goes on to discuss the TFM 10% system, which is...
READ MORE
MEMBERS ONLY
Mish's Daily: The Textbook Definition of Recession
Although GDP growth is a crucial measure of economic activity, it is not the most significant factor to consider when predicting future stock market returns, since it is a lagging economic indicator. Yet it seems like everyone I talk to is discussing whether we are already in a recession this...
READ MORE
MEMBERS ONLY
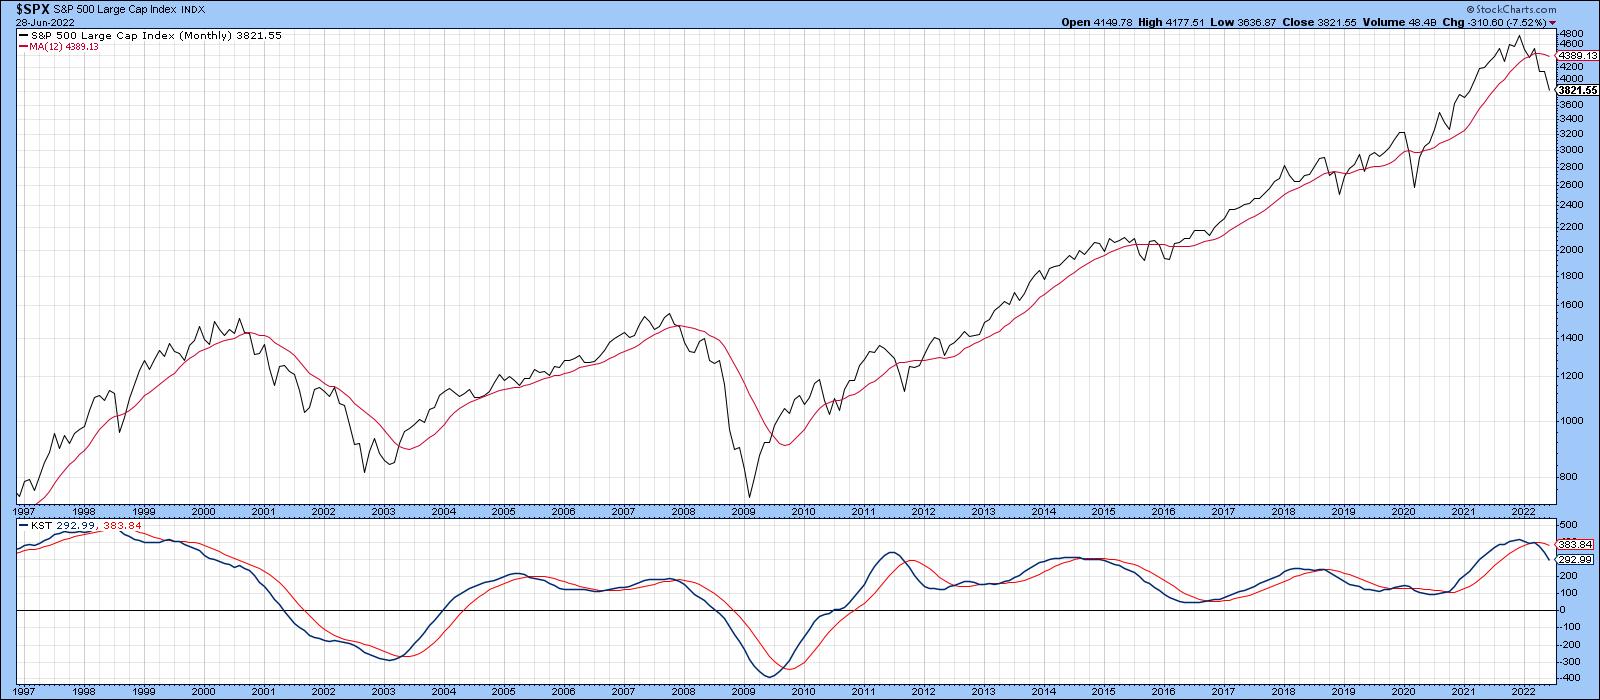
The Rally Since Mid-June Leaves a Lot to be Desired

by Martin Pring,
President, Pring Research
Long-term indicators, such as the KST and the S&P relative to its 12-month MA, remain in a bearish mode, but, that said, it would certainly be unusual to see them turn bullish immediately after the final low. Indeed, Chart 1 shows that the Index is currently well below...
READ MORE
MEMBERS ONLY

This Payment Services Stock Lost 74% After Listing; Is There a Trend Reversal?

by Milan Vaishnav,
Founder and Technical Analyst, EquityResearch.asia and ChartWizard.ae
PAYTM.in (One97 Communications Ltd) has been one of the worst IPO performers in the Indian markets. After listing near Rs. 2100, the stock lost close to 74% as it formed a low near the 520 level. Presently, multiple technical pieces of evidence suggest that there may be an attempt...
READ MORE
MEMBERS ONLY

Sector Spotlight: Sector Rotation Out of Energy Stocks
by Julius de Kempenaer,
Senior Technical Analyst, StockCharts.com
In this edition of StockCharts TV's Sector Spotlight, for this last Tuesday of the month, I take a look at seasonal sector rotation and try to align that with the current reality to see if meaningful matches can be found. For this month, four sectors are providing potentially...
READ MORE
MEMBERS ONLY
"Investing with the Trend" Review

by Greg Morris,
Veteran Technical Analyst, Investor, and Author
A review by Dr. Mark Holder.
"History repeats itself." Never was a phrase (oft cited as Churchill quote) more apt in describing a text. The book, Investing with the Trend by Gregory L. Morris, is now more in tune with today than ever. As a trainer for new...
READ MORE
MEMBERS ONLY

DP TV: Time to Fish in These Industry Groups!

by Erin Swenlin,
Vice President, DecisionPoint.com
In this episode of DecisionPoint, Erin, flying solo for the week, jumps right into an overview of the market and DecisionPoint indicators, with coverage of the woes of Bitcoin and encouraging news for Crude Oil. She deep dives into one of the best performing sectors, Healthcare, and also reviews the...
READ MORE
MEMBERS ONLY
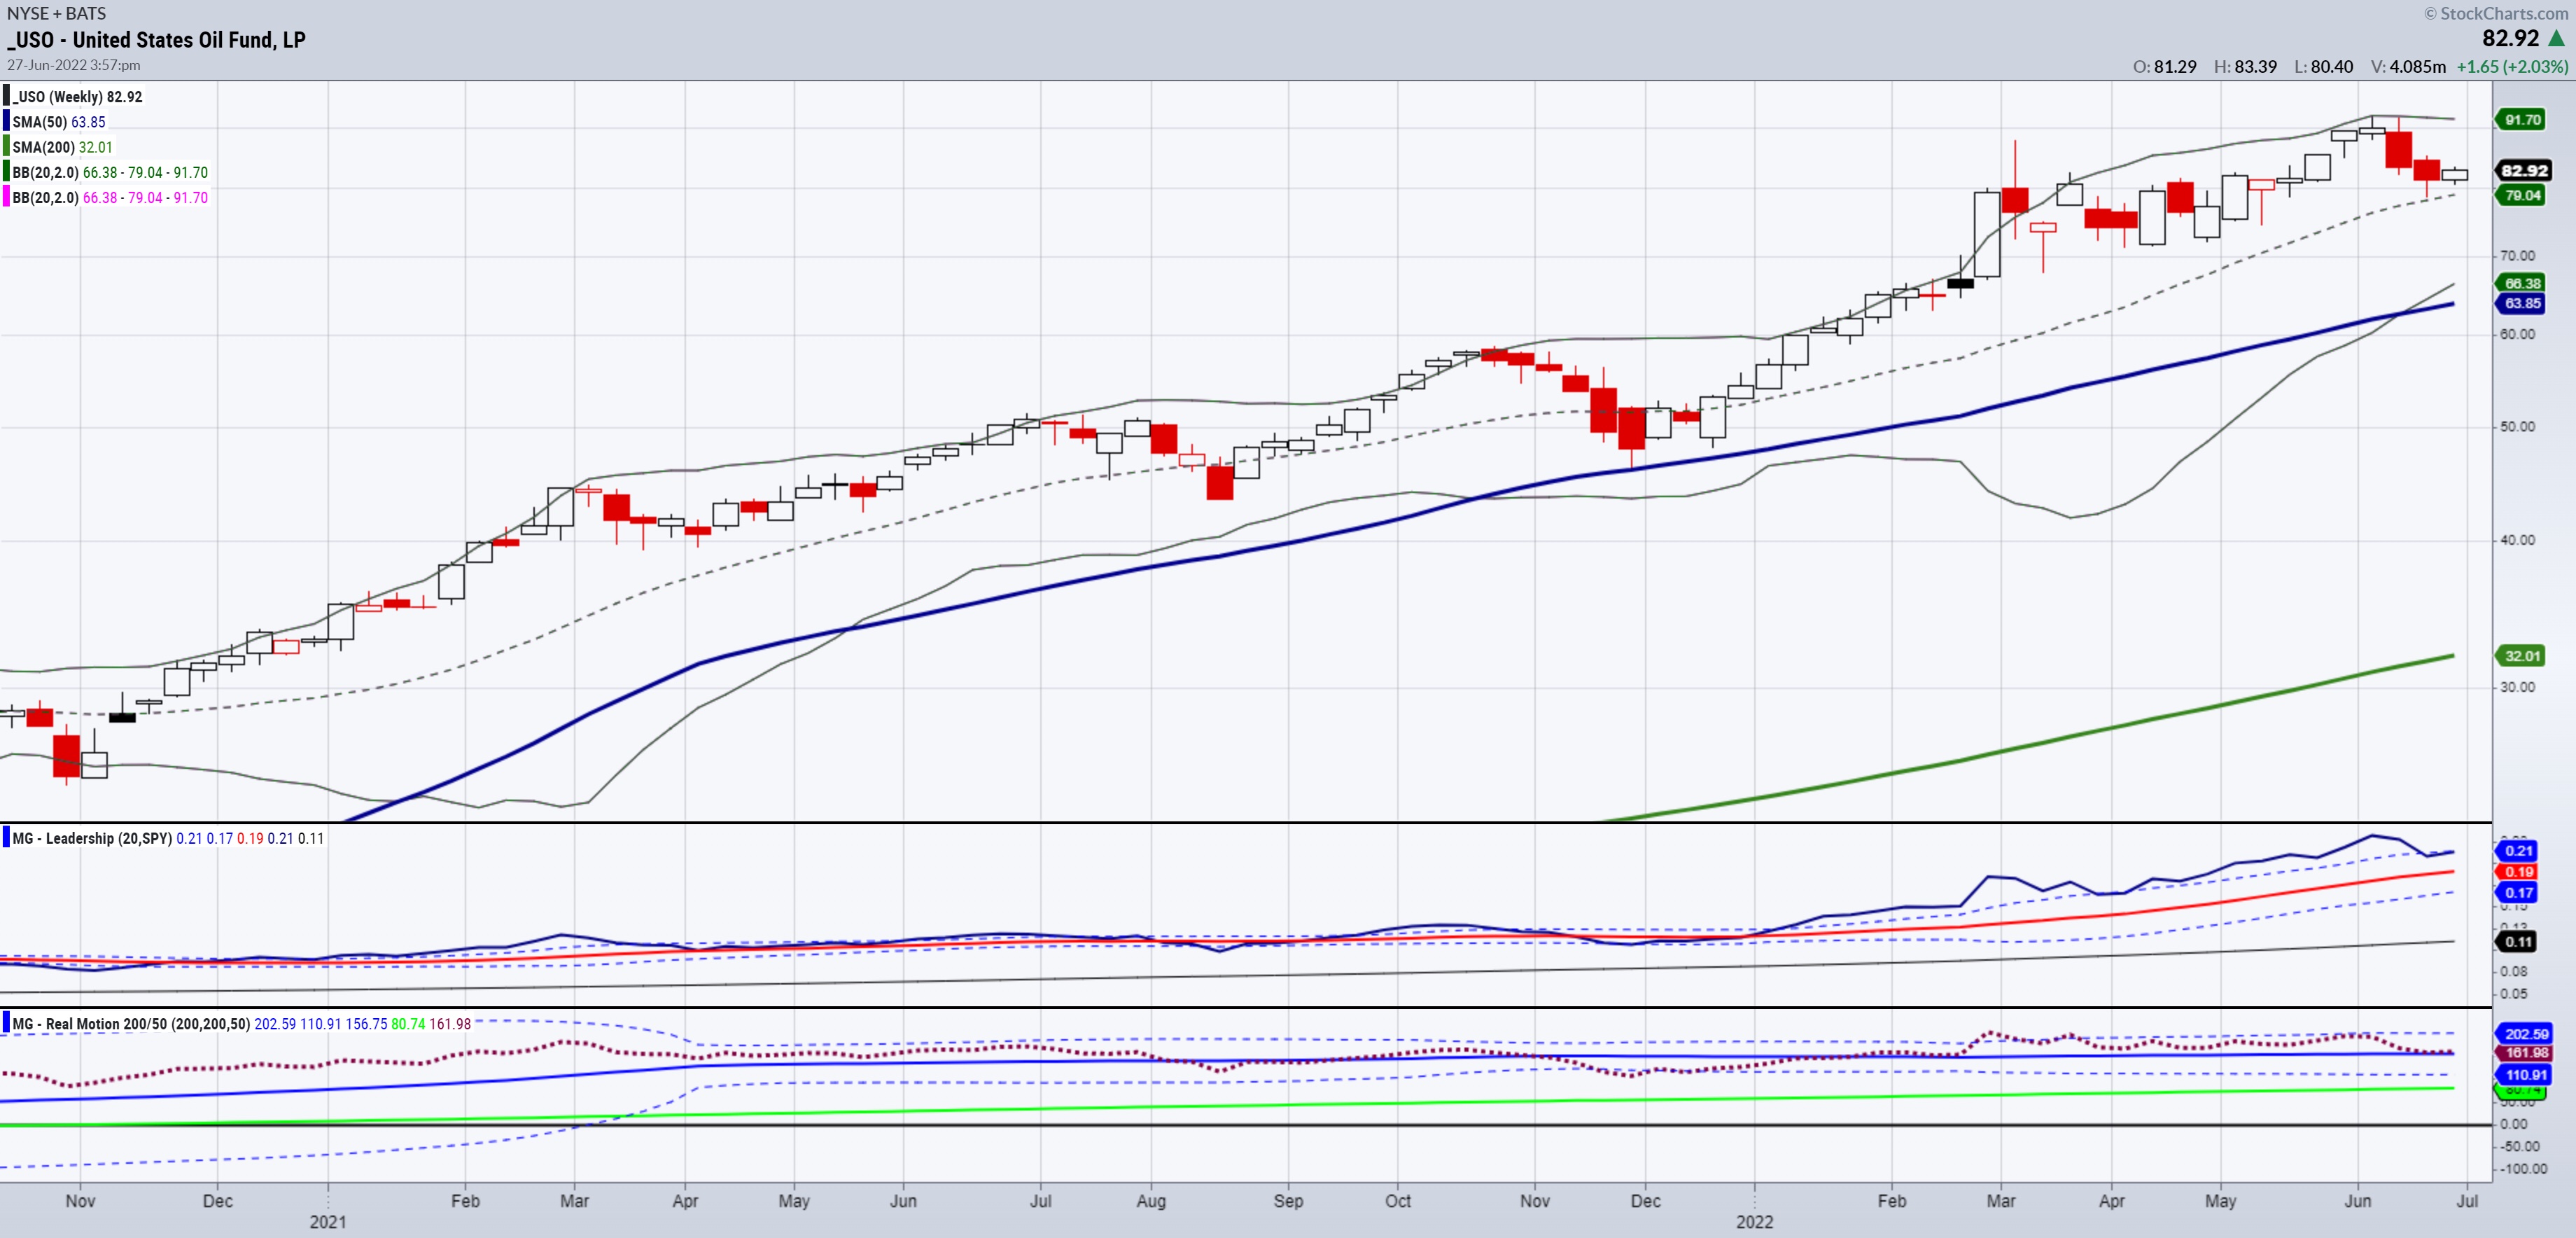
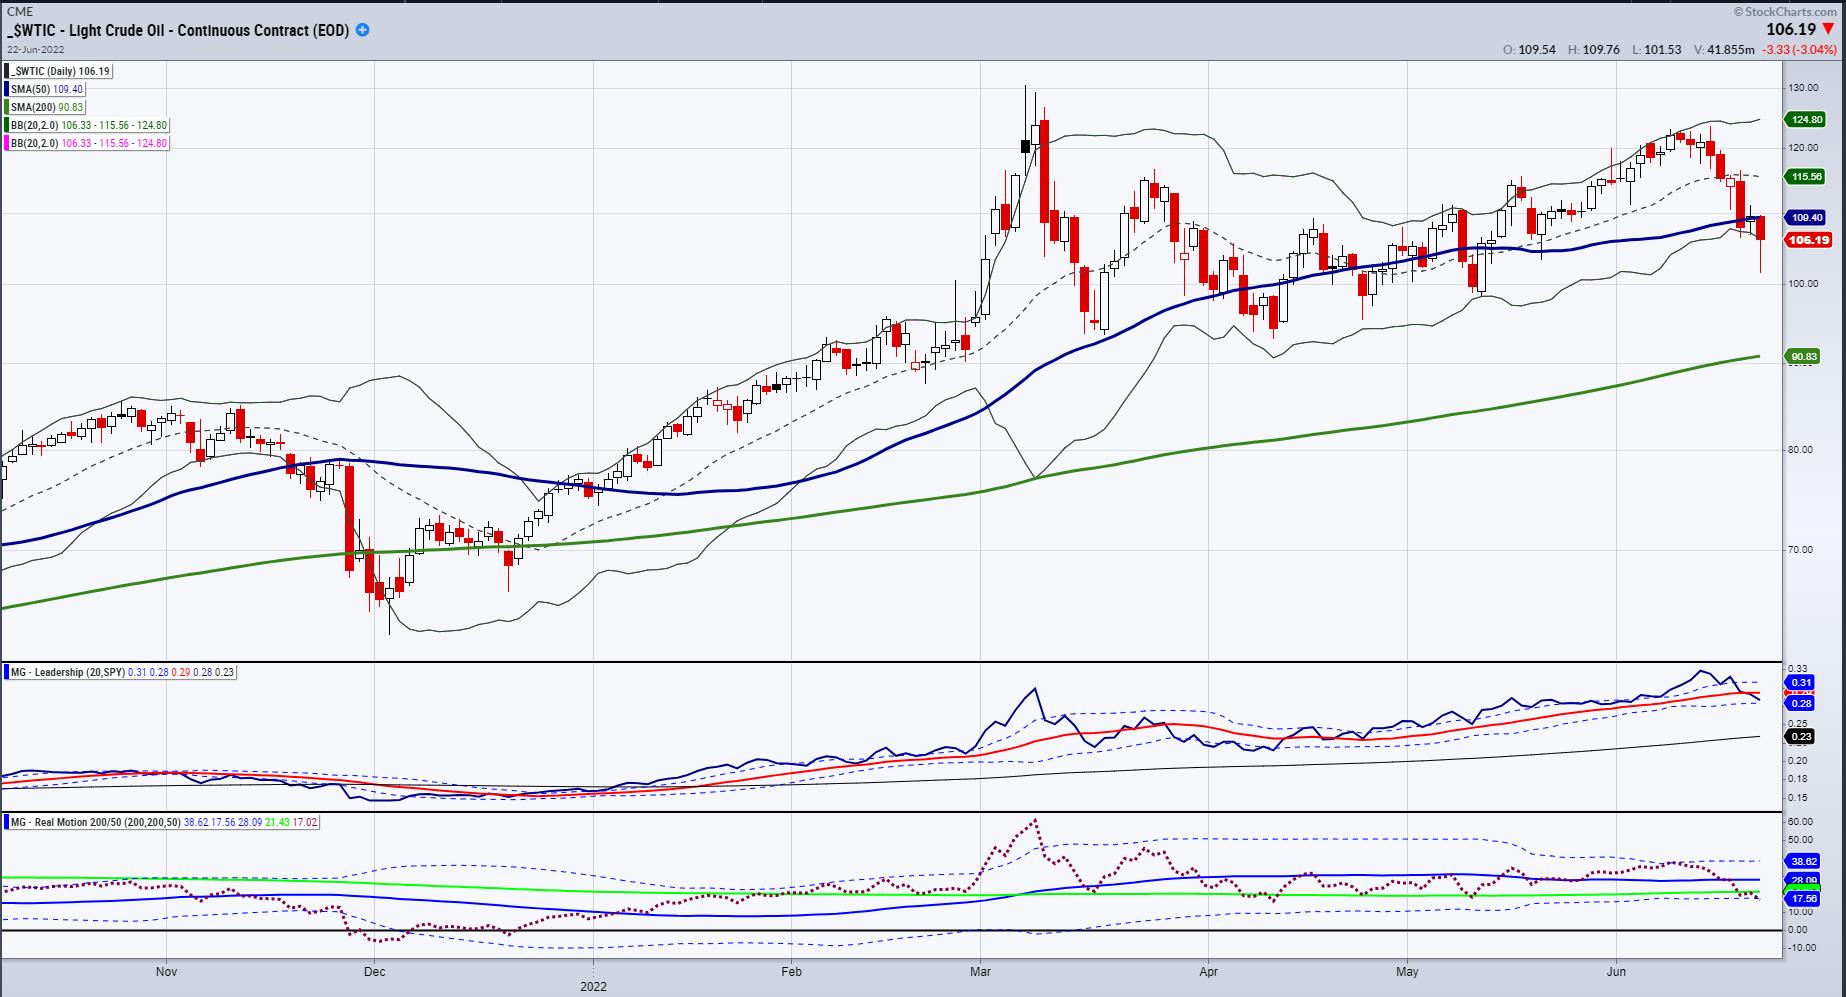
Mish's Daily: What Can We Expect from Oil Prices?
U.S. crude oil continues to rise after a pullback late last week to around the mid-$90s per barrel. However, the price is hitting short-term resistance around $109-$110 for the time being.
Over the last four days, the USO oil ETF also rebounded strongly after the correction late...
READ MORE
MEMBERS ONLY

STOCKS HAVE A STRONG WEEK WITHIN DOWNTREND -- MARKET BREADTH REMAINS WEAK -- COPPER SELLING SIGNALS ECONOMIC WEAKNESS
by John Murphy,
Chief Technical Analyst, StockCharts.com
BEAR MARKET BOUNCE...Major stock indexes had their first gain in three weeks and made up for the previous week's big losses. But any rebound still has to be viewed as a bear market bounce. The weekly bars in the first three charts below paint a similar picture....
READ MORE
MEMBERS ONLY
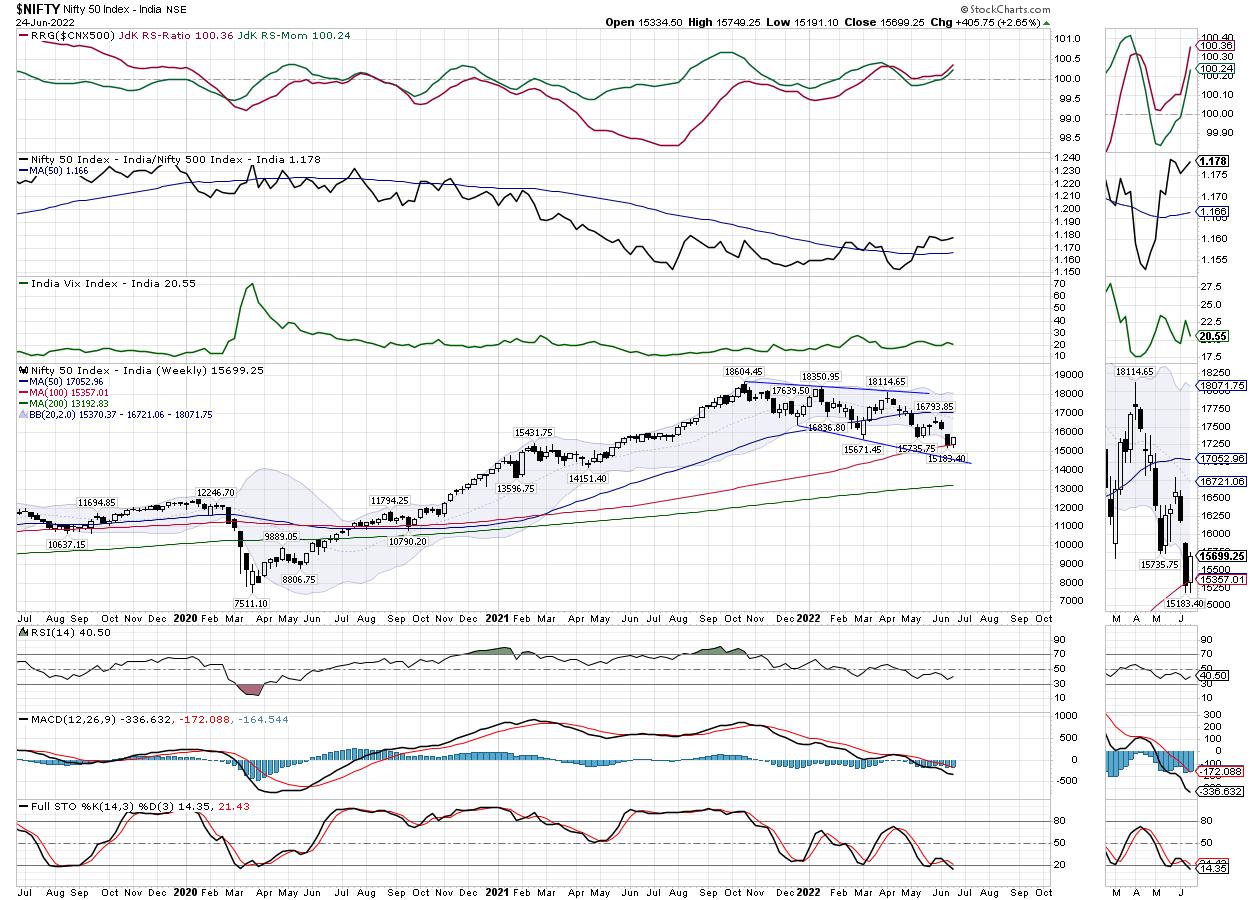
Week Ahead: Expect a Better Start for NIFTY, with This Level as an Inflection Point; Metal Index Rolls Inside Lagging Quadrant
by Milan Vaishnav,
Founder and Technical Analyst, EquityResearch.asia and ChartWizard.ae
The Indian equity markets managed to recover half of what they had lost in the earlier week. Over the past five days, the markets traded largely positive and went on to test the previous support levels that they had violated on their way down. The trading remained just as wide;...
READ MORE
MEMBERS ONLY
All Eyes on Technology Stocks

by David Keller,
President and Chief Strategist, Sierra Alpha Research
Most of my conversations this week on The Final Barwere related to the tactical upswing in risk assets this week, paired with the realities of a long-term bear market phase.At what point does the market rally enough that a short-term gain becomes more of a long-term recovery?
Well, first...
READ MORE
MEMBERS ONLY

MEM TV: Market Breadth Improves by 1,200%

by Mary Ellen McGonagle,
President, MEM Investment Research
On this episode of StockCharts TV'sThe MEM Edge, Mary Ellen shares what drove the markets higher last week, highlighting a Friday shift in outperformance that may help drive the markets higher. She also reviews heavyweight, mega-cap stocks that are trending higher.
This video was originally broadcast on June...
READ MORE
MEMBERS ONLY
Mish's Daily: Technical Bounce or New Bullish Breakout?
I woke up these headlines on my Twitter feed Friday morning: "POWELL: US HAS A VERY STRONG, WELL RECOVERED ECONOMY."
Jerome Powell said a soft landing is still "possible," but conceded recession was also a possibility in his congressional testimony last week. He noted that it...
READ MORE
MEMBERS ONLY
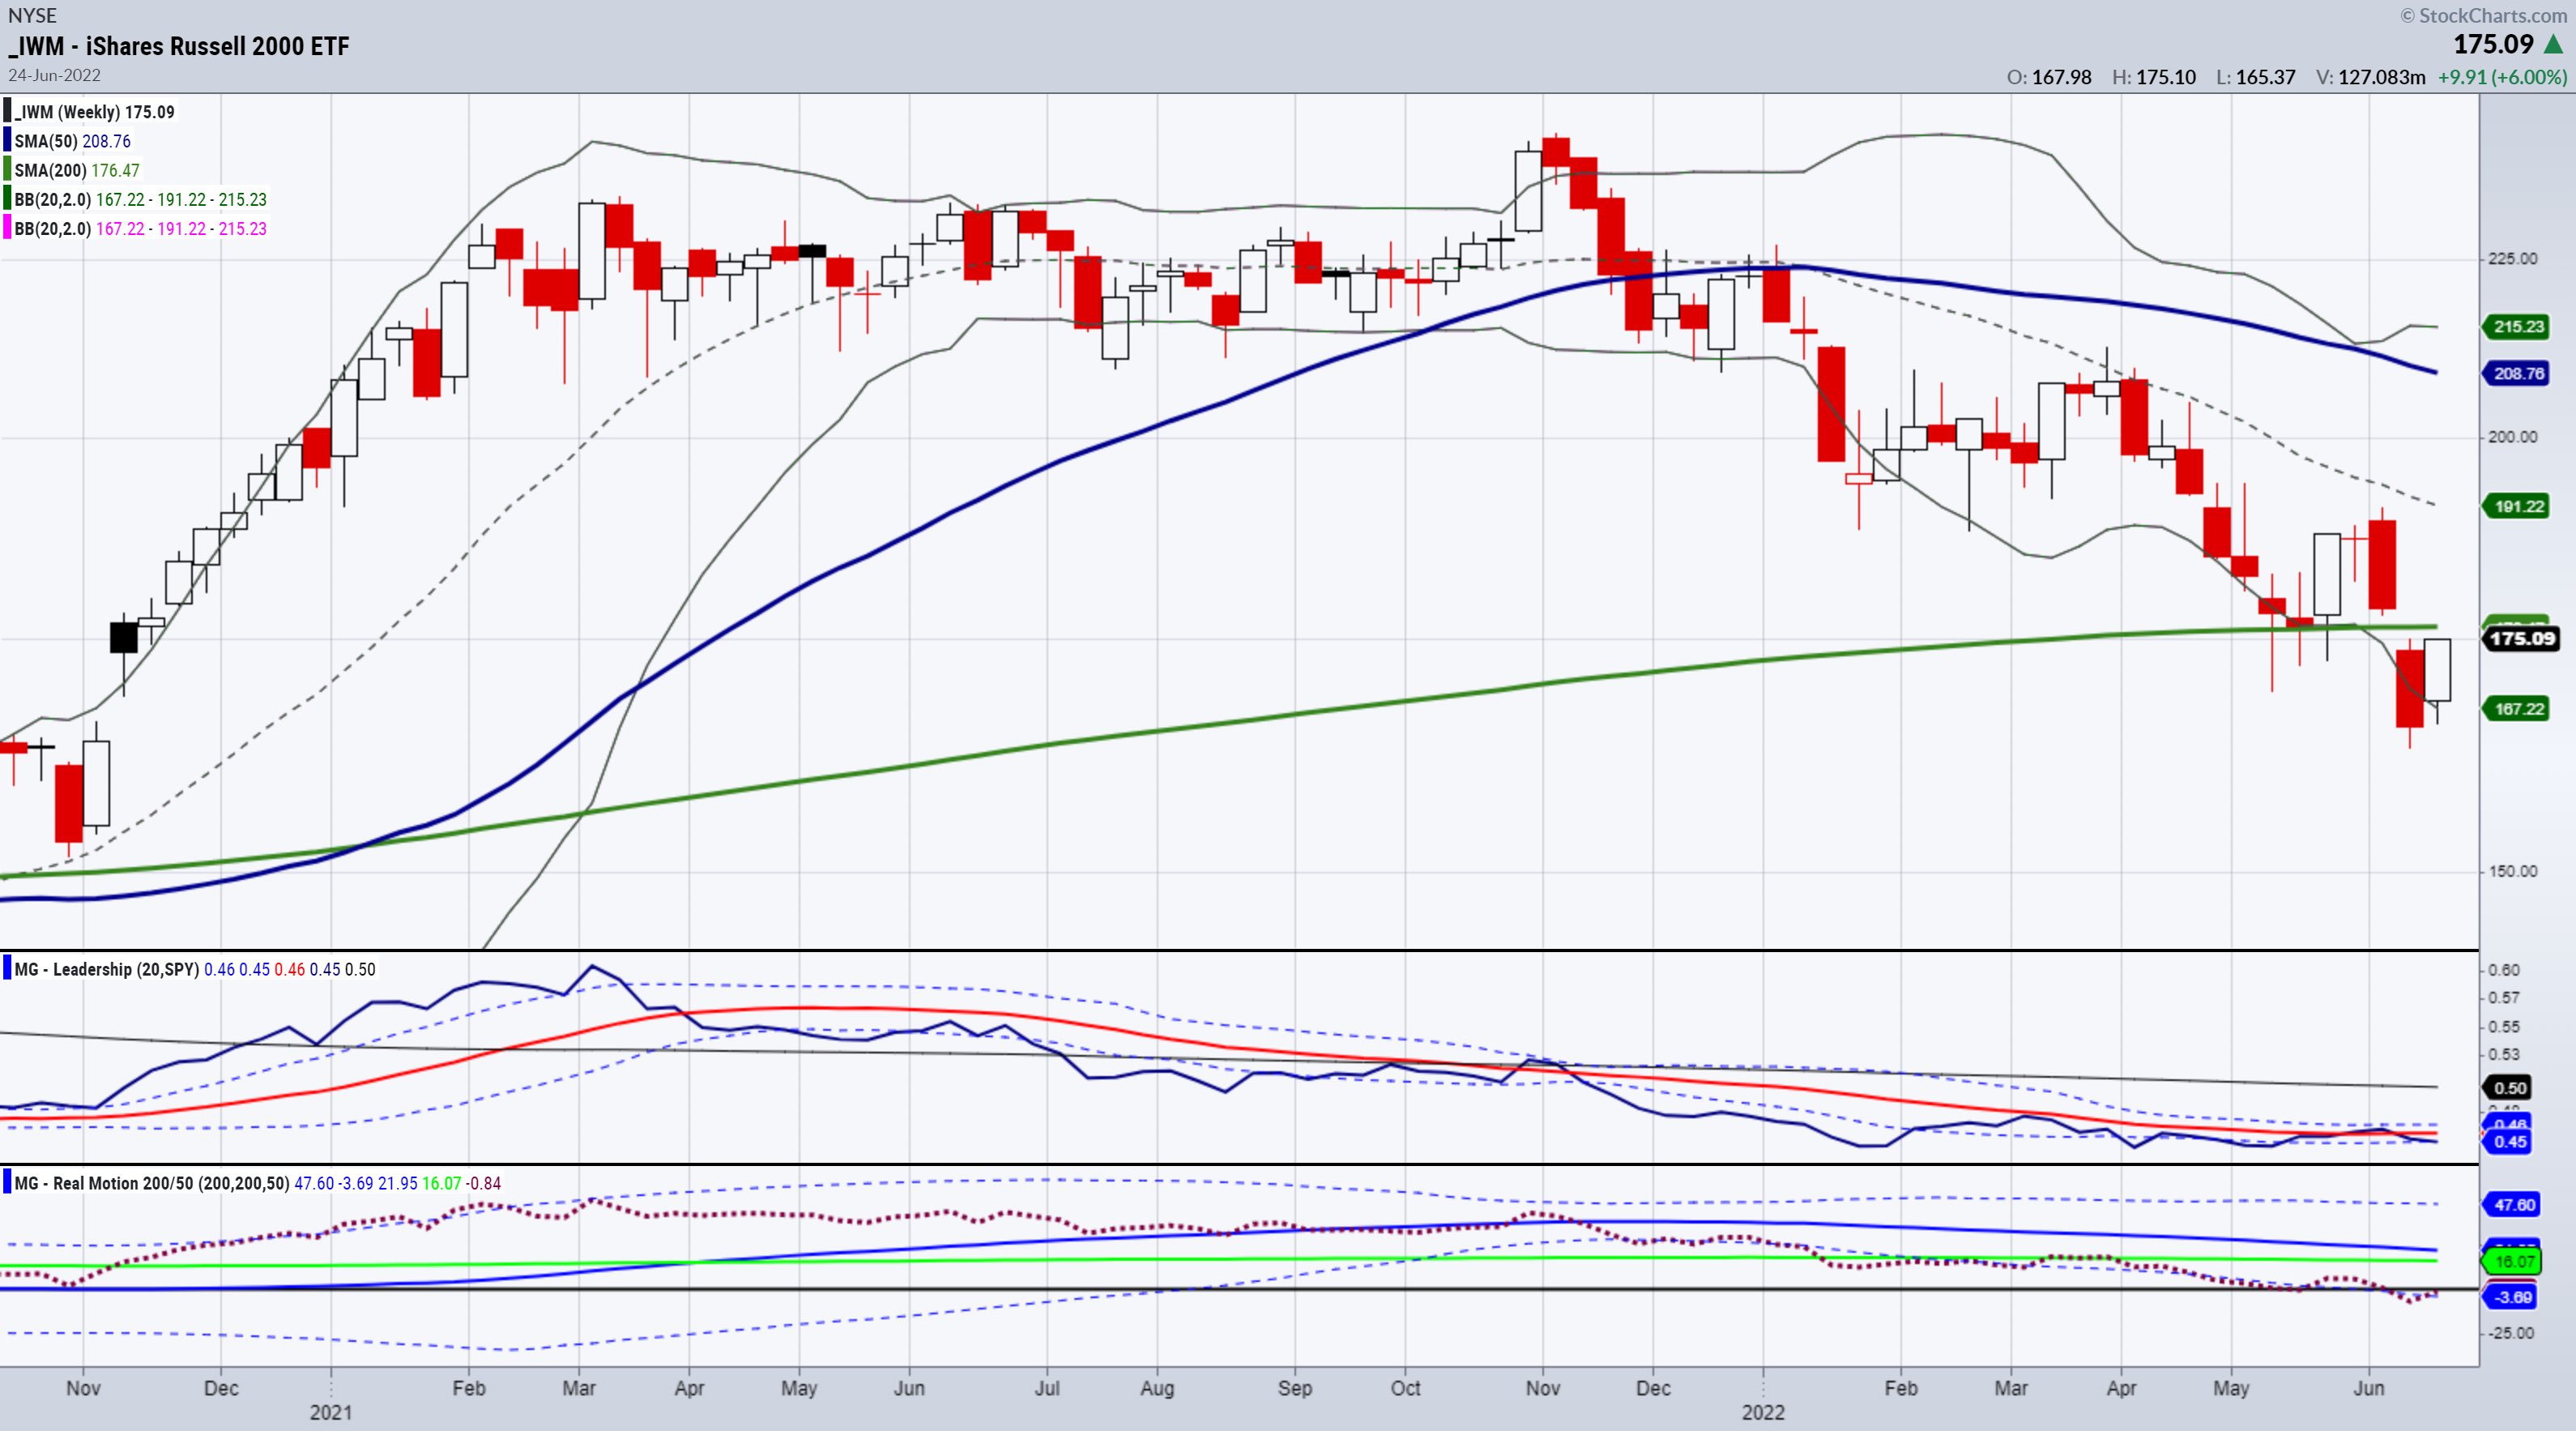
Golden Cross and Silver Cross Indexes Deeply Oversold

by Carl Swenlin,
President and Founder, DecisionPoint.com
When the 50-EMA crosses up through the 200-EMA, it is commonly known as a Golden Cross, because it infers a positive long-term price trend. Our Golden Cross Index (GCI) shows the percentage of stocks in a given index with a golden cross condition. This chart shows the GCI readings for...
READ MORE
MEMBERS ONLY
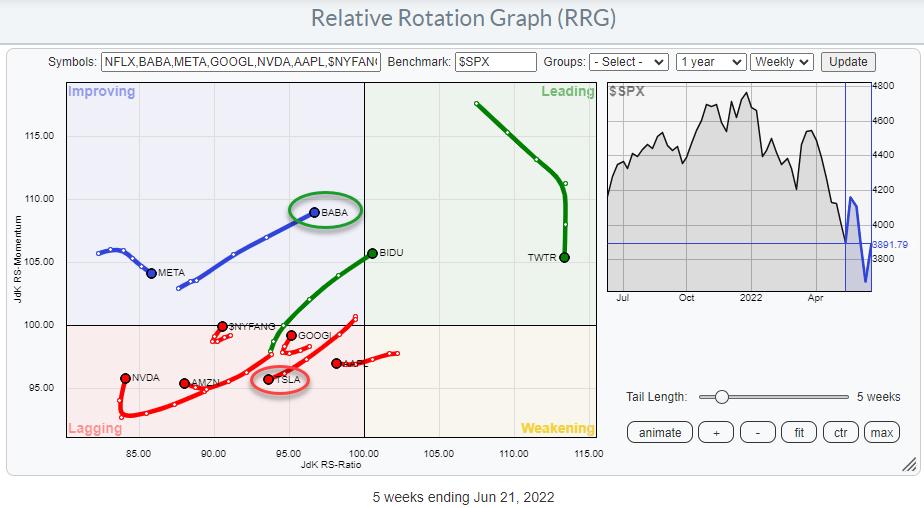
The Battle Between Musk & Ma
by Julius de Kempenaer,
Senior Technical Analyst, StockCharts.com
Following the recent bounce in the stock market, predominantly driven by growth stocks, I wanted to investigate the rotations within the NYFANG+ index (or should it be NYMANA, nowadays?). This is a group of mega-cap stocks from the technology, consumer discretionary and communication services sectors.
When we look at the...
READ MORE
MEMBERS ONLY

Commodities are Getting Hit Hard

by TG Watkins,
Director of Stocks, Simpler Trading
In this week's edition of Moxie Indicator Minutes, TG explains that, while the SPY seems like it is trying to hammer out a local bottom, other bullish areas of the market are getting hit hard. The main thing we are seeing there is that commodities are showing significant...
READ MORE
MEMBERS ONLY

Are Commodities Losing their Mojo?
by Martin Pring,
President, Pring Research
Commodities have been on a tear since their lows set in the spring of 2020, but every news outlet you tune into these days is talking about inflation, gasoline in particular. That does not mean that prices cannot go higher. Over the long-term, that's probably a realistic scenario....
READ MORE
MEMBERS ONLY

GNG TV: Defense Wins Championships

by Alex Cole,
Co-founder, GoNoGo Charts®

by Tyler Wood,
Co-founder, GoNoGo Charts®
On this week's edition of the GoNoGo Charts show, Alex and Tyler review the markets that have been struggling through the tough macro environment. Looking closely at charts of treasury yields, the U.S. Dollar and oil, on both a near-term and long-term basis, investors can see the...
READ MORE
MEMBERS ONLY
Finding Support in a Bear Market
by Joe Rabil,
President, Rabil Stock Research
On this week's edition of Stock Talk with Joe Rabil, Joe explains the importance of a Quarterly Bar Chart during a bear market. Understanding the fractal nature of the markets is key to realizing the need to expand your time frame when trends are breaking. Joe covers Bitcoin...
READ MORE
MEMBERS ONLY
Mish's Daily: Are We Heading Towards Recession?
To be clear, the economy is not currently in recession. There remains roughly $2.5 trillion in excess savings and a robust labor market, although that might be changing. Furthermore, fixed business investment is still strong and continues to bolster the economy.
But rising retail inventories and soaring domestic costs...
READ MORE
MEMBERS ONLY
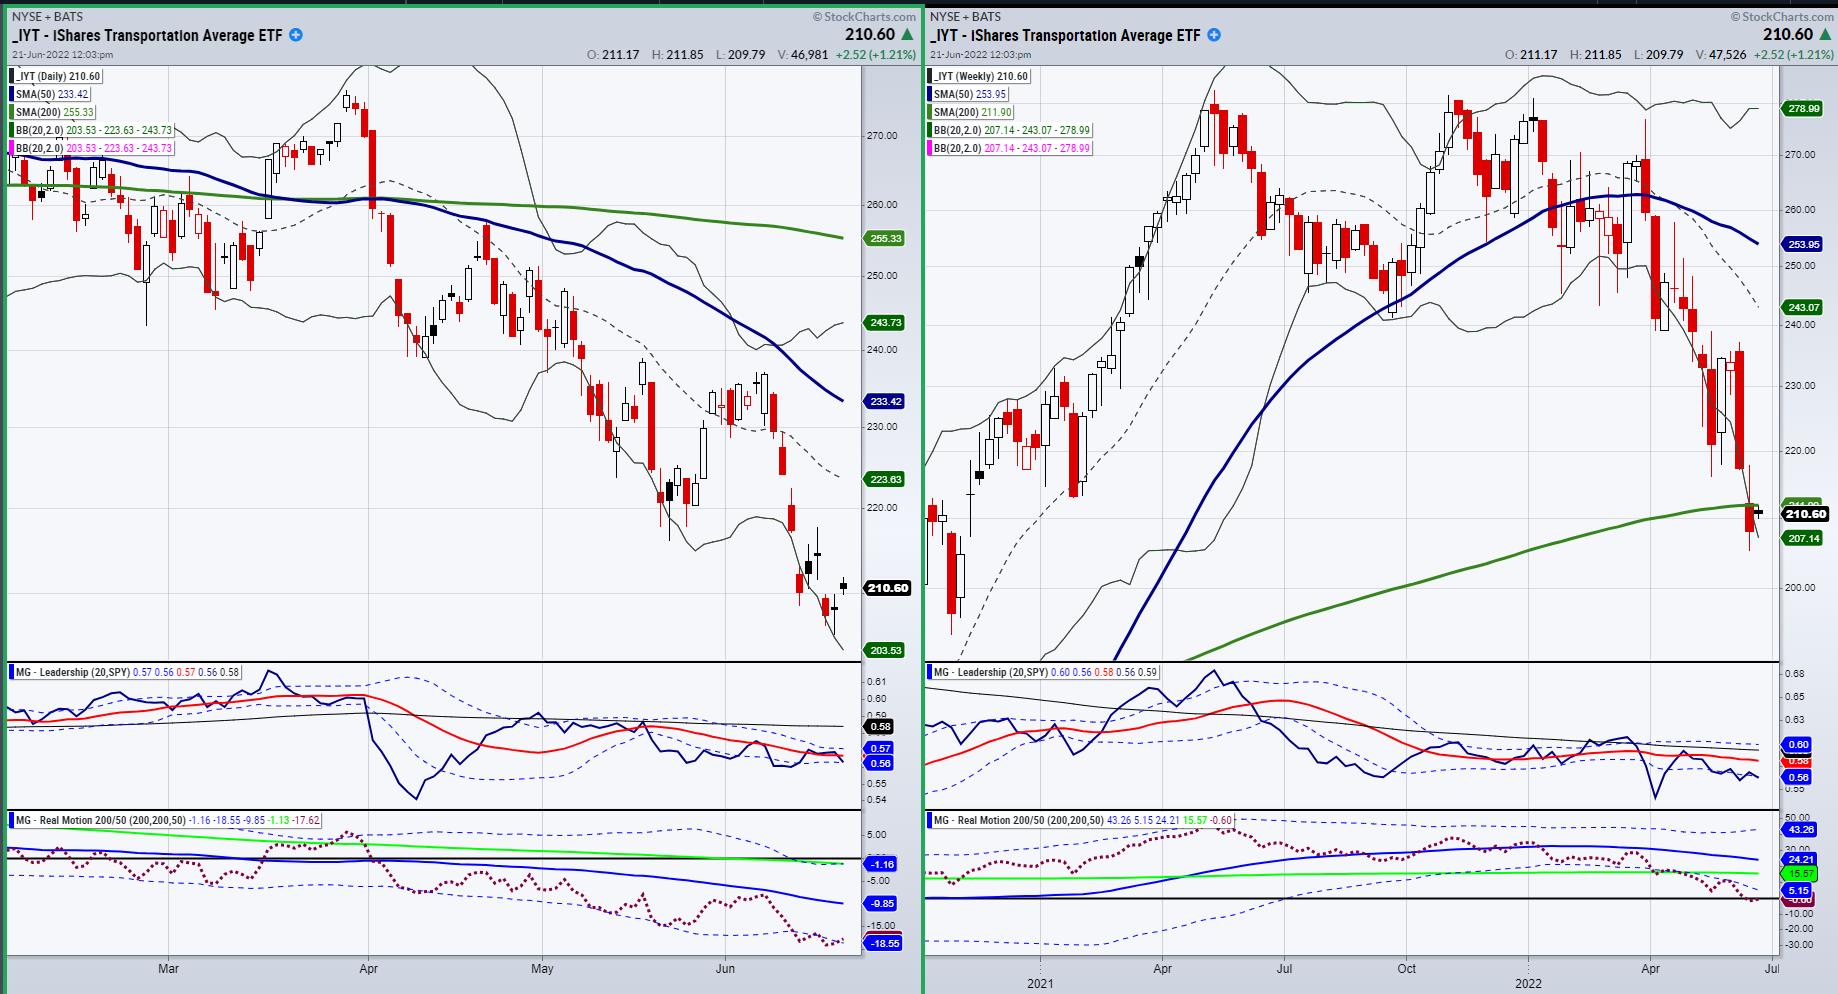
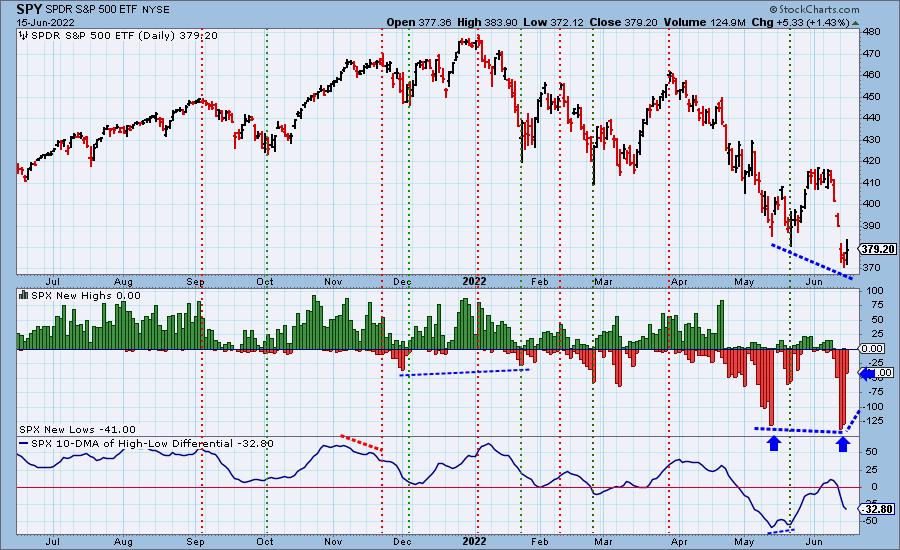
Mish's Daily: Demand Destruction as Seen in the Transportation Sector
Over the weekend, I wrote that "Looking at the SPY chart, we could be setting up for a mean reversion trade (bear market bounce that takes SPY back to 380)." I went on to write, "Granny Retail (XRT), also in a downtrend, has some good bottoming action,...
READ MORE
MEMBERS ONLY
Sector Spotlight: When Defensive Sectors Break Support...
by Julius de Kempenaer,
Senior Technical Analyst, StockCharts.com
In this edition of StockCharts TV's Sector Spotlight, I kick off the show by answering two questions from the mailbag. I then move on to the current rotation of asset classes, observing that a more pronounced pause in the turnaround for commodities seems imminent. Meanwhile, signals suggesting a...
READ MORE
MEMBERS ONLY
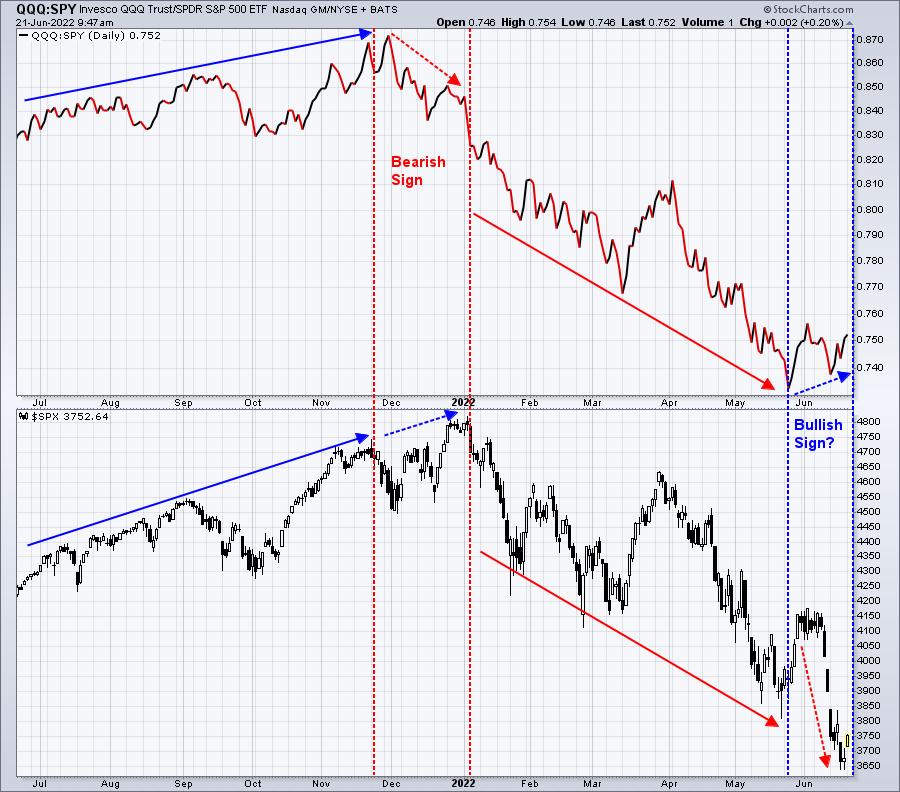
Money is Rotating Back to Growth

by Tom Bowley,
Chief Market Strategist, EarningsBeats.com
One of my favorite ratios, and it's a very simple one, is comparing NASDAQ 100 performance vs. the S&P 500 (QQQ:SPY). History tells us that the more aggressive QQQ performs better on a relative basis during bullish cycles, while the SPY performs better during bearish...
READ MORE
MEMBERS ONLY

Bear Market Blues but Trend Follower's Good News!
by Greg Morris,
Veteran Technical Analyst, Investor, and Author
Investors may have the blues right now because we find ourselves in another bear market just 17 months after recovering from the prior one. The last bear market started on 2/19/2020 and ended on 8/18/2020 and was the 6th worst bear market since 1927 (of the...
READ MORE
MEMBERS ONLY
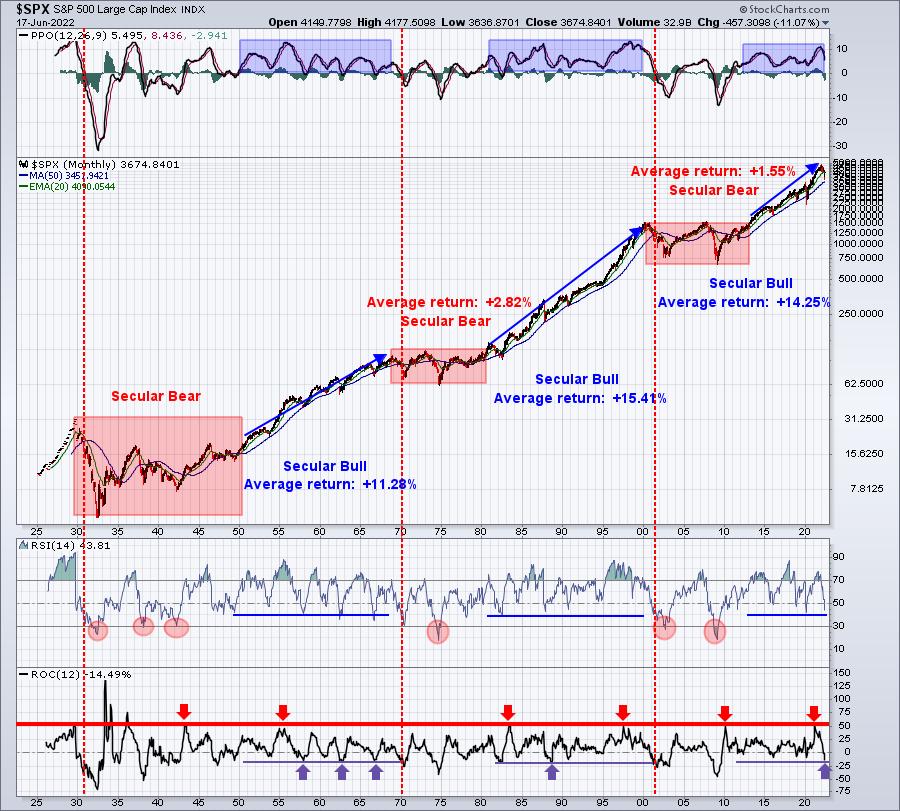
Are You Prepared For A Major Bottom? This Is It
by Tom Bowley,
Chief Market Strategist, EarningsBeats.com
I tend to be very optimistic in my view of the U.S. stock market. I think for good reason, by the way, as 54 of the last 72 years have resulted in U.S. stocks gaining ground. That means only 25% of calendar years since 1950 have resulted in...
READ MORE
MEMBERS ONLY
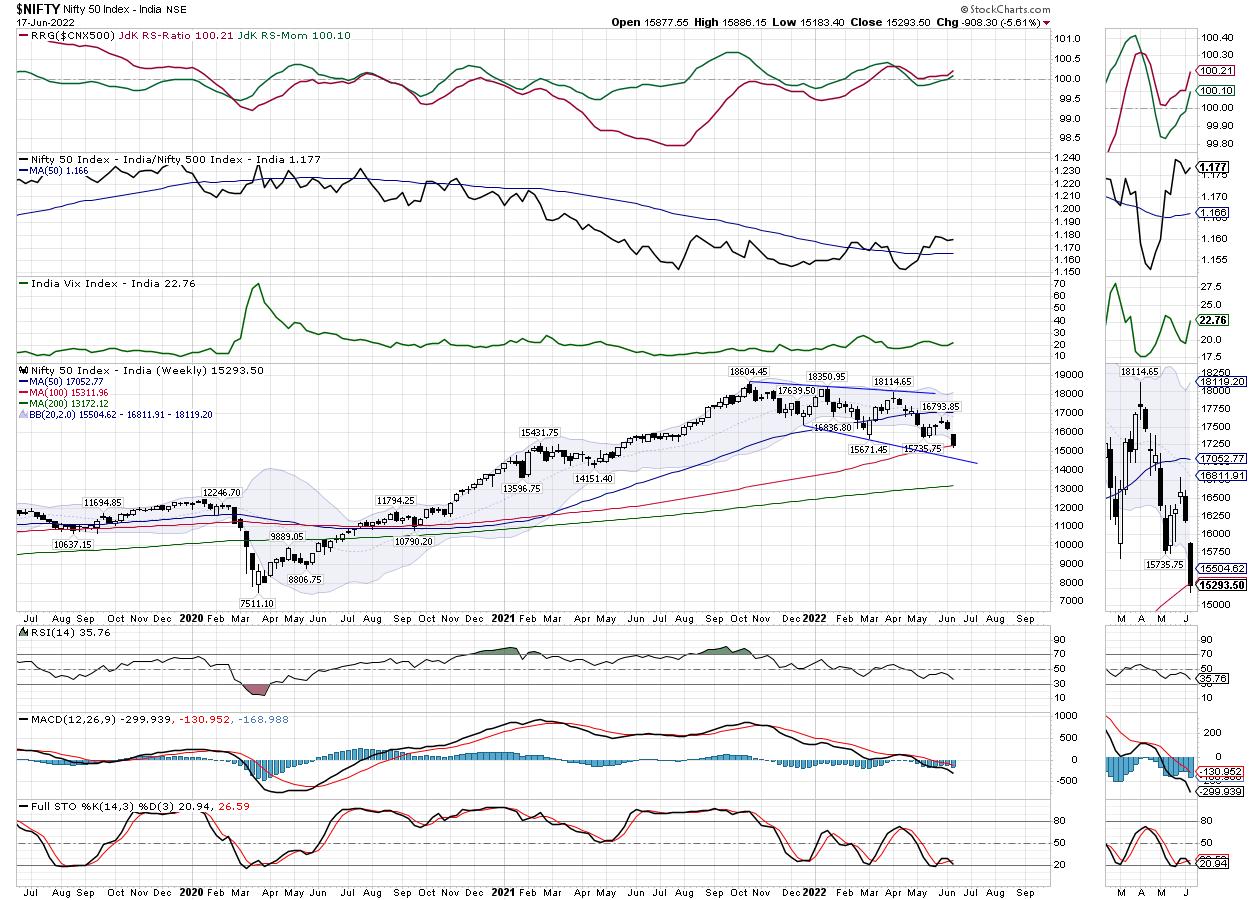
Week Ahead: NIFTY Facing Technical Pullback Despite Weak Technical Setup; Mixed Sectoral Trends
by Milan Vaishnav,
Founder and Technical Analyst, EquityResearch.asia and ChartWizard.ae
In what remained one of the worst-performing weeks for the Indian equities in the recent past, the benchmark indices suffered deep losses before ending the week on a very fractured note. All five sessions over the past five days ended in the negative; at no point in time did the...
READ MORE
MEMBERS ONLY

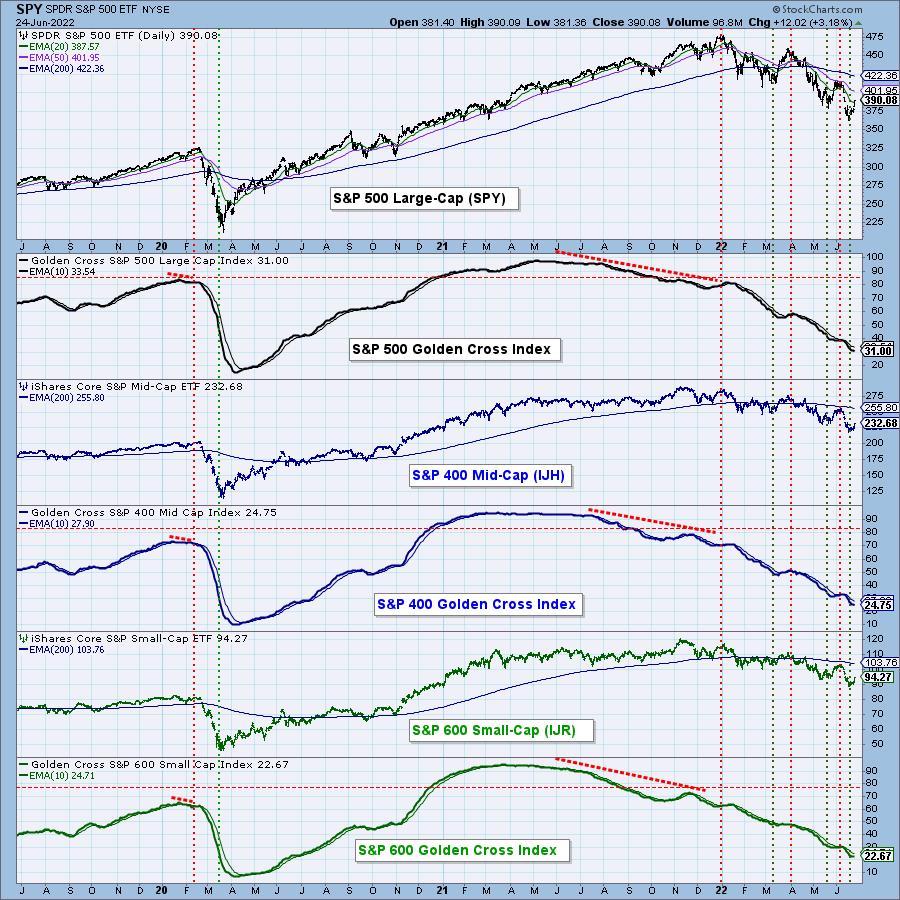
RISING BOND YIELDS HURT HOMEBUILDERS -- THAT'S HELPING MAKE CONSUMER DISCRETIONARY SECTOR THE WEAKEST PART OF THE MARKET THIS YEAR
by John Murphy,
Chief Technical Analyst, StockCharts.com
RISING RATES HURT HOMEBUILDERS... Weakness in homebuilding stocks is another sign that the U.S. economy is weakening. Rising mortgage rates which are closely tied to bond yields have a lot to do with that. The brown weekly bars in Chart 1 show the U.S. Home Construction iShares (ITB)...
READ MORE
MEMBERS ONLY

Of 90 Industry Groups, Only TWO Have Rising Momentum!
by Erin Swenlin,
Vice President, DecisionPoint.com
We know it is bad out there -- we don't have to tell you that. But the technicals are now proving to us how bad it really is. Just so you know, these two industry groups' Price Momentum Oscillators (PMOs) only began rising today; so prior to...
READ MORE
MEMBERS ONLY

Looking For a Bottom? Watch RSI.
by David Keller,
President and Chief Strategist, Sierra Alpha Research
When the market is in a confirmed downtrend, which I certainly believe it is, your investor game needs to rotate from a focus on capital growth to a focus on capital preservation.As long as the trend remains negative, and the price momentum remains bearish, there is no real reason...
READ MORE
MEMBERS ONLY
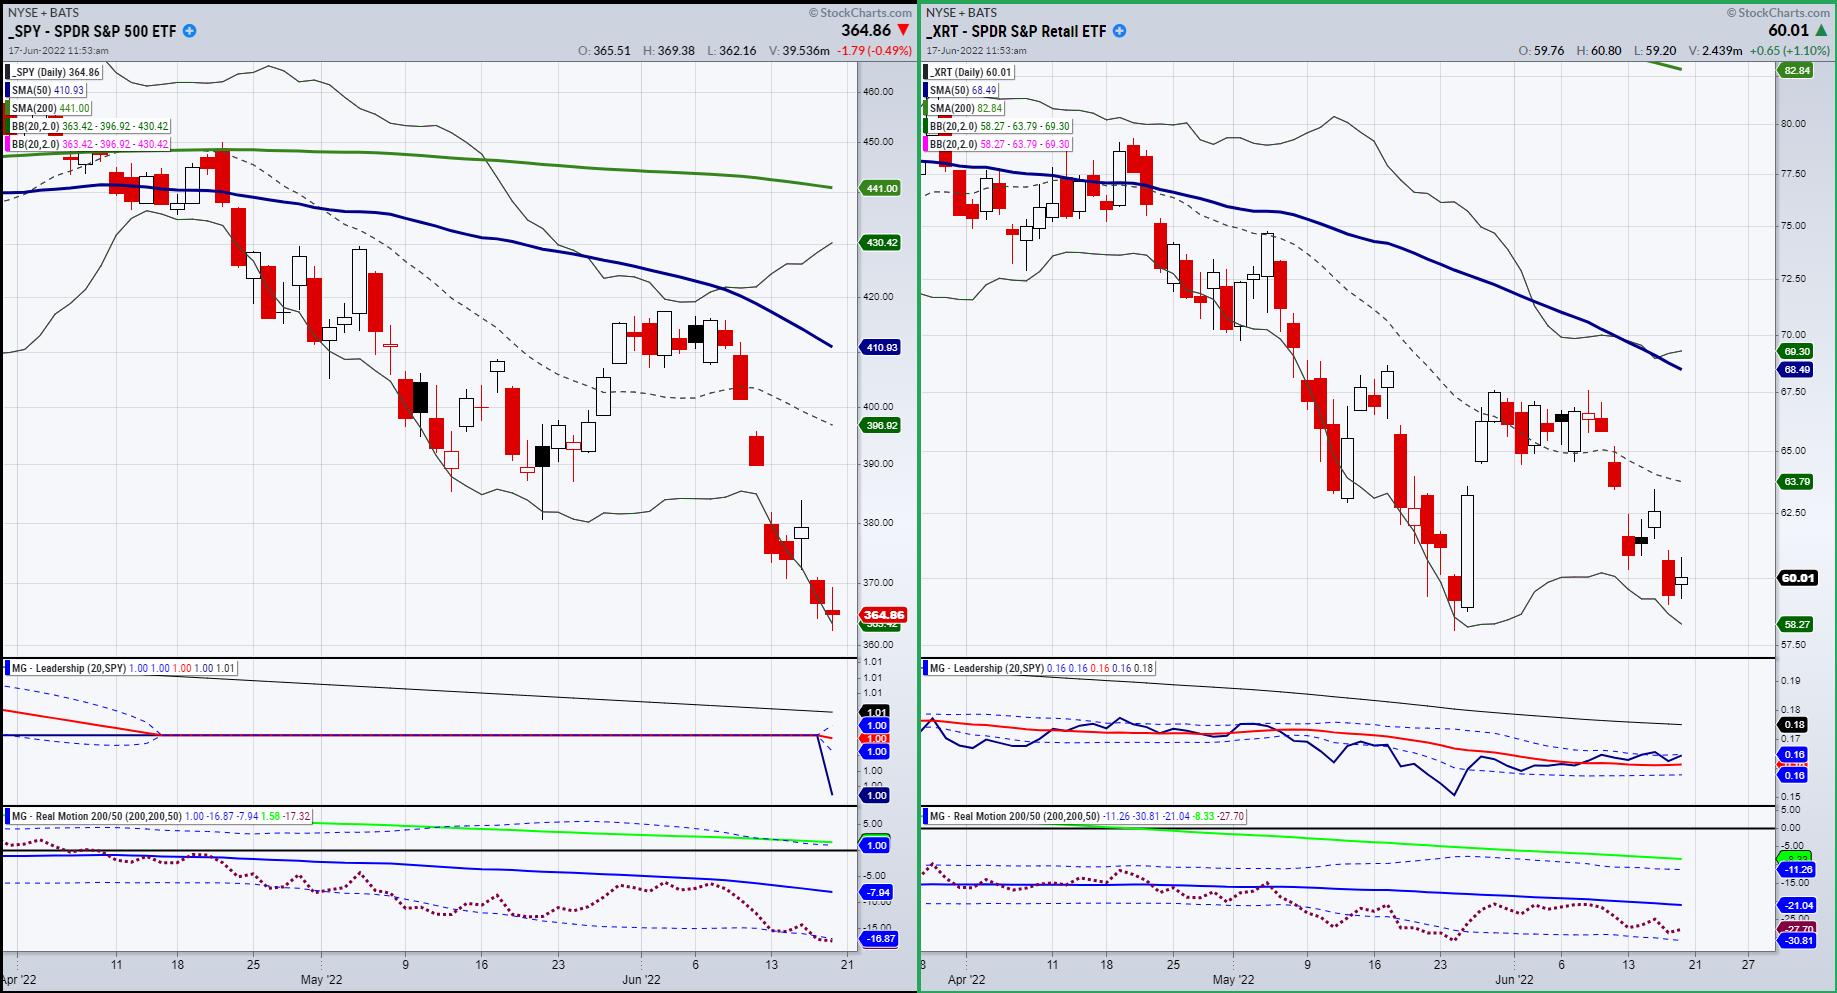
Mish's Daily: When the Trend is Not Your Friend -- A Trading Plan
Currently, if we look at the S&P 500 and the Retail Sector through XRT, our foregone conclusion is that, for the most part, equities are a huge distraction. The obvious trend is down, but is it that obvious at current levels?
Looking at the SPY chart, we could...
READ MORE
MEMBERS ONLY
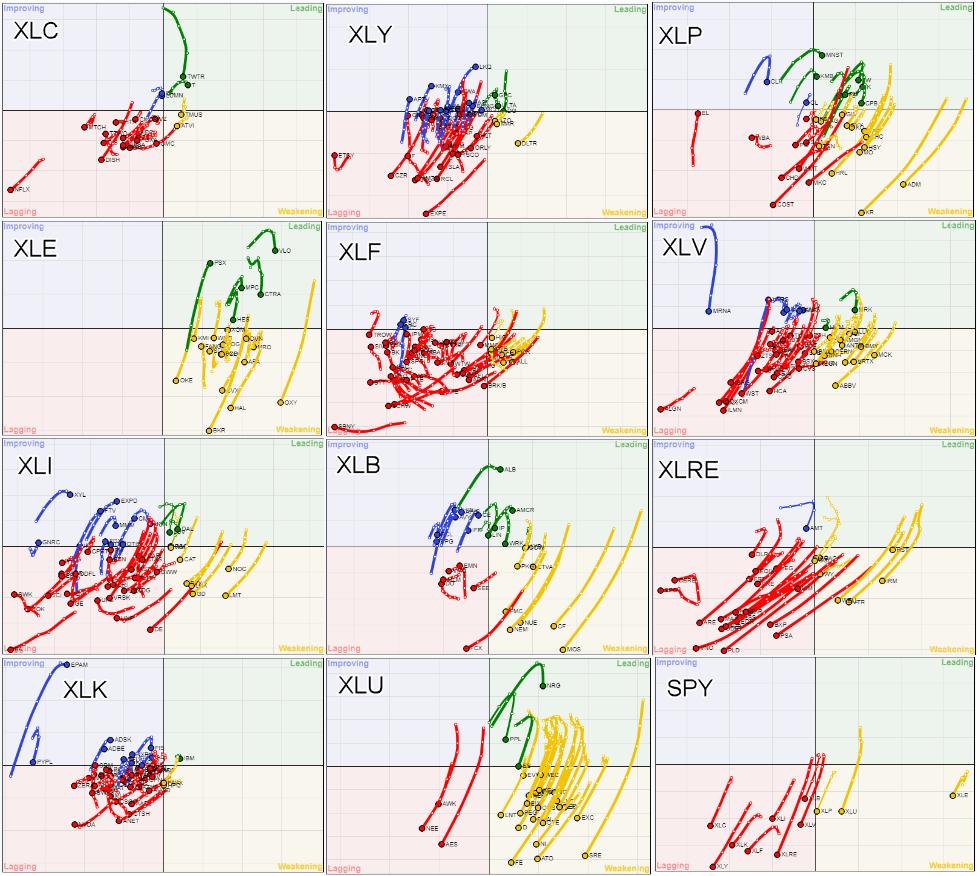
One Lone Ranger Inside the Technology Sector
by Julius de Kempenaer,
Senior Technical Analyst, StockCharts.com
In my previous article, as well as in Tuesday's Sector Spotlight show, I touched on using Relative Rotation Graphs for gauging market breadth, showing this combination chart.
This image combines 12 Relative Rotation Graphs using $ONE as the benchmark, and it tells me, and I hope you as...
READ MORE
MEMBERS ONLY
Market Doesn't Like an Aggressive Fed
by TG Watkins,
Director of Stocks, Simpler Trading
In this week's edition of Moxie Indicator Minutes, TG dives into the charts after the Fed raised rates by more than 50 bps to 75 bps. While this means the Fed is being more aggressive about inflation, it also means they are playing catch up. The VIX and...
READ MORE
MEMBERS ONLY
All Bets are Off - Positive Divergences Are Melting Away
by Erin Swenlin,
Vice President, DecisionPoint.com
Yesterday I wrote an article about positive divergences on New Lows for the Nasdaq and NYSE. The Nasdaq is still sporting its positive divergence with New Lows, but the SPX, NYSE, OEX (not shown), S&P400 (not shown) and NDX (not shown) have lost the positive divergences they had...
READ MORE
MEMBERS ONLY
GNG TV: Rally? Really? "NoGo" Strengthens in US Equities
by Alex Cole,
Co-founder, GoNoGo Charts®
by Tyler Wood,
Co-founder, GoNoGo Charts®
On this week's edition of the GoNoGo Charts show, Alex and Tyler walk through GoNoGo Charts from a top-down perspective, with special attention to US equity markets following the announcement from Federal Reserve Chairman Jerome Powell on Wednesday. The fed rate hike remained in line with Wall St....
READ MORE
MEMBERS ONLY
Make Money When Technical Analysis Fails
by Joe Rabil,
President, Rabil Stock Research
On this week's edition of Stock Talk with Joe Rabil, Joe shows a specific trade setup which takes advantage of when technical analysis fails -- specifically, the moving average crossover signal. By using 2 time frames, we can take advantage of technical failure when the conditions are right....
READ MORE
MEMBERS ONLY
Positive Divergences Between New Lows and Price Lows on NYSE and Nasdaq
by Erin Swenlin,
Vice President, DecisionPoint.com
DecisionPoint has been on a roll -- or our indicators have been, anyway. Most notably, last Wednesday, we let DP Alert subscribers know that a downturn was likely. On Thursday the market fell out of bed. We mentioned yesterday to subscribers of the DP Alert that, due to short-term indicators...
READ MORE
