MEMBERS ONLY
Best Bullish and Bearish OptionsPlay Ideas for the Week!

by Tony Zhang,
Chief Strategist, OptionsPlay
In this video, Tony shows how he starts his week with a clear technical and fundamental perspective of the stocks he's likely going to enter, and of options positions throughout the week, and how you can apply that yourself. Tony shares bullish (NVDA, DIS, SHOP) and bearish (AAPL,...
READ MORE
MEMBERS ONLY

OptionsPlay: Macro Market Outlook and Options Strategies
by Tony Zhang,
Chief Strategist, OptionsPlay
Join Tony as he walks you through a Macro Market outlook, and shares his top bearish and bullish options trading ideas. He talks growth vs. value, commodities, bonds, the Dollar Index, sectors like homebuilders and semiconductors, and stocks like NVDA, DIS, INTC, and more.
This video premiered on November 26,...
READ MORE
MEMBERS ONLY

Market Movements Today: Investors Rejoice as Stocks Rally, Bitcoin and Gold Backslide

by Jayanthi Gopalakrishnan,
Director of Site Content, StockCharts.com
KEY TAKEAWAYS
* Stocks and bond prices rallied on Monday in response to President-elect Trump's pick for Treasury Secretary.
* Gold and oil prices fell steeply as concerns of geopolitical risks ease.
* Small and mid-cap stocks were the leaders in today's equity rally.
It's a short...
READ MORE
MEMBERS ONLY

An All-Around Rally: Navigating Stocks, US Dollar, Gold, and Bitcoin Price Action
by Jayanthi Gopalakrishnan,
Director of Site Content, StockCharts.com
KEY TAKEAWAYS
* Broader equity indexes ended the week on a positive note, with small- and mid-caps gaining momentum.
* Gold regained its bullish momentum, and the US dollar surged.
* Bitcoin skyrocketed and crossed the 10K level, but closed lower.
The last full trading week before the Thanksgiving holiday has ended on...
READ MORE
MEMBERS ONLY
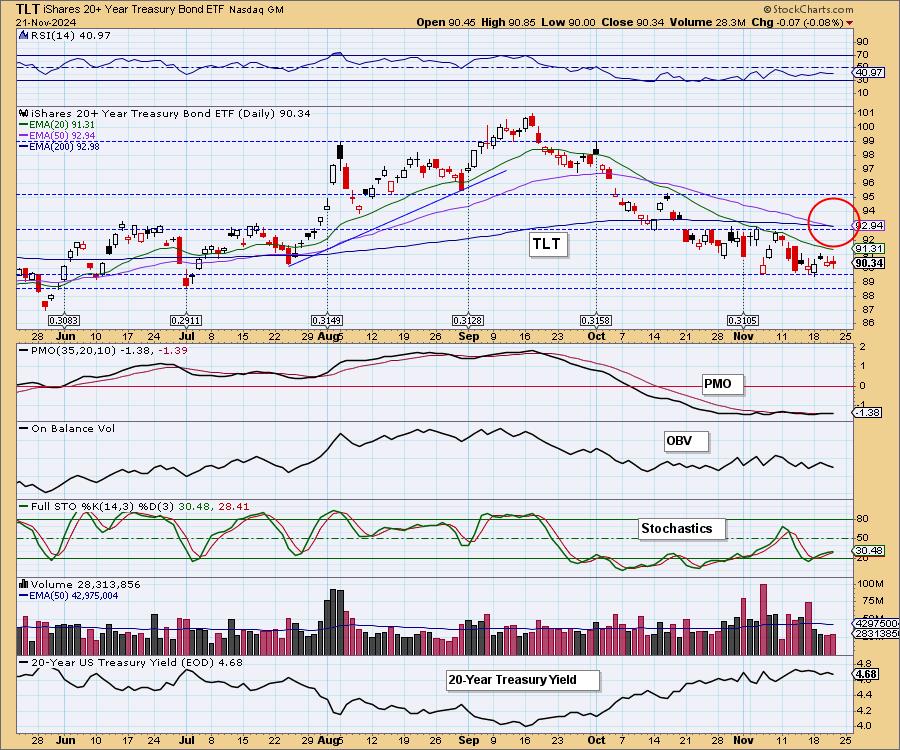
Bonds Get Death Cross SELL Signal

by Carl Swenlin,
President and Founder, DecisionPoint.com
Today, the 20-Year Bond ETF (TLT) 50-day EMA crossed down through the 200-day EMA (Death Cross), generating an LT Trend Model SELL Signal. This was the result of a downtrend lasting over two months. We note that the PMO has been running flat below the zero line for a month,...
READ MORE
MEMBERS ONLY
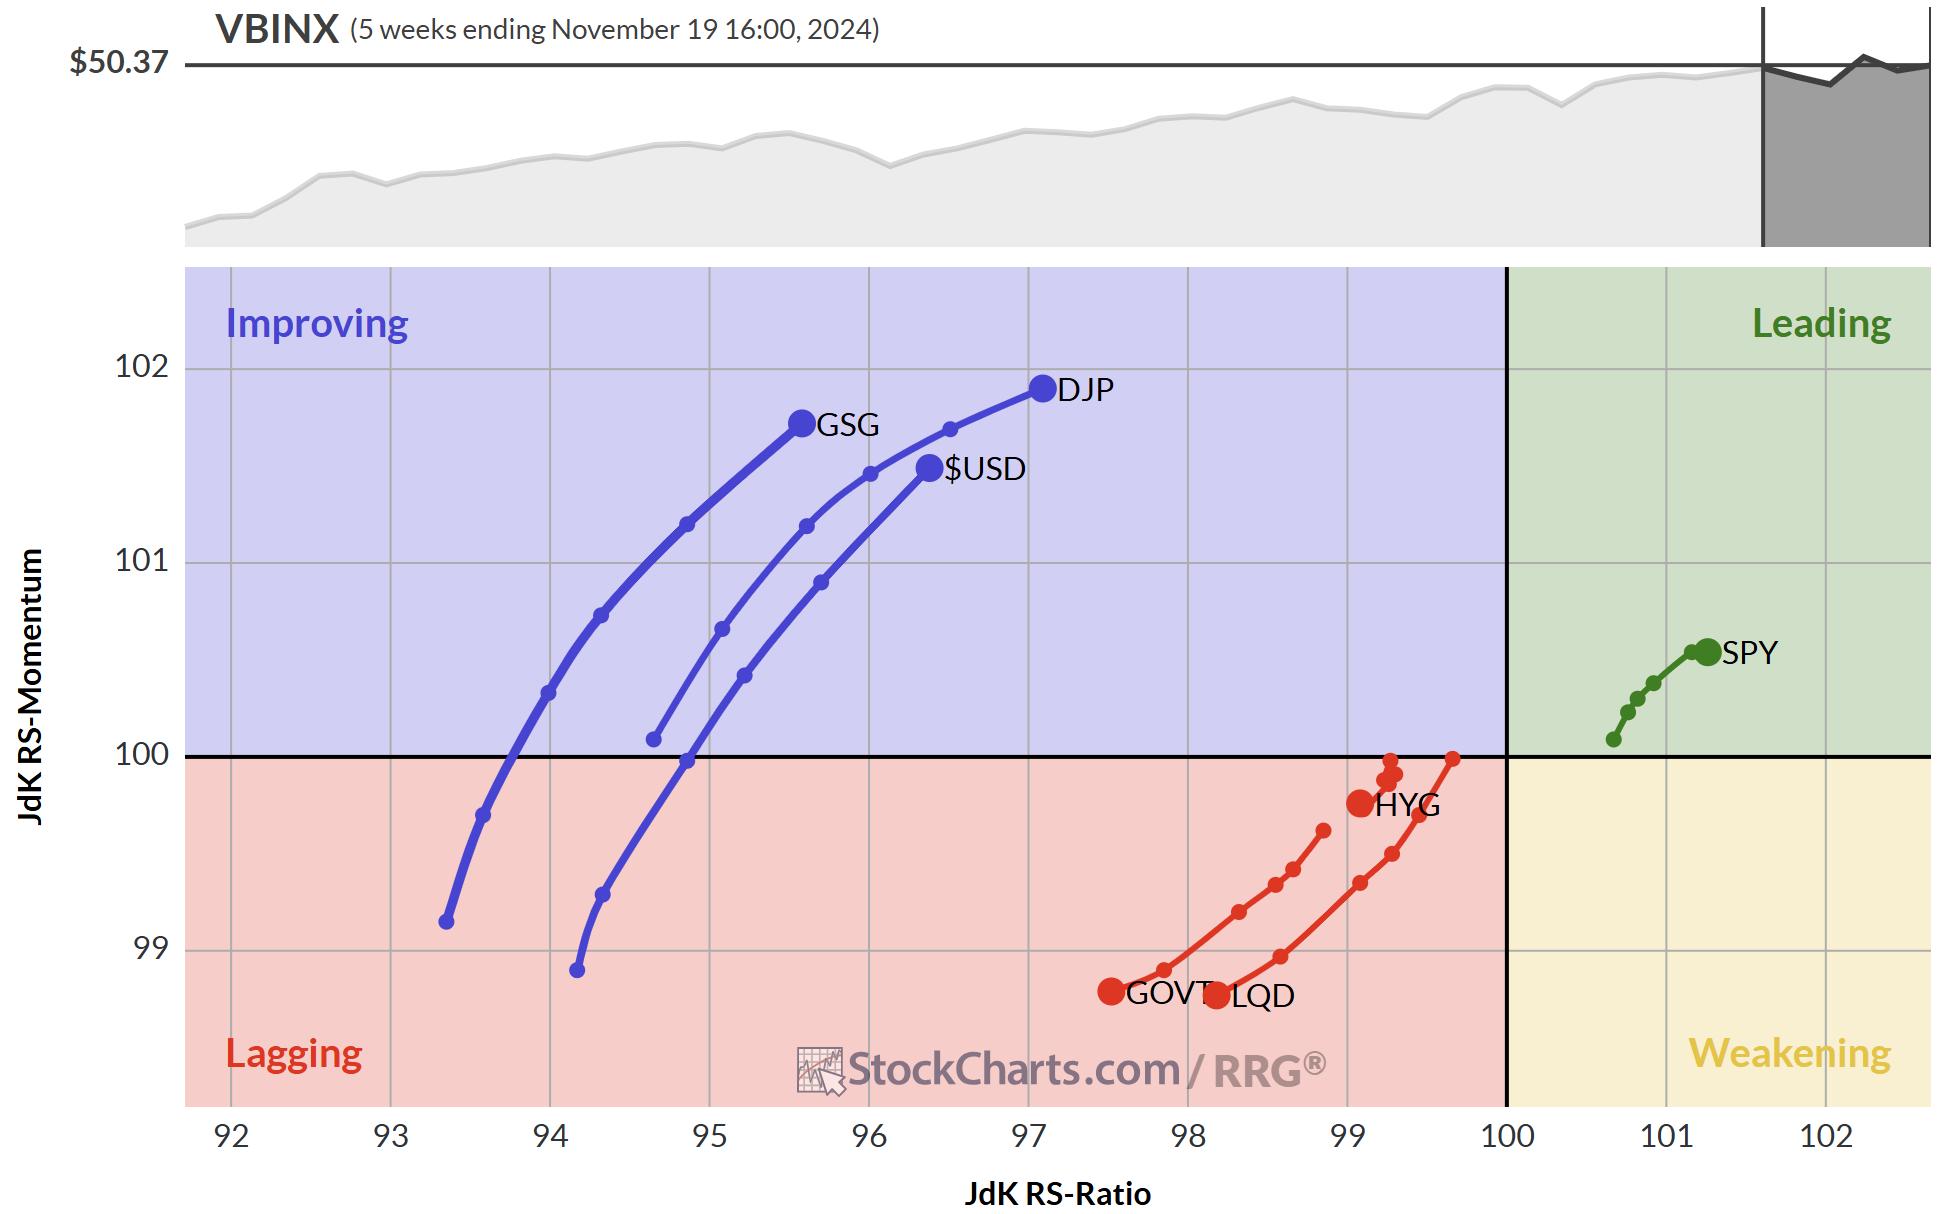
Is the USD Setting Up for a Perfect Rally?

by Julius de Kempenaer,
Senior Technical Analyst, StockCharts.com
KEY TAKEAWAYS
* Despite a lot of turmoil, SPY continues to show strong rotations on both weekly and daily RRGs.
* Rising yields have not damaged the stock rally yet.
* Stock/Bond ratio remains strongly in favor of stocks.
After the election, things have hardly settled in the world. New developments in...
READ MORE
MEMBERS ONLY
Macro Market Outlook and Best Options Trade Ideas!
by Tony Zhang,
Chief Strategist, OptionsPlay
Join Tony as he walks you through a Macro Market outlook, where he shares his top bearish and bullish options trading ideas, These include Disney (DIS), Shopify (SHOP), Intel (INTC), Adobe (ADBE), and Apple (AAPL). He explores growth vs. value, current sector rotation, key earnings, and more.
This video premiered...
READ MORE
MEMBERS ONLY

It's GAME ON for These Stocks

by Joe Rabil,
President, Rabil Stock Research
In this exclusive StockCharts video, Joe shows a specific trade setup in multiple timeframes that identifies the start of an important trend. He explains the 4 keys to this setup and shows 5 examples of stocks meeting the criteria right now. Joe then covers numerous indices, commodities, 10-year Rates, and...
READ MORE
MEMBERS ONLY
A Simple Candle With BIG Meaning
by Joe Rabil,
President, Rabil Stock Research
In this exclusive StockCharts video, Joe shows a specific candlestick pattern that, when it develops at the right time, can signal the start of a new upleg. He uses NVDA, MSFT and GLD to explain how this can setup at different times and can give a timely signal to look...
READ MORE
MEMBERS ONLY
How to Trade Gaps Up (and Down) After Earnings

by Mary Ellen McGonagle,
President, MEM Investment Research
In this StockCharts TV video, Mary Ellen shares how the markets trade right before the elections, and also reviews the move in Tesla (TSLA) after reporting earnings. She shares examples of what to watch for if your stock is due to report earnings - and what to do if it...
READ MORE
MEMBERS ONLY
Election Season: Keep Calm and Optimize Your Portfolio
by Jayanthi Gopalakrishnan,
Director of Site Content, StockCharts.com
KEY TAKEAWAYS
* Tech stocks gained some ground this week after better-than-expected earnings from Tesla.
* US Treasury yields continue to rise.
* Bullish momentum keeps gold prices rising higher.
Although earnings season is in full swing, trading volume has been relatively light this week. Perhaps investors are waiting for the stock market...
READ MORE
MEMBERS ONLY
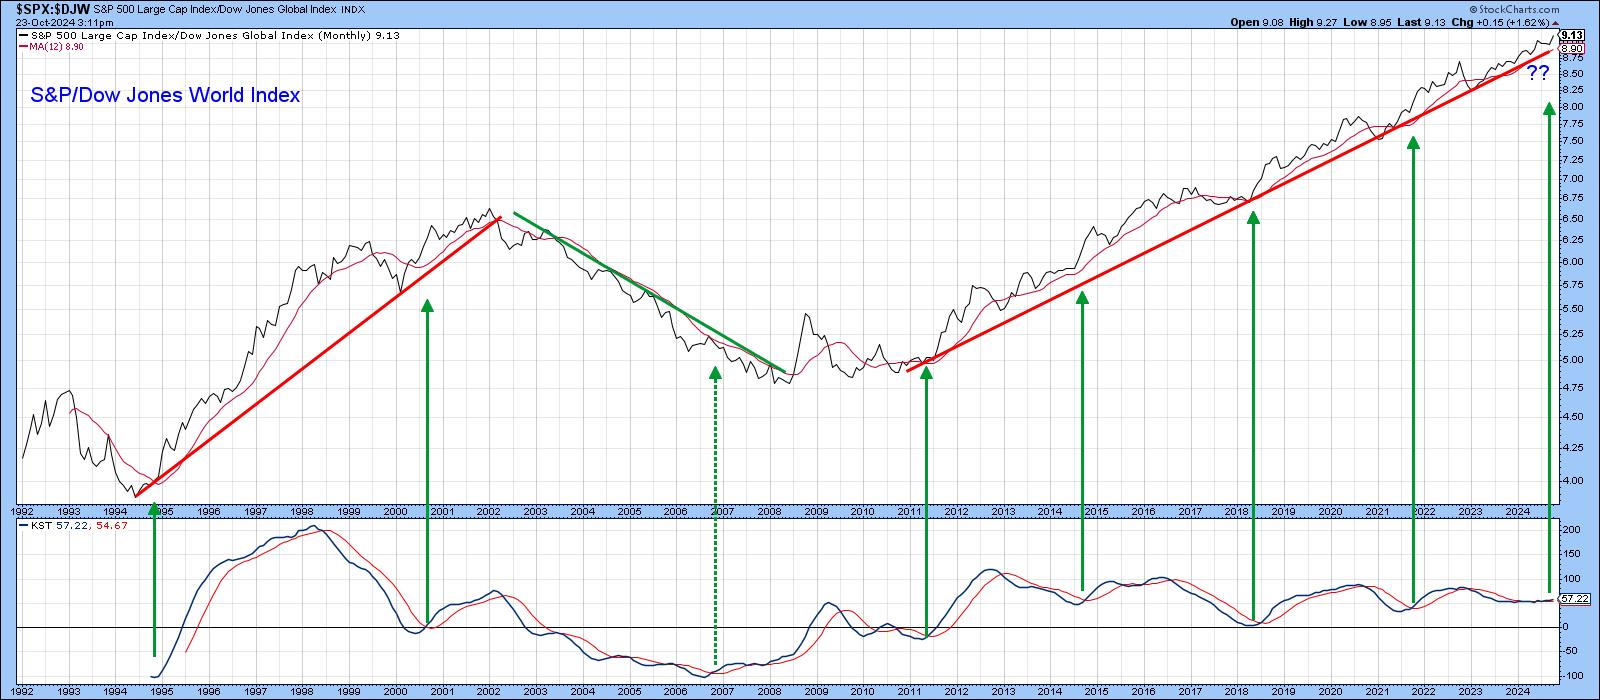
This Stock Market Will Likely Outperform the World Index, But Could Be Outshone by Something Completely Different

by Martin Pring,
President, Pring Research
Since 2011, the US stock market, represented by the S&P Composite, has outperformed the world. In the last couple of weeks or so, it has managed to break out from a trading range in its relationship with the rest of the world and looks headed even higher on...
READ MORE
MEMBERS ONLY

A Strong Week: Stocks, Gold, and Crypto's Robust Performance
by Jayanthi Gopalakrishnan,
Director of Site Content, StockCharts.com
KEY TAKEAWAYS
* The S&P 500 and Dow Jones Industrial Average closed at record highs.
* Gold prices are on fire, closing at a record high.
* Bitcoin breaks out of a consolidation pattern.
Despite a light economic data week, the stock market continued its rally, with the S&P...
READ MORE
MEMBERS ONLY

Is This Still a Bull Market? | Larry's "Family Gathering" October 18, 2024 Recording

by Larry Williams,
Veteran Investor and Author
Are we still in a bull market? That's a key question Larry considers in his final "Family Gathering" video, examining all the information available and what kind of conclusions about the state of the market we can draw from it.
Larry begins with a careful market...
READ MORE
MEMBERS ONLY
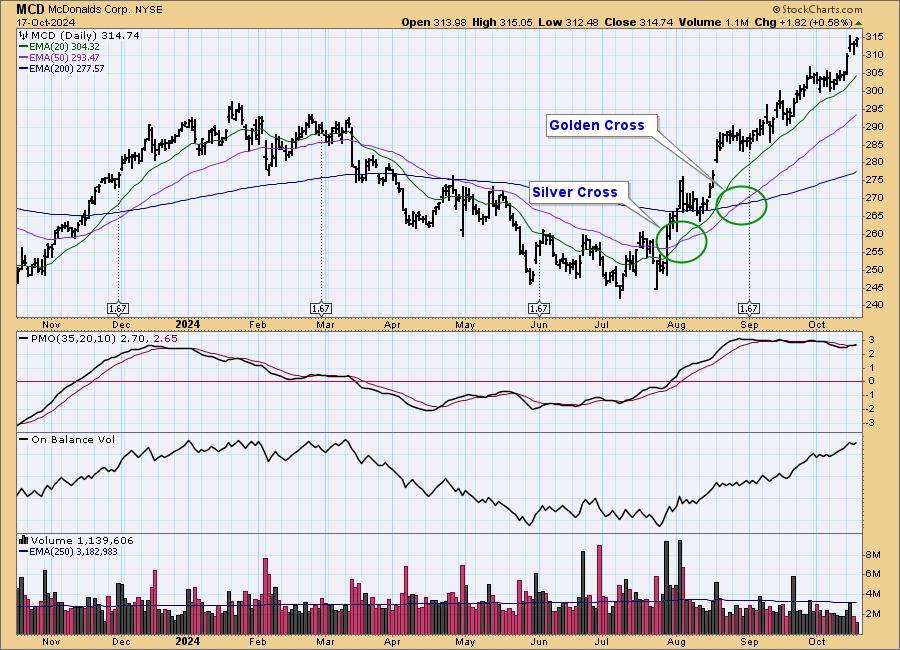
Signal Scoreboard As Good As It Gets
by Carl Swenlin,
President and Founder, DecisionPoint.com
At DecisionPoint, we track intermediate-term and long-term BUY/SELL signals on twenty-six market, sector, and industry group indexes. The long-term BUY signals are based upon the famous Golden Cross, which is when the 50-day moving average crosses up through the 200-day moving average. (We use exponential moving averages -- EMAs....
READ MORE
MEMBERS ONLY

The Next Big Move in Yields May Be Different Than You Think
by Martin Pring,
President, Pring Research
Below, Chart 1 shows a weekly plot for the 30-year yield, where we can see a perfectly formed top whose completion was followed by a negative 65-week EMA crossover. At the time of the breakdown, there were few grounds for suspecting a false break. However, in the last couple of...
READ MORE
MEMBERS ONLY

What's Wrong With This SPX Breakout?
by Joe Rabil,
President, Rabil Stock Research
In this exclusive StockCharts TV video, Joe presents the price pattern to follow the recent breakout in the S&P 500. He discusses narrow range bars, wide range bars and when they are important. Joe then explains what needs to take place now to either confirm a breakout or...
READ MORE
MEMBERS ONLY

Oil Prices Soar Amid Middle East Tensions – What's Next for Gas Prices?

by Karl Montevirgen,
The StockCharts Insider
KEY TAKEAWAYS
* Crude oil prices spiked, largely due to tensions in the Middle East.
* Gasoline prices are following crude oil prices.
* An analysis of the charts of crude oil and gasoline prices show potential trading opportunities.
Monday saw something of a bloodbath on Wall Street, with the Dow ($INDU) plunging...
READ MORE
MEMBERS ONLY

Did We Just See a False Breakdown in Crude Oil?
by Martin Pring,
President, Pring Research
Using West Texas Crude, Chart 1 features one of my favorite techniques for identifying changes in long-term trends, which is simply a PPO using the 6- and 15-month parameters. When it is above zero, it's bullish, and when below, bearish. The pink shading indicates bearish periods, and the...
READ MORE
MEMBERS ONLY
Stocks Soar, Energy Prices Spike: Are Geopolitical Tensions to Blame?
by Jayanthi Gopalakrishnan,
Director of Site Content, StockCharts.com
KEY TAKEAWAYS
* The macro picture of the US economy remains strong with the broader equity indexes in an uptrend.
* There has been some rotation in the sectors with Energy taking the lead as a result of rising crude oil prices.
* Use the StockCharts MarketCarpet to select stocks for your ChartLists....
READ MORE
MEMBERS ONLY

Gold Price Surge: What Goldman Sachs' $2,900 Forecast Means for Investors
by Karl Montevirgen,
The StockCharts Insider
KEY TAKEAWAYS
* Goldman Sachs just raised their price target for gold to $2,900 an ounce.
* Goldman Sachs' price target roughly equals $280 in SPDR Gold Shares ETF (GLD).
* GLD could have more room to run.
Here's the issue with gold: it's difficult to find...
READ MORE
MEMBERS ONLY

These 4 Chinese Stocks are Worth a Look
by Joe Rabil,
President, Rabil Stock Research
In this exclusive StockCharts TV video, Joe explains how to use two timeframes to identify 2 important characteristics of a great setup. For examples, he shares a few Chinese stocks that are showing great strength to the upside and what levels to watch for a pullback. Joe also covers the...
READ MORE
MEMBERS ONLY

With 2024 Q2 Earnings In, Market Remains Very Overvalued
by Carl Swenlin,
President and Founder, DecisionPoint.com
S&P 500 earnings are in for 2024 Q2, and here is our valuation analysis.
The following chart shows the normal value range of the S&P 500 Index, indicating where the S&P 500 would have to be in order to have an overvalued P/E...
READ MORE
MEMBERS ONLY

Traders are Eyeing These Metals After China's Big Economic Shift: Here's What You Need to Know
by Karl Montevirgen,
The StockCharts Insider
KEY TAKEAWAYS
* Metals appear to be reacting bullishly after China injected more stimulus into its economy.
* Gold, silver, and copper are displaying unique patterns and structures.
* Keep an eye on momentum for clues as to each metal's likely move within the context of its current pattern.
China'...
READ MORE
MEMBERS ONLY

Are Lower Interest Rates Bad For Workers? | Focus on Stocks: October 2024
by Larry Williams,
Veteran Investor and Author
The common economic perception is that lower interest rates are good for business, which, in turn, means good for job growth. The following charts will turn that idea upside down and inside out. Keep in mind there is no chart fancy-dancing going on here; I am just presenting the last...
READ MORE
MEMBERS ONLY

Stock Market Regains Bullish Edge: Can Geopolitical Tensions Change Its Direction?
by Jayanthi Gopalakrishnan,
Director of Site Content, StockCharts.com
KEY TAKEAWAYS
* The stock market got an influx of positive news, bringing bullish momentum.
* The Dow Jones Industrial Average closed at a record high on Friday.
* Investors are rotating out of mega-cap tech stocks and into other areas such as precious metals, as well as China-related stocks and ETFs.
There&...
READ MORE
MEMBERS ONLY

China Stimulus Energizes Stocks, Commodities; Will The Energy Sink?
by Jayanthi Gopalakrishnan,
Director of Site Content, StockCharts.com
KEY TAKEAWAYS
* Stocks, commodities, and crypto prices soared after China announced its stimulus package, but pulled back slightly after the news.
* Metal prices are still holding strong while oil prices pulled back.
* Escalating geopolitical tensions don't seem to be impacting the stock market much at the moment.
Tuesday&...
READ MORE
MEMBERS ONLY
Why the Stock Market is SO Confusing Right Now
by Julius de Kempenaer,
Senior Technical Analyst, StockCharts.com
In this video from StockCharts TV,Julius assesses current rotations in asset classes and US sectors using Relative Rotation Graphs, finding a lot of contradictory behavior. Taking a step back, he focuses on the weekly timeframe to find some more meaningful trends and shy away from day-to-day noise. He then...
READ MORE
MEMBERS ONLY

Analyzing Investor Sentiment for Gold
by Carl Swenlin,
President and Founder, DecisionPoint.com
Sentiment indicators are contrarian, meaning that when the majority of investors are bullish on a market, it is bearish for that market. Most investors are aware of several sentiment indicators that relate to the stock market, but they may not be aware that there is a sentiment indicator for gold...
READ MORE
MEMBERS ONLY

How High Can Gold Prices Go? The Tools You Need to Spot the Next Big Breakout!
by Karl Montevirgen,
The StockCharts Insider
KEY TAKEAWAYS
* Gold prices are soaring and are at an all-time high.
* Anticipated Fed rate cuts can send gold prices higher.
* There are two tools you can use to project gold price action in bullish and bearish scenarios.
As of Tuesday, the CME's FedWatch Tool gave a 67%...
READ MORE
MEMBERS ONLY

Four Intermarket Confidence Relationships that Aren't Confident
by Martin Pring,
President, Pring Research
Most of the primary trend indicators I follow are in a bullish mode and show few signs of flagging. That said, some intermarket relationships, which help to indicate whether the environment is risk-off or risk-on, have started to move in a risk-off direction. That's usually a bearish omen...
READ MORE
MEMBERS ONLY
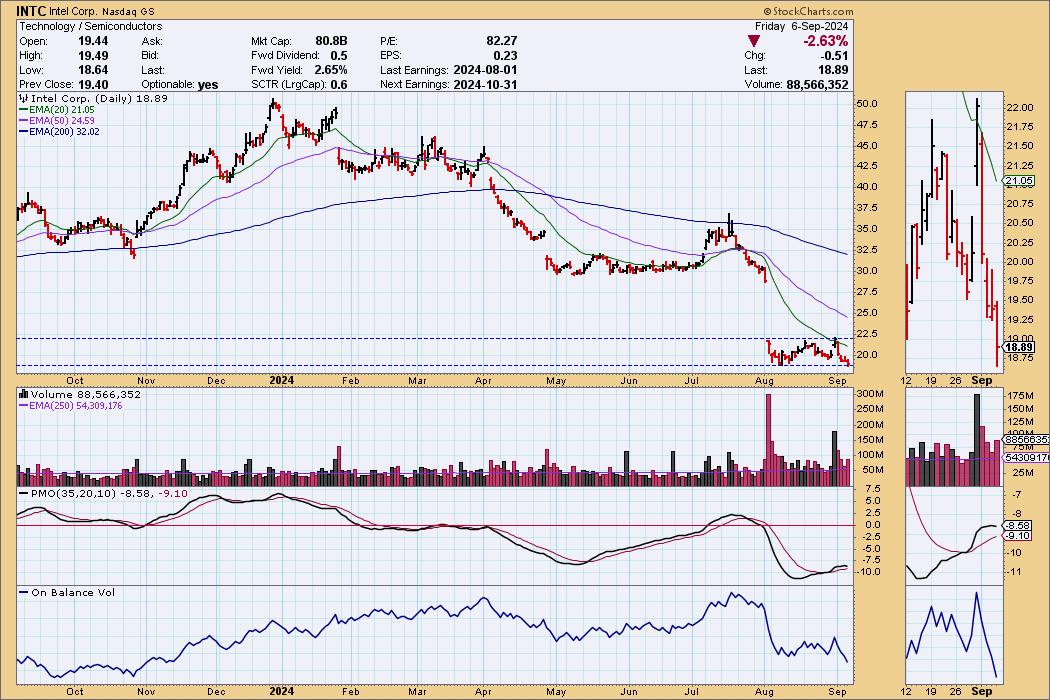
Is It Time to Buy Intel?
by Carl Swenlin,
President and Founder, DecisionPoint.com
I've been around long enough to remember when Intel (INTC) was the NVIDIA of the day. Now, INTC is under severe pressure, having suspended its dividend, and is currently being considered for removal from the Dow 30 Industrial Average. Oh, how the mighty have fallen!
With INTC having...
READ MORE
MEMBERS ONLY
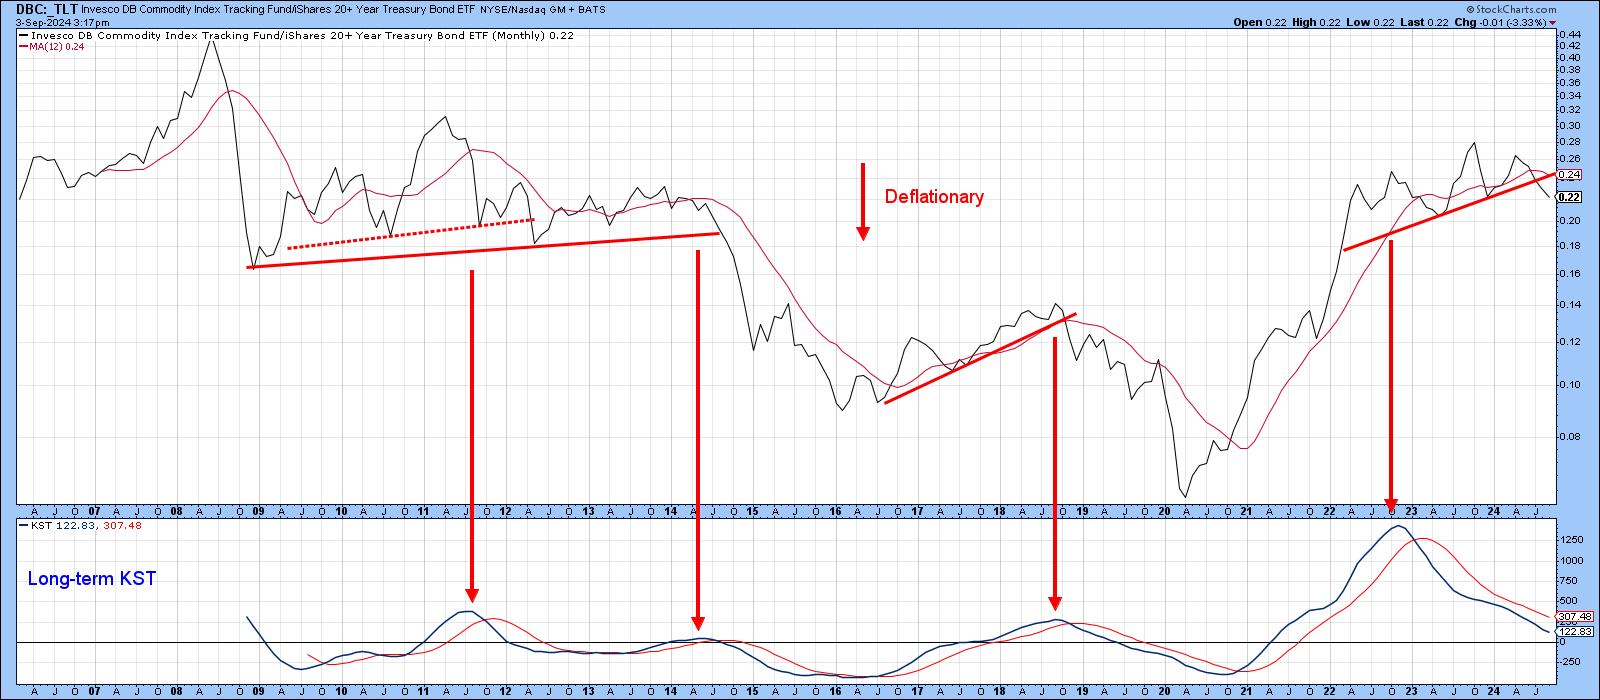
Is It Inflation or Deflation? What's in Your Wallet?
by Martin Pring,
President, Pring Research
Every business cycle has an inflationary and deflationary part, and it's very important for both traders and investors at least to try to have some understanding which has the upper hand at any particular point in time.
For example, when the economy is in a slowdown or recessionary...
READ MORE
MEMBERS ONLY

A Deeper Dive into the Dollar | Focus on Stocks: September 2024
by Larry Williams,
Veteran Investor and Author
Let's get this out of the way...
In our last Family Gathering, I announced I am doing my best to retire. That means we will have our September Family Gathering, the October newsletter and mid-month Family Gathering. After that, "Focus on Stocks" is all over.
I...
READ MORE
MEMBERS ONLY

A New Way of Forecasting Crude Oil | Larry's "Family Gathering" August 22, 2024 Recording
by Larry Williams,
Veteran Investor and Author
What to make of the market as we near the end of August? Larry presents his thoughts in this edition of the Family Gathering video.
In this month's Family Gathering video, Larry begins by presenting a new way of forecasting for Crude Oil. After that, he follows up...
READ MORE
MEMBERS ONLY
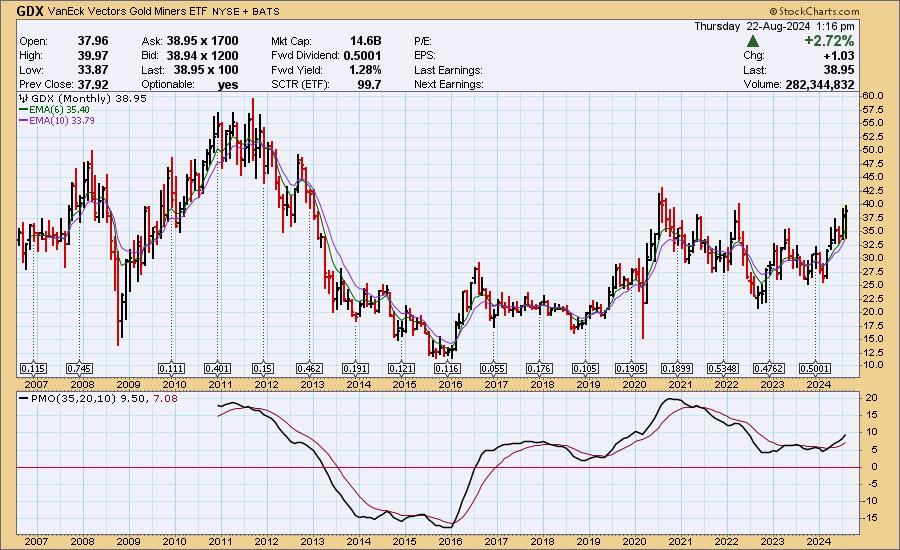
Gold Miners' Performance vs. Gold -- Does It Say Sell Gold?
by Carl Swenlin,
President and Founder, DecisionPoint.com
In Monday's DecisionPoint Trading Room video, we were asked why we cover Gold Miners (GDX) as well as Gold (GLD). There are two reasons:
1. Some people prefer to own the commodity, Gold, and others prefer to own an operating company that benefits from the price of Gold,...
READ MORE
MEMBERS ONLY

This Market is On Track for a 45-Year Breakout
by Martin Pring,
President, Pring Research
It's not very often that any market experiences a 10-year breakout, let alone a 45-year one. That, however, is what Chart 1 says is about to materialize for the inflation-adjusted gold price.
Since the chart is based on monthly data, we will not know for sure until the...
READ MORE
MEMBERS ONLY

How ADX Stage Analysis Can Make You a BETTER Trader!
by Joe Rabil,
President, Rabil Stock Research
In this exclusive StockCharts TV video, Joe shows the four stages a stock or market can be in at any time. He explains each stage and how ADX & Volatility can help define each stage. He then shows what stage the SPY is right and why the bias is still...
READ MORE
MEMBERS ONLY

The Growth Trade is Back!

by David Keller,
President and Chief Strategist, Sierra Alpha Research
In this edition of StockCharts TV'sThe Final Bar, Dave recaps an epic rally in mega cap growth stocks, with NVDA up over 6% and META threatening a new 52-week high. Dave highlights how gold and bond prices continue to rise in the face of stronger stocks, and breaks...
READ MORE
MEMBERS ONLY

CRITICAL Week Ahead for S&P 500
by Julius de Kempenaer,
Senior Technical Analyst, StockCharts.com
In this video from StockCharts TV,Julius assesses various rotations using Relative Rotation Graphs, starting at asset class level and then moving to sectors. Julius zooms in on the industries of two sectors to get an idea of where pockets of out-performance may exist in the current market. He then...
READ MORE