MEMBERS ONLY

More from Mish's Outlook 2024 -- 17 Predictions
One area I cover in the Outlook 2024 is the teachings of Raymond Lo and how he sees the upcoming Year of the Dragon. Part of my comments on his analysis is based on this statement by Lo:
"Many has the misunderstanding that the Dragon is glamorous auspicious animal...
READ MORE
MEMBERS ONLY

Sector Spotlight: Stocks vs. Bonds --The Clear Preference

by Julius de Kempenaer,
Senior Technical Analyst, StockCharts.com
On this episode of StockCharts TV's Sector Spotlight, the last one of the year 2023, I assess current rotations in asset classes, as well as US sectors. This big picture calls for a continued/renewed strength for stocks over bonds. As I observe, money is rotating out of...
READ MORE
MEMBERS ONLY

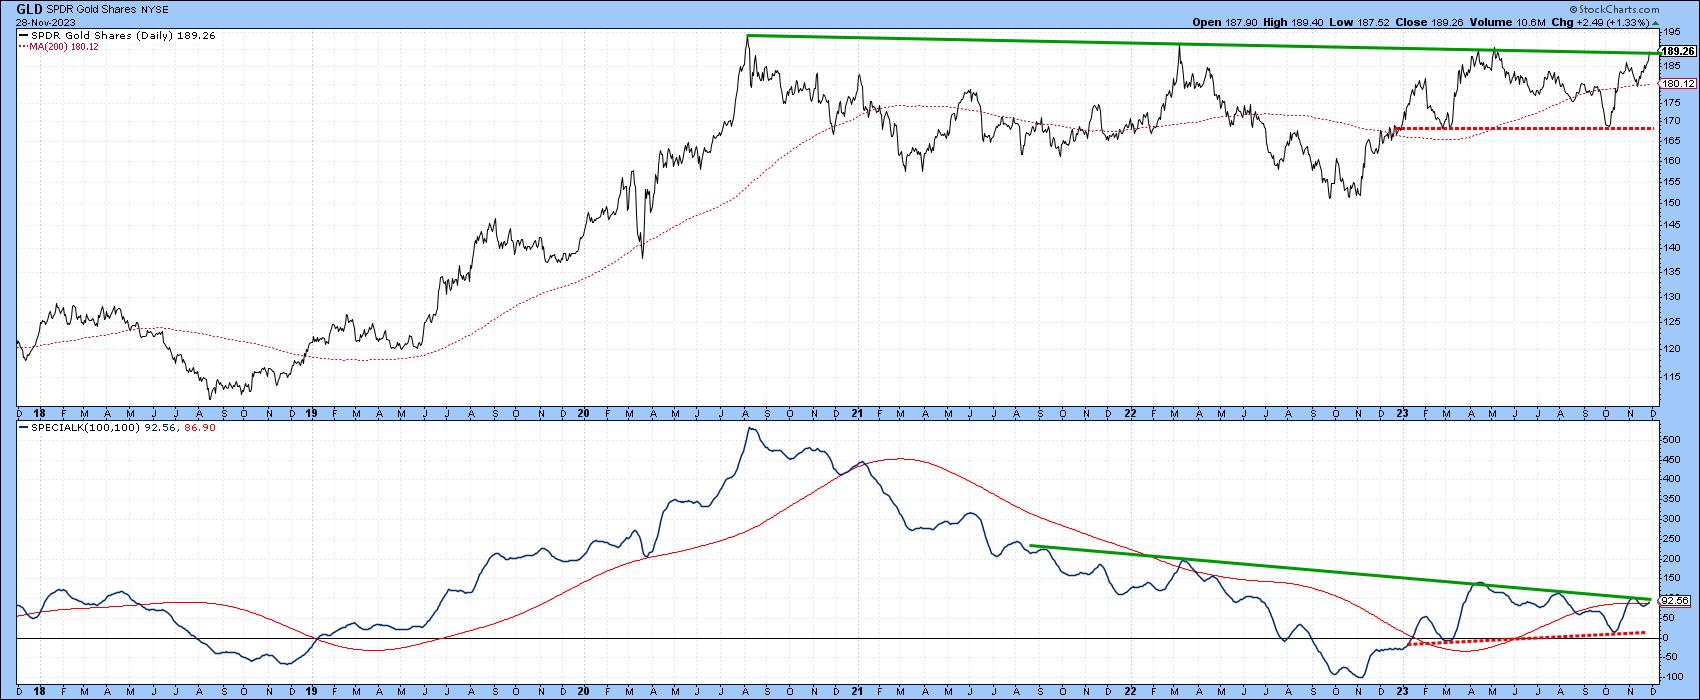
More from Mish's Outlook 2024 -- Gold and Silver
For last year's Outlook, I wrote:
Perhaps our biggest callout for a major rally in 2023 is in gold.
Here we are over $2000 and, although gold has not doubled in price, it did rise by 25%.
For 2024, we stay with our call for higher gold prices....
READ MORE
MEMBERS ONLY

GNG TV: Buying Opportunity or Trend Reversal?

by Alex Cole,
Co-founder, GoNoGo Charts®

by Tyler Wood,
Co-founder, GoNoGo Charts®
In this edition of the GoNoGo Charts show, Tyler and Alex dive into the current trends and momentum in the markets, in order to help navigate through the ever-changing landscape of stocks, bonds, commodities, and the dollar. Is the recent pullback in the S&P 500 is just a...
READ MORE
MEMBERS ONLY

Energy Sector Finally Becoming Bullish?

by Carl Swenlin,
President and Founder, DecisionPoint.com
We publish this table daily to give an overview of the market, sector, and industry group indexes we follow. The Intermediate-Term Trend Model (ITTM) BUY Signals occur when the 20-day EMA crosses up through the 50-day EMA (Silver Cross). Long-Term Trend Model (LTTM) BUY Signals occur when the 50-day EMA...
READ MORE
MEMBERS ONLY

Lift Off! Aerospace and Defense Stocks Showing Multi-Year Breakout

by David Keller,
President and Chief Strategist, Sierra Alpha Research
In this edition of StockCharts TV'sThe Final Bar, guest Jeff Huge, CMT of JWH Investment Partners highlights one industry within the Industrial sector showing a multi-year breakout, and lays out the bull case for gold in 2024. Dave reviews travel and tourism charts, speaks to the strength in...
READ MORE
MEMBERS ONLY

GNG TV: What Lies Ahead For End-of-the-Year Equities?
by Alex Cole,
Co-founder, GoNoGo Charts®
by Tyler Wood,
Co-founder, GoNoGo Charts®
In this edition of the GoNoGo Charts show, Alex and Tyler take a top-down approach to the markets as they apply the GoNoGo suite of tools to all the major asset classes. Starting with a look at macro factors effecting equity investors, they discuss the technical analysis from trend, momentum,...
READ MORE
MEMBERS ONLY

Trend Channels Help Define Stock Pullback Scenarios
by David Keller,
President and Chief Strategist, Sierra Alpha Research
In this edition of StockCharts TV'sThe Final Bar, guest Sam Burns, CFA of Mill Street Research focuses on strength in financials, weakness in crude oil, and key macro themes he'll be tracking into 2024. Meanwhile, Dave tracks the relentless upswing for Bitcoin, the pullback in gold...
READ MORE
MEMBERS ONLY

Emerging Markets vs. U.S. Markets
While December 1st brought out the bulls in nearly EVERYTHING, one area caught our attention.
In December 2019, I saw a similar chart showing an unsustainable ratio between equities and commodities, which started me on the notion that something had to give. Now that I see this chart, with emerging...
READ MORE
MEMBERS ONLY

Skepticism Over the OPEC + Oil Cuts
Despite the total cuts by all countries added at the November 30th OPEC+ meeting, oil sold off, testing key support. Countries like Angola have threatened not to stick to the new quota, promising to produce above target. Meanwhile, Brazil confirmed it will join OPEC+. That means that some of the...
READ MORE
MEMBERS ONLY

Santa Comes to Wall Street | Focus on Stocks: December 2023

by Larry Williams,
Veteran Investor and Author
Santa Comes to Wall Street
Maybe St. Nick gets into the eggnog before he visits Wall Street each year, because the trading pattern has been a step up, then a stumble down before recovering at the end of the year. I first noticed this Up-Down-Up pattern back in the early...
READ MORE
MEMBERS ONLY
Three Markets That are Right At Significant Breakout Points

by Martin Pring,
President, Pring Research
A lot of the time, I write articles that focus on markets or technical situations that should be monitored for a potential turn. This one is no different, except to say that these markets are not close to breakout points, but right at them. In short, it's fish-or-cut-bait...
READ MORE
MEMBERS ONLY

Wrong Data Gets Wrong Answers
by Carl Swenlin,
President and Founder, DecisionPoint.com
A recent article on the Business Insider site reported a set of Death Cross/Golden Cross signals on the Dow Jones Industrial Average ($INDU). Specifically, on November 13, the 50-day moving average crossed down through the 200-day moving average, commonly called a Death Cross. Two days later, the 50-day moving...
READ MORE
MEMBERS ONLY
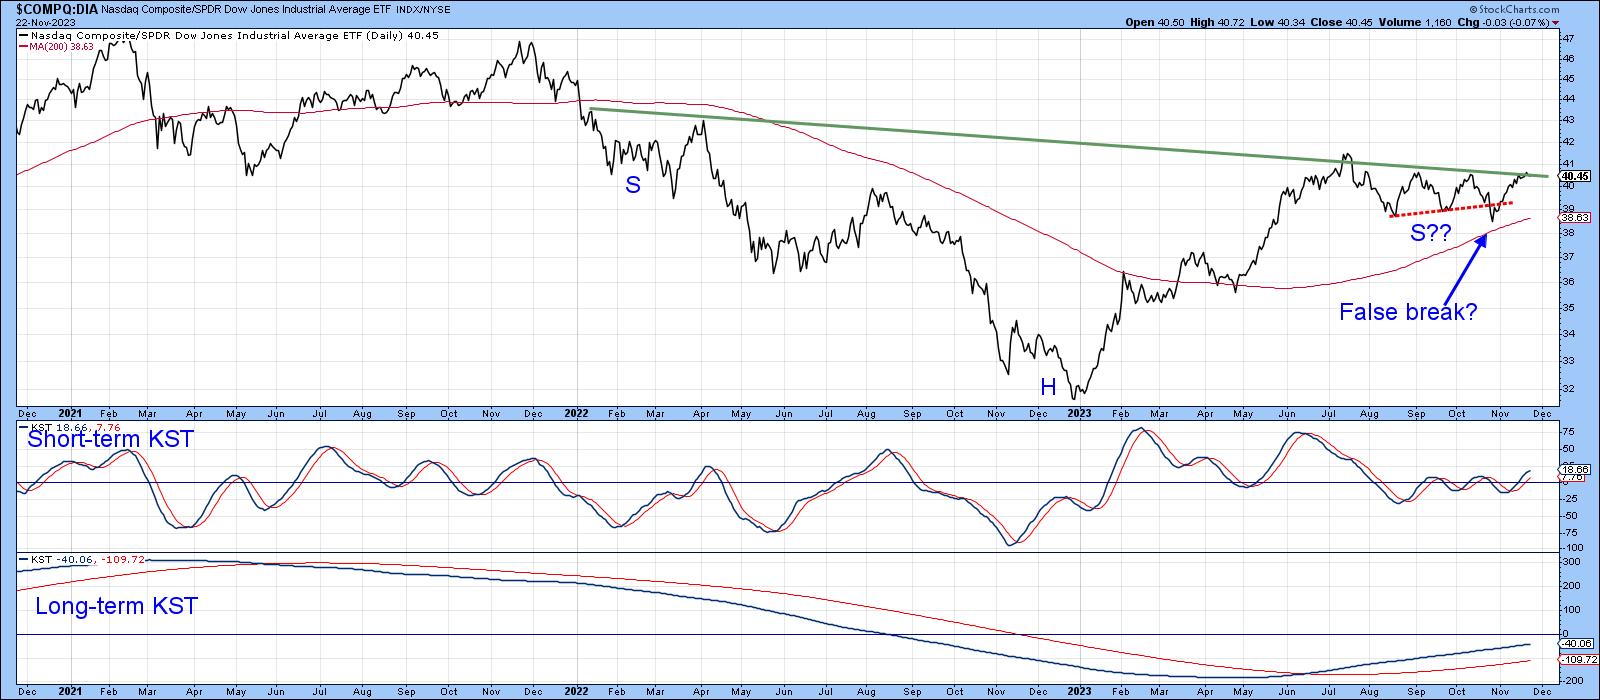
These Three Intermarket Relationships are at Key Juncture Points
by Martin Pring,
President, Pring Research
We spend a lot of time analyzing sector rotation, but there are also other relationships that can offer useful insights to internal market dynamics. One aspect of this is the relationship between market averages.
NASDAQ vs. the DJIA
As an example, Chart 1 plots the relationship between the NASDAQ Composite...
READ MORE
MEMBERS ONLY

Equity and Inflation Outlook -- Watch These Videos!
On Monday the 20th, I gave 2 interviews. The first is the clip below is from Yahoo Finance where we focus on oil and agricultural commodities.
The second interview is the Daily Briefing with Maggie Lake on Real Vision. This chart above is featured, along with:
1. Inflation thesis
2....
READ MORE
MEMBERS ONLY

Magnificent 7 Stocks Testing HUGE Resistance
by David Keller,
President and Chief Strategist, Sierra Alpha Research
In this edition of StockCharts TV'sThe Final Bar, Dave breaks down the technical setups on all of the Magnificent 7 stocks, addressing the balance between strong trends and overbought conditions. He answers viewer questions on investor sentiment, trailing stops, potential upside for TSLA, and the latest thinking on...
READ MORE
MEMBERS ONLY

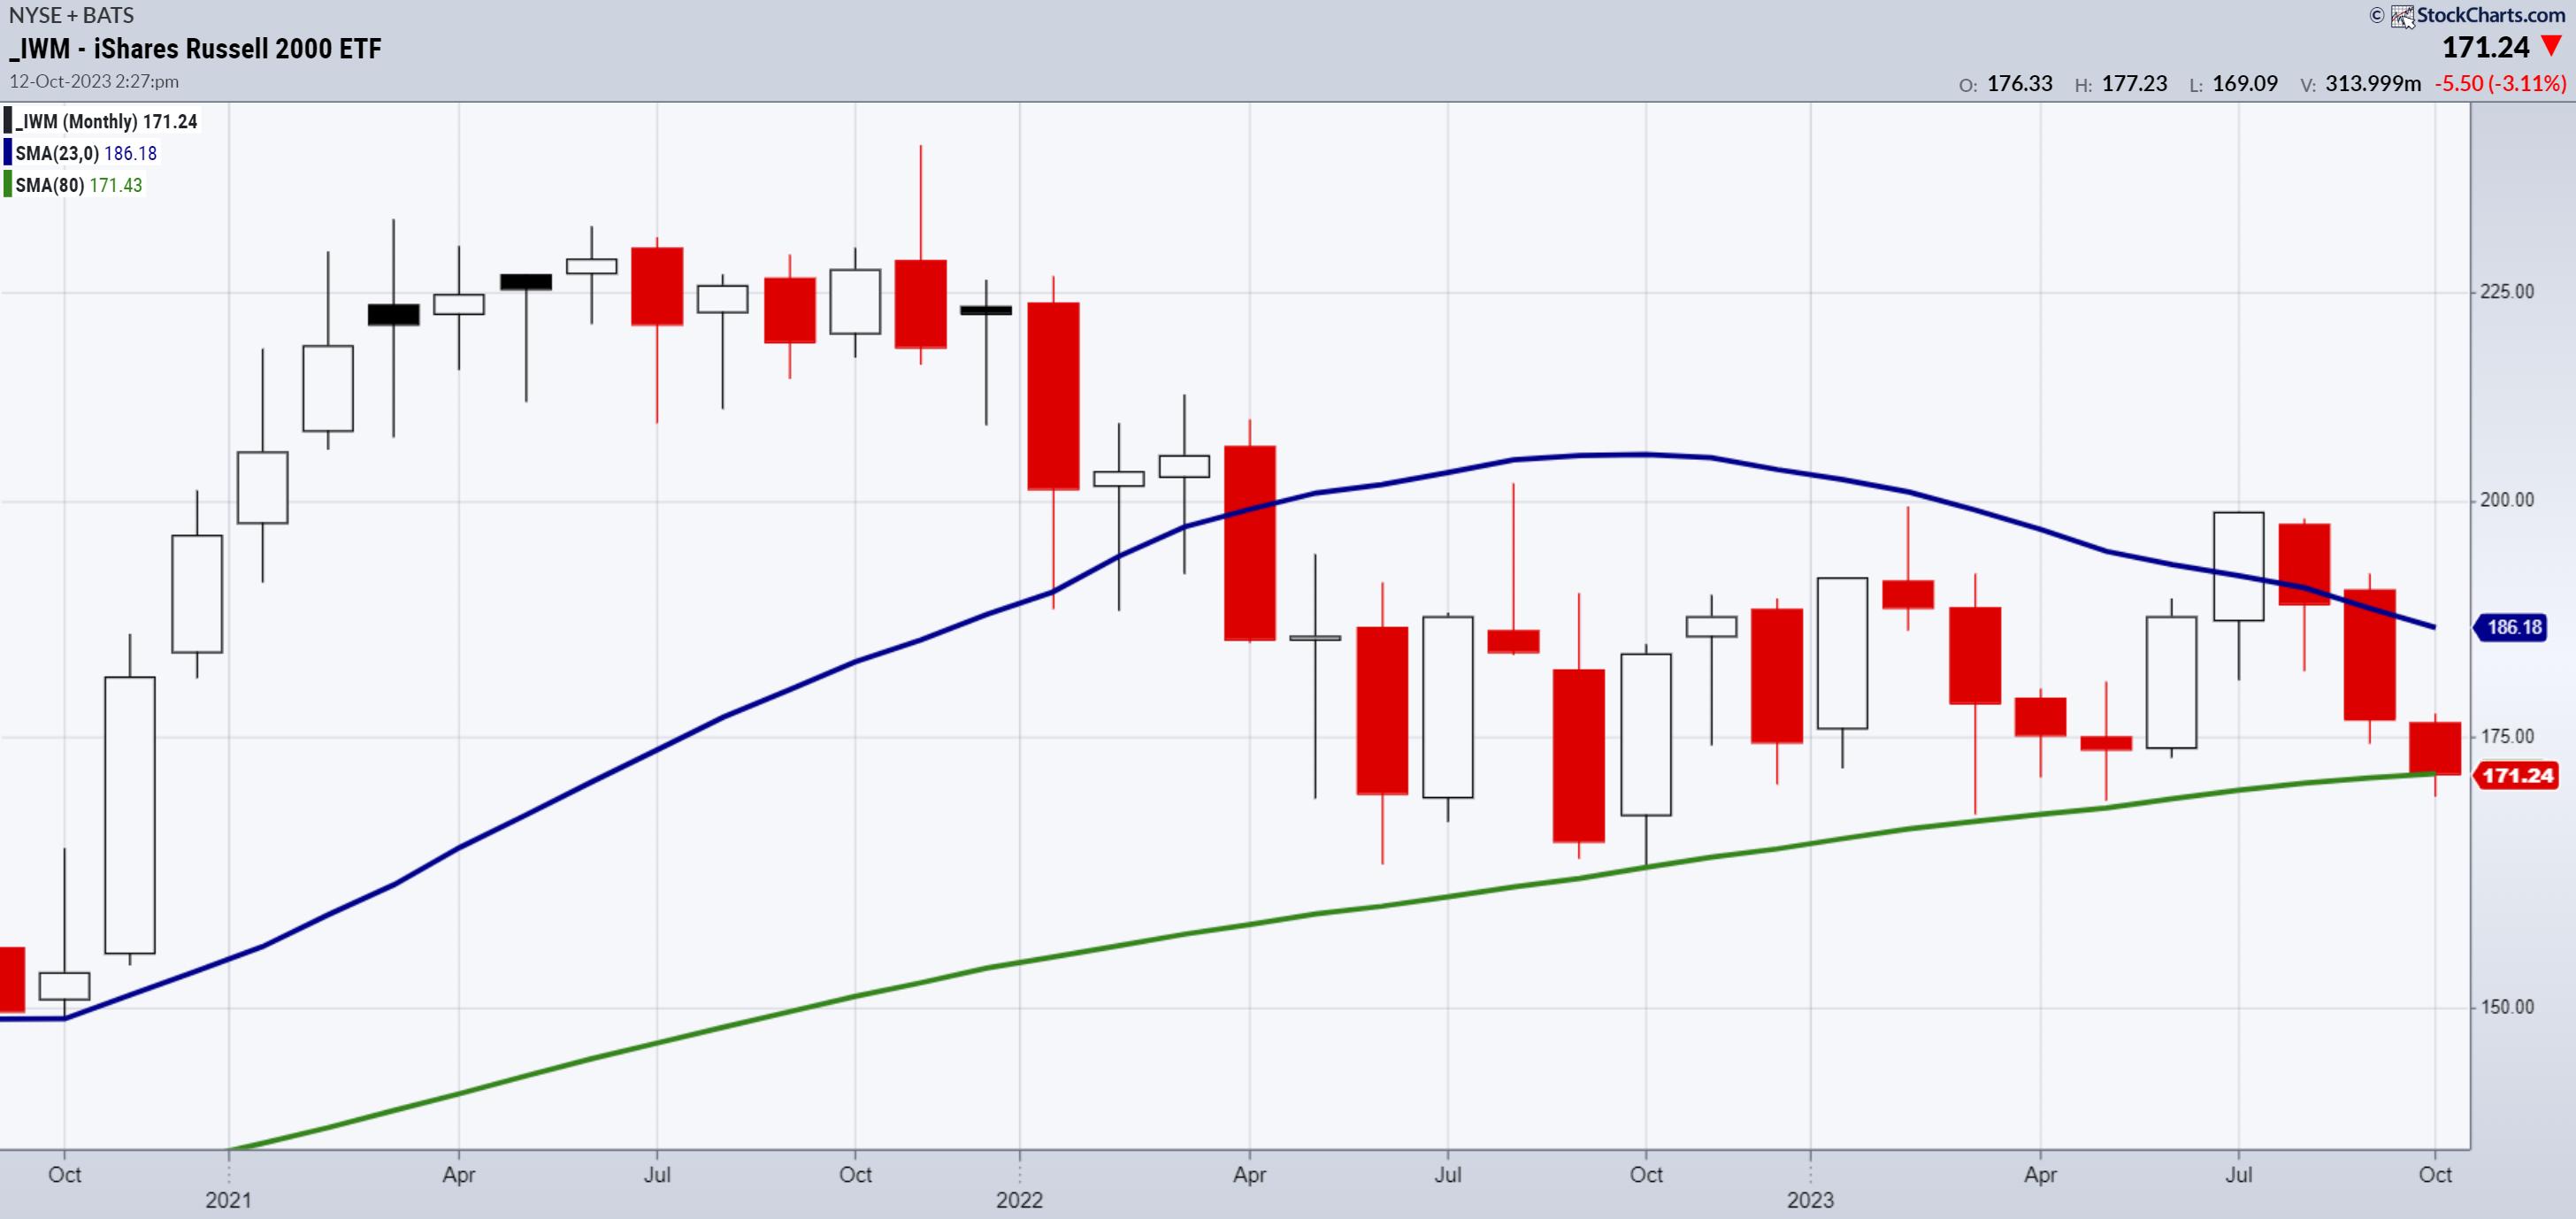
Recap and Action Plan: Small Caps, Beans, Oil
Since we came back from vacation, I've written 3 Dailys. The first of these was on the Economic Modern Family and how it opened its loving arms to the bulls.
I was particularly keen on small caps or the Russell 2000 (IWM). I wrote, "Beginning with Granddad...
READ MORE
MEMBERS ONLY
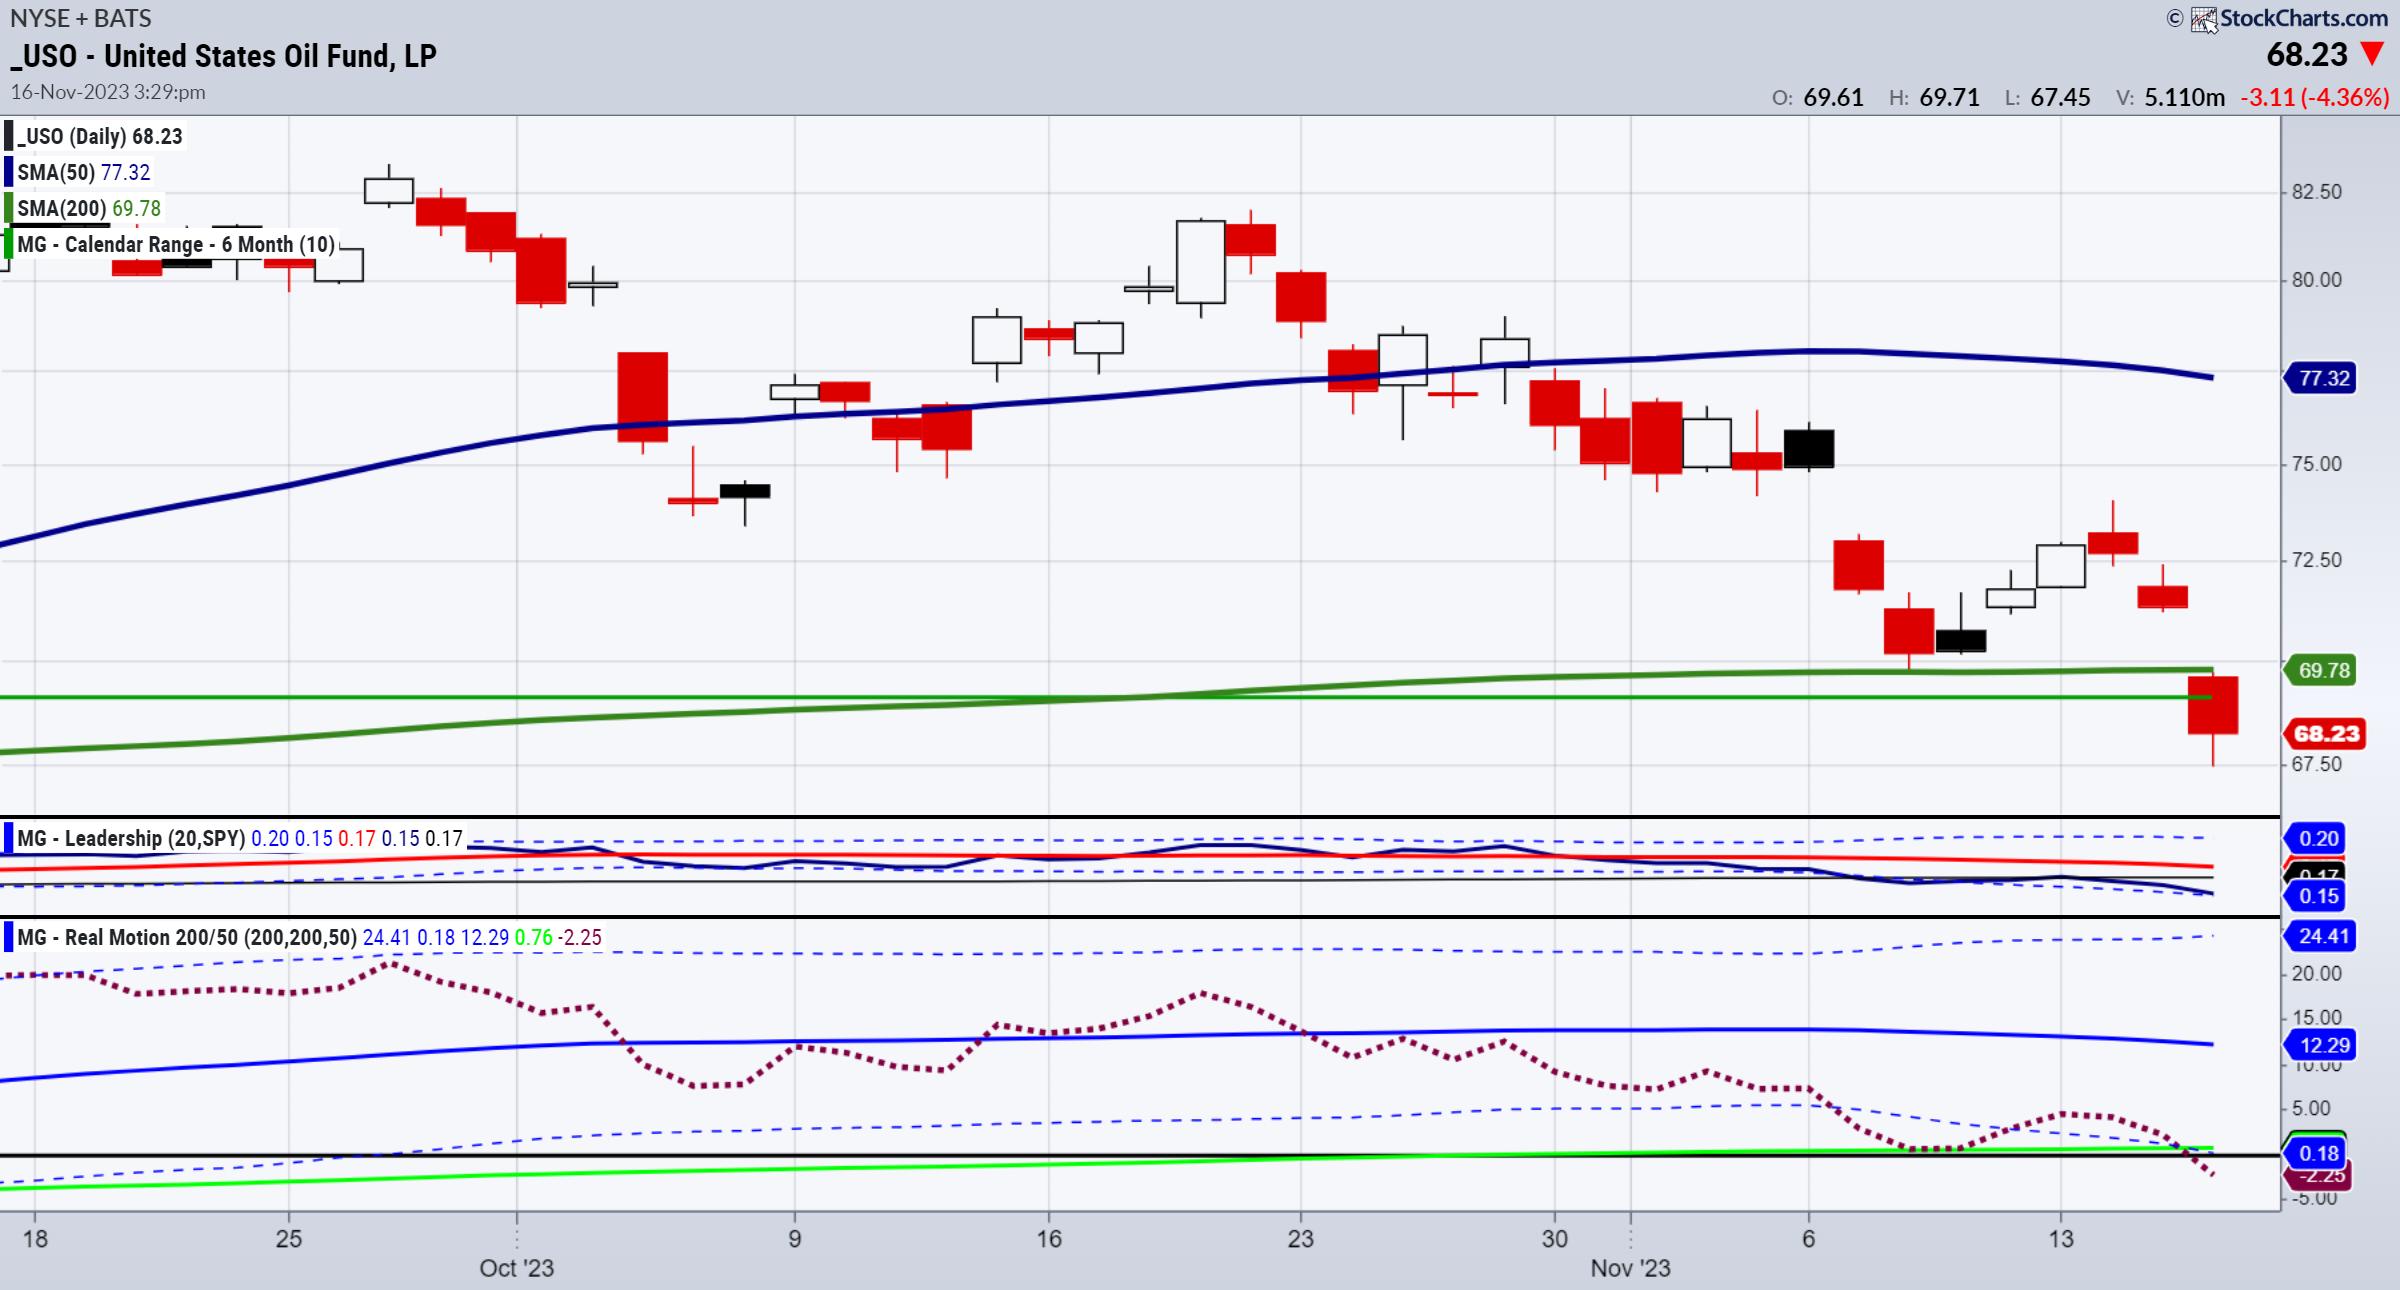
Oil the New Gold -- Buy When There's Blood in the Streets
A weaker labor market, manufacturing production slowing, new home prices falling and crude oil inventories rising more than expected are all to blame for the big drop in oil prices. US also eased sanctions on Venezuelan oil.
That's the nature of commodities; fresh news can supersede older headlines...
READ MORE
MEMBERS ONLY
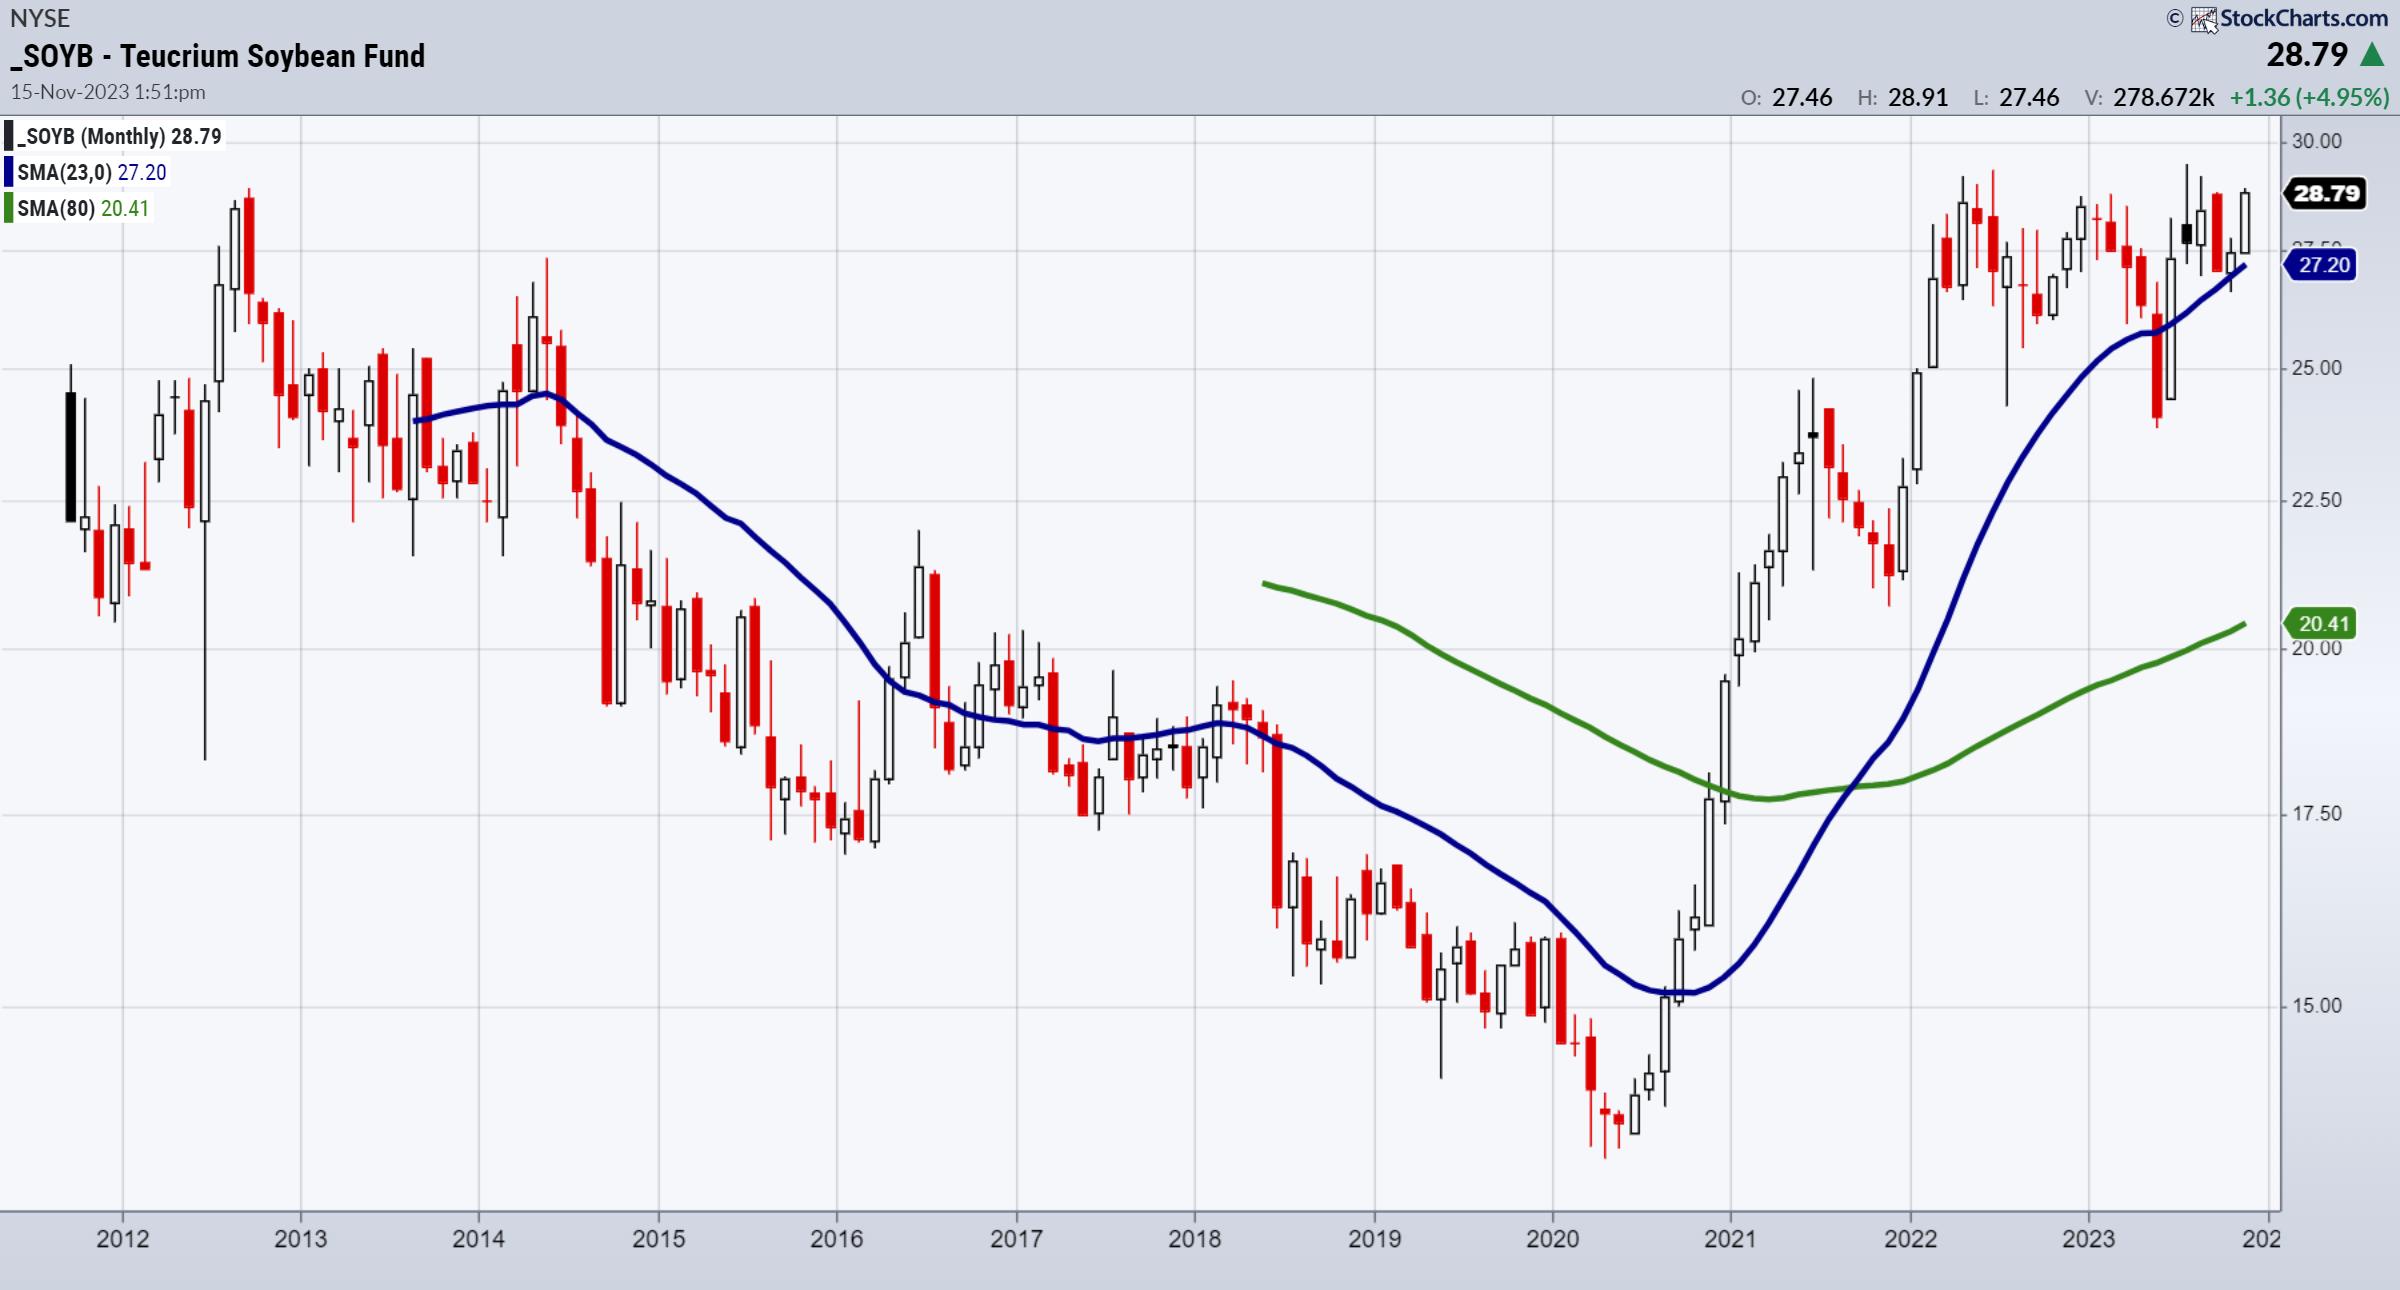
Soybeans Could be the Next Parabolic Runner
Brazil planted a record soybean crop only to see unusually dry and hot weather create concerns for the harvest. Furthermore, Argentina had an extreme shortfall of soybean meal crops. Meanwhile, the USDA numbers were bearish for corn and soybeans, as U.S. crops came in larger than expected. However, China...
READ MORE
MEMBERS ONLY
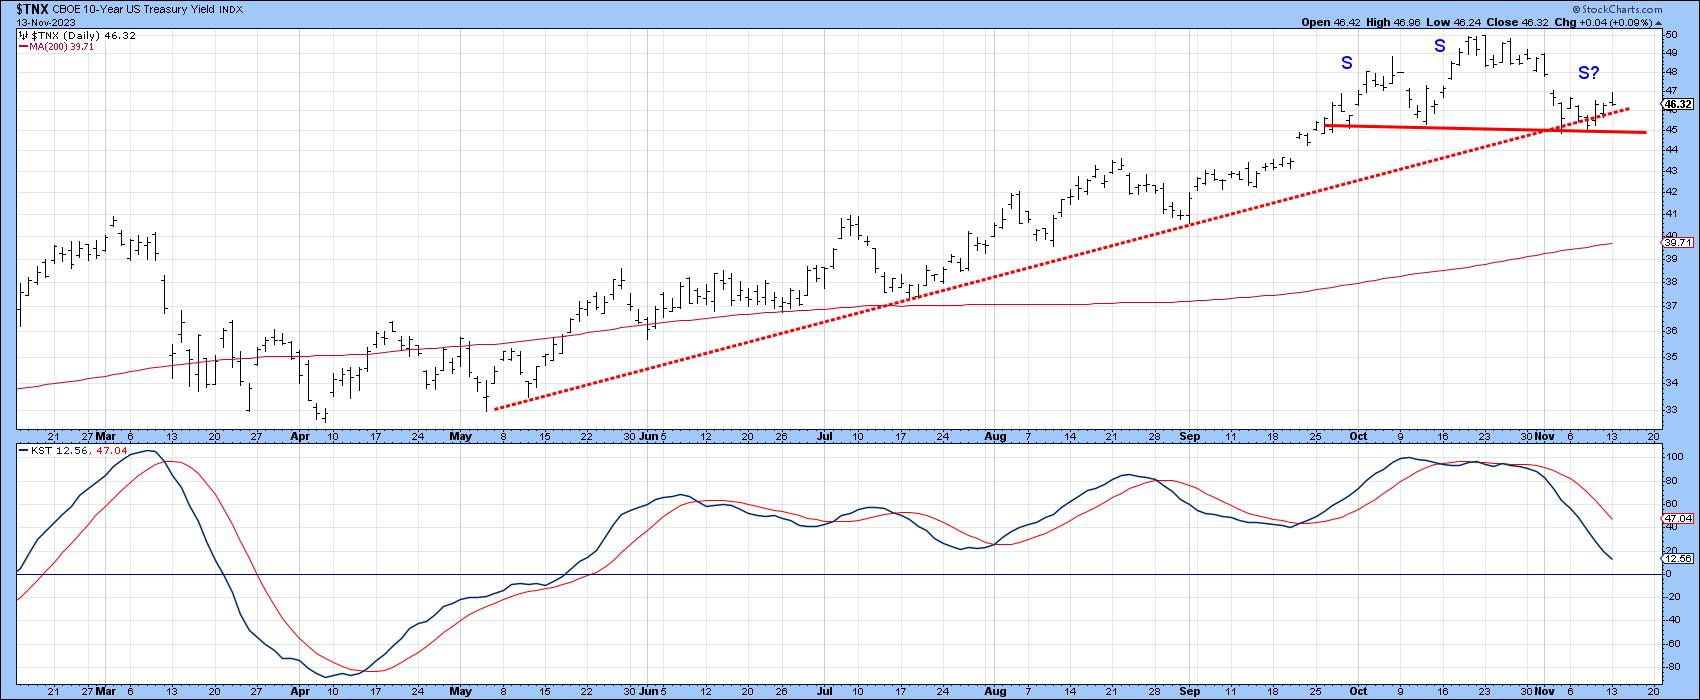
Is It Time for Interest Rates to Fall?
by Martin Pring,
President, Pring Research
I last wrote about bonds and interest rates in August, as they were in the process of challenging their October 2022 highs. My conclusion at the time was that they were likely to go through, but that upside potential would be limited due to what seemed at the time to...
READ MORE
MEMBERS ONLY

MEM TV: Will The Markets to Continue Trading Higher? This Needs to Happen First

by Mary Ellen McGonagle,
President, MEM Investment Research
In this episode of StockCharts TV'sThe MEM Edge, Mary Ellen reviews what drove the markets higher last week. She also shares what needs to take place in order for a sustained uptrend to materialize. Last up, she presents a review of the weaker areas as defensive stocks pull...
READ MORE
MEMBERS ONLY
The Halftime Show: Don't Believe Everything the Analysts Say, It's Dangerous!

by Pete Carmasino,
Chief Market Strategist, Chaikin Analytics
After TLT hit Pete's downside target, it had a violent move higher. On this week's edition ofStockCharts TV'sHalftime, Pete illustrates that the recent rally might be weakening.
A look at WTIC crude shows a pullback right on the level Pete uses as a pivot...
READ MORE
MEMBERS ONLY
MEM TV: New BULLISH THRUST in the S&P 500
by Mary Ellen McGonagle,
President, MEM Investment Research
In this episode of StockCharts TV'sThe MEM Edge, Mary Ellen reviews the new uptrend in the markets and the areas that are best positioned to benefit. She also highlights how to use different timeframe charts to tell if a stock will continue to trend higher after gapping up...
READ MORE
MEMBERS ONLY
Top Ten Charts to Watch in November 2023
by David Keller,
President and Chief Strategist, Sierra Alpha Research

by Grayson Roze,
Chief Strategist, StockCharts.com
In this edition of StockCharts TV'sThe Final Bar, join Dave and Grayson as they break down the trends for the top ten stocks and ETF charts for November 2023. Watch as they identify key levels and signals to keep an eye out for using the power of StockCharts&...
READ MORE
MEMBERS ONLY

DP Trading Room: Bad News for Buyers Weighing Hefty Mortgage Rates

by Erin Swenlin,
Vice President, DecisionPoint.com
by Carl Swenlin,
President and Founder, DecisionPoint.com
In this week's edition of The DecisionPoint Trading Room, Carl opens the show with a look at a very bearish market BIAS Table. He examines how the latest mortgage rates are squeezing buyers and sellers alike by comparing today's mortgage payments versus payments at the lows;...
READ MORE
MEMBERS ONLY

GNG TV: Charts Flash Warning Signs of Further Risk to the Downside
by Alex Cole,
Co-founder, GoNoGo Charts®
In this edition of the GoNoGo Charts show, with US Equities delivering a streak of daily gains this week, Alex takes a top down approach to see what the GoNoGo Charts are saying about markets. With U.S. domestic equities in a "NoGo" trend, the charts warn that...
READ MORE
MEMBERS ONLY

Is the Bear Back?
by Carl Swenlin,
President and Founder, DecisionPoint.com
The S&P 500 (SPY) has fallen about 10 percent from the July top, and the last two weeks has been pretty rough, so should we be looking for the Bear to take charge again?
First, looking at a weekly chart, it is not clear that the Bear actually...
READ MORE
MEMBERS ONLY
Late-Hour Selloff Confirms Downtrend Phase!
by David Keller,
President and Chief Strategist, Sierra Alpha Research
In this edition of StockCharts TV'sThe Final Bar, guest Tom Bowley of EarningsBeats shares his chart of key ratios illustrating how growth still has held its ground relative to value stocks. Host David Keller, CMT focuses in on distribution in the last hour of trading and highlights one...
READ MORE
MEMBERS ONLY

This Powerful MACD/ADX Screener Generates Valuable Ideas

by Joe Rabil,
President, Rabil Stock Research
On this week's edition of Stock Talk with Joe Rabil, Joe shows an intraday trade setup in the SPY that took place this week. He uses the MACD and ADX in multiple timeframes to explain in detail how they can help with our entry and timing. He discusses...
READ MORE
MEMBERS ONLY
Looking Outside the Stock Market for Opportunities

by Arthur Hill,
Chief Technical Strategist, TrendInvestorPro.com
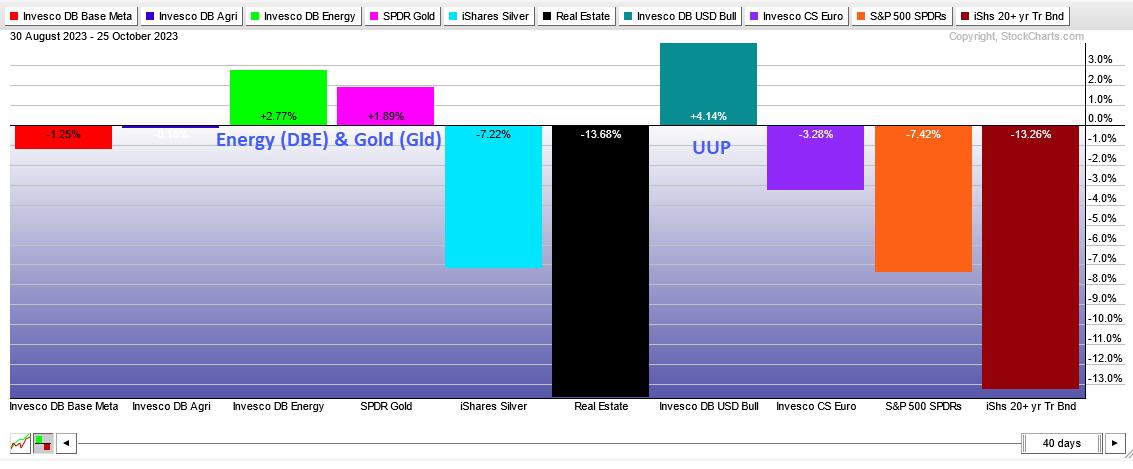
Correlations rise during bear markets. This means more stocks participate in broad market declines than broad market advances. In other words, the odds are stacked against us when picking stocks in bear markets. Traders are better off looking outside of the stock market for opportunities.
The Perfchart below shows the...
READ MORE
MEMBERS ONLY
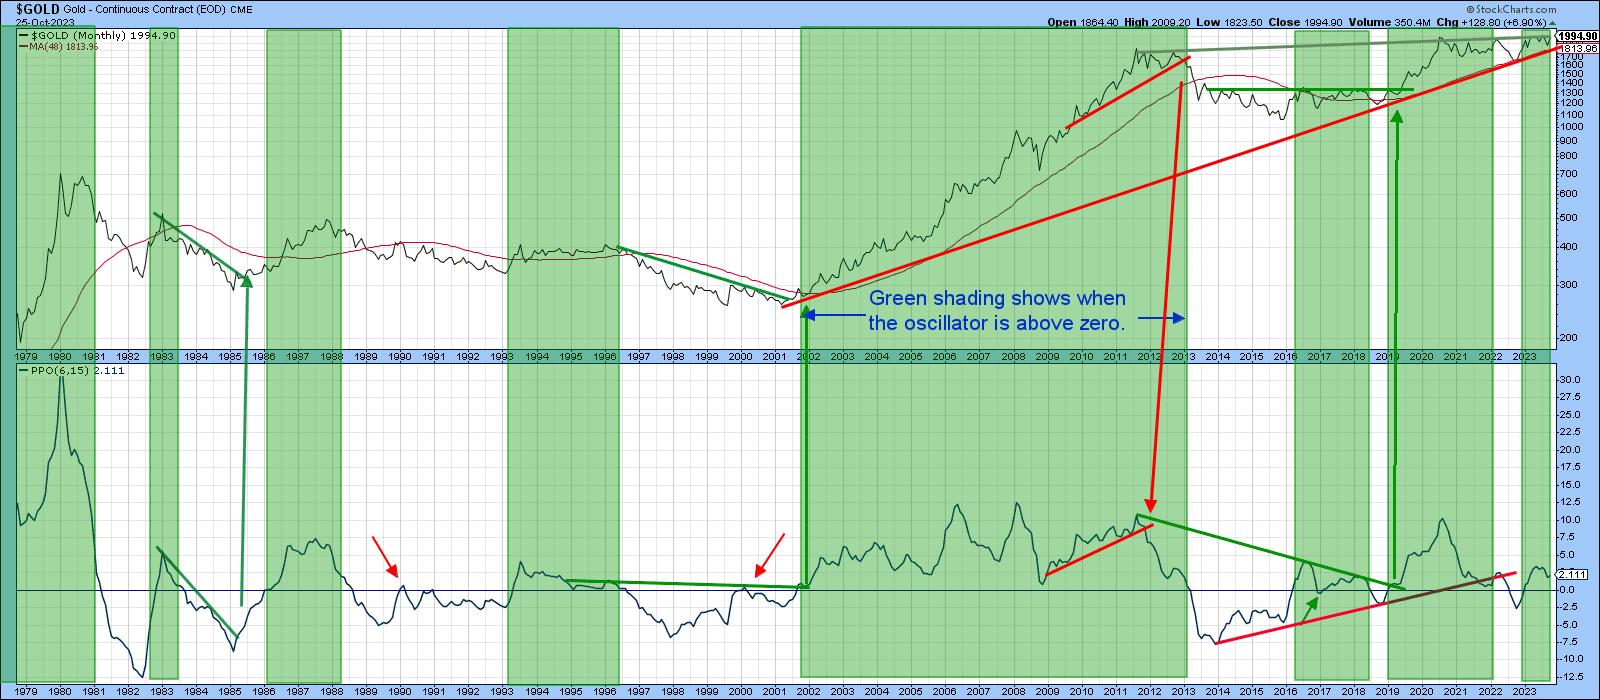
Some Gold Indicators Approach Critical Chart Points
by Martin Pring,
President, Pring Research
When Anwar Sadat, President of Egypt was assassinated in 1981, gold rallied sharply over the near-term, but the advance soon petered out. The reason was that gold was in a primary bear market, so the advance merely represented a counter-cyclical move. Gold has rallied sharply since the Middle East crisis...
READ MORE
MEMBERS ONLY
MEM TV: Markets Stall As Week Progresses - Here's Why
by Mary Ellen McGonagle,
President, MEM Investment Research
In this episode of StockCharts TV'sThe MEM Edge, Mary Ellen shares where the market stands, after last week's price action had select areas far outpacing the markets while others were weak. She also reviews the start of earnings season following reports from several high profile companies....
READ MORE
MEMBERS ONLY

Stock Market Weekly Update: 3 Valuable Points You Need To Know About the Selloff

by Jayanthi Gopalakrishnan,
Director of Site Content, StockCharts.com
KEY TAKEAWAYS
* Broader stock market indices are still holding support despite the selloff
* The VIX closed higher but it's still tame relative to past readings
* Gold futures closed above $1900 per ounce indicating that investors may have fled to gold in case geopolitical tensions escalated over the weekend...
READ MORE
MEMBERS ONLY
Comfort in the Stock Charts (Video Interview)
Some notes this week:
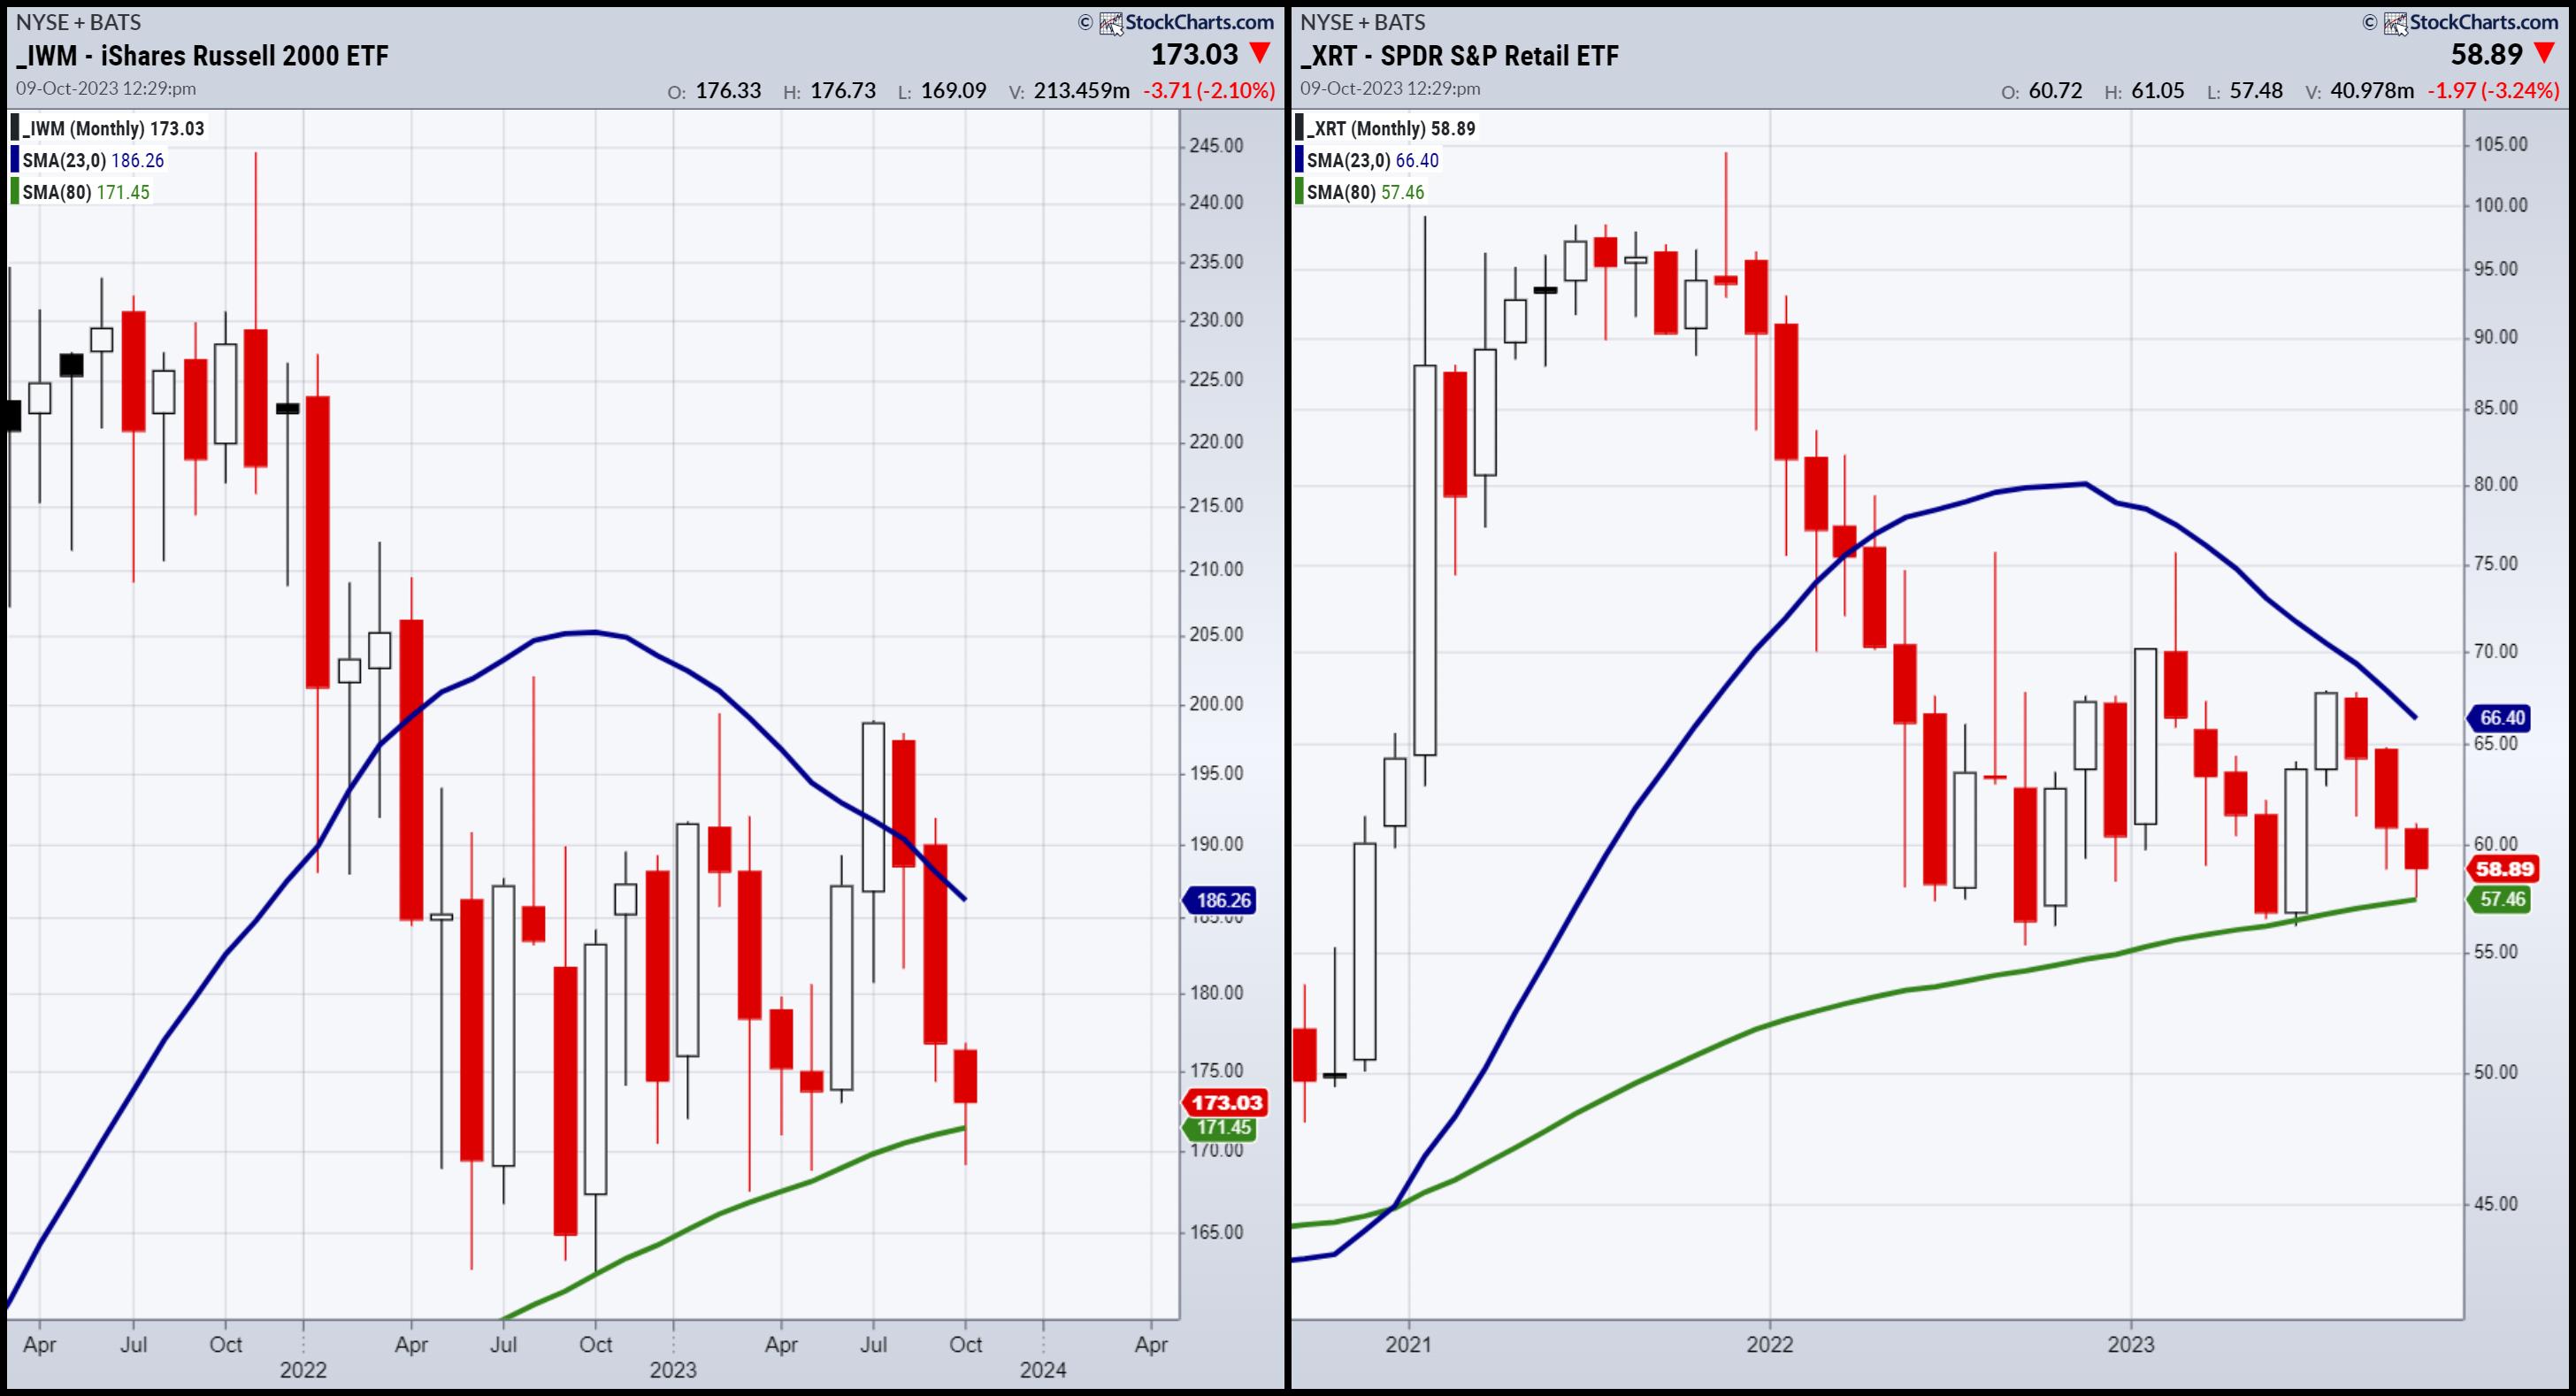
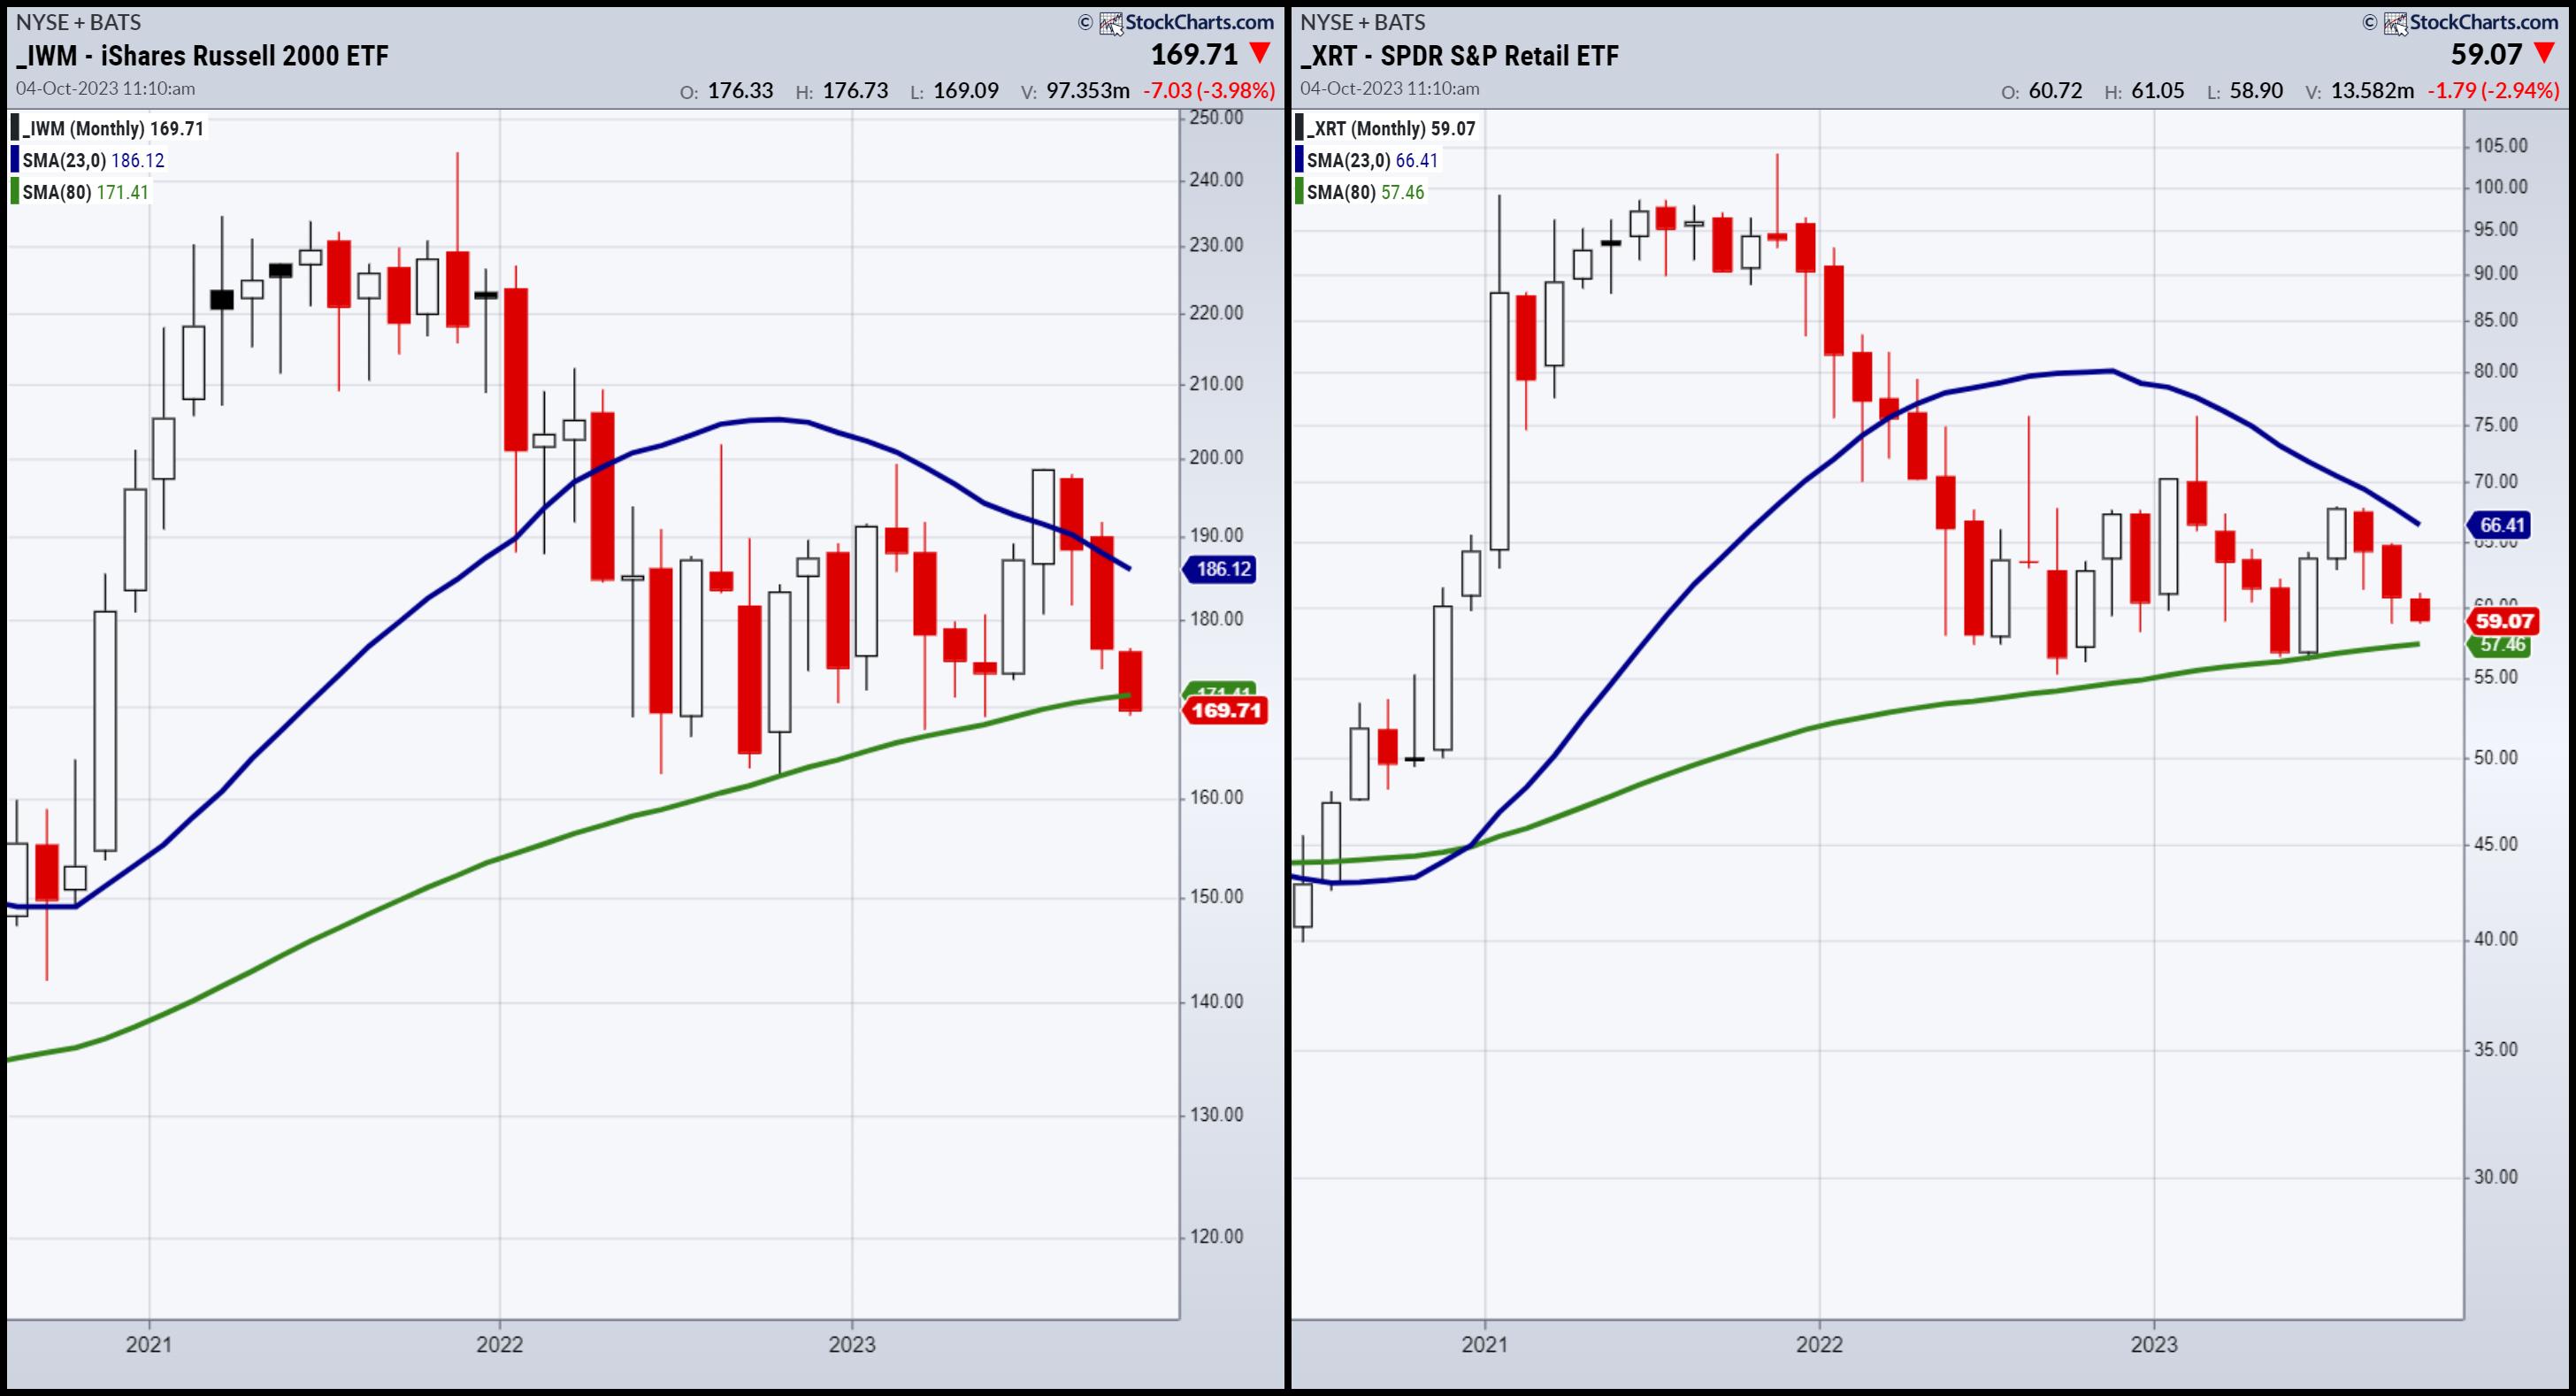
Growth stocks are acting as a defense move again, especially given that the Fed remains on the fence about interest rate. Small caps and retail though, could still act as an anchor. For now, they both held a key area -- 6-7-year business cycle lows --...
READ MORE
MEMBERS ONLY
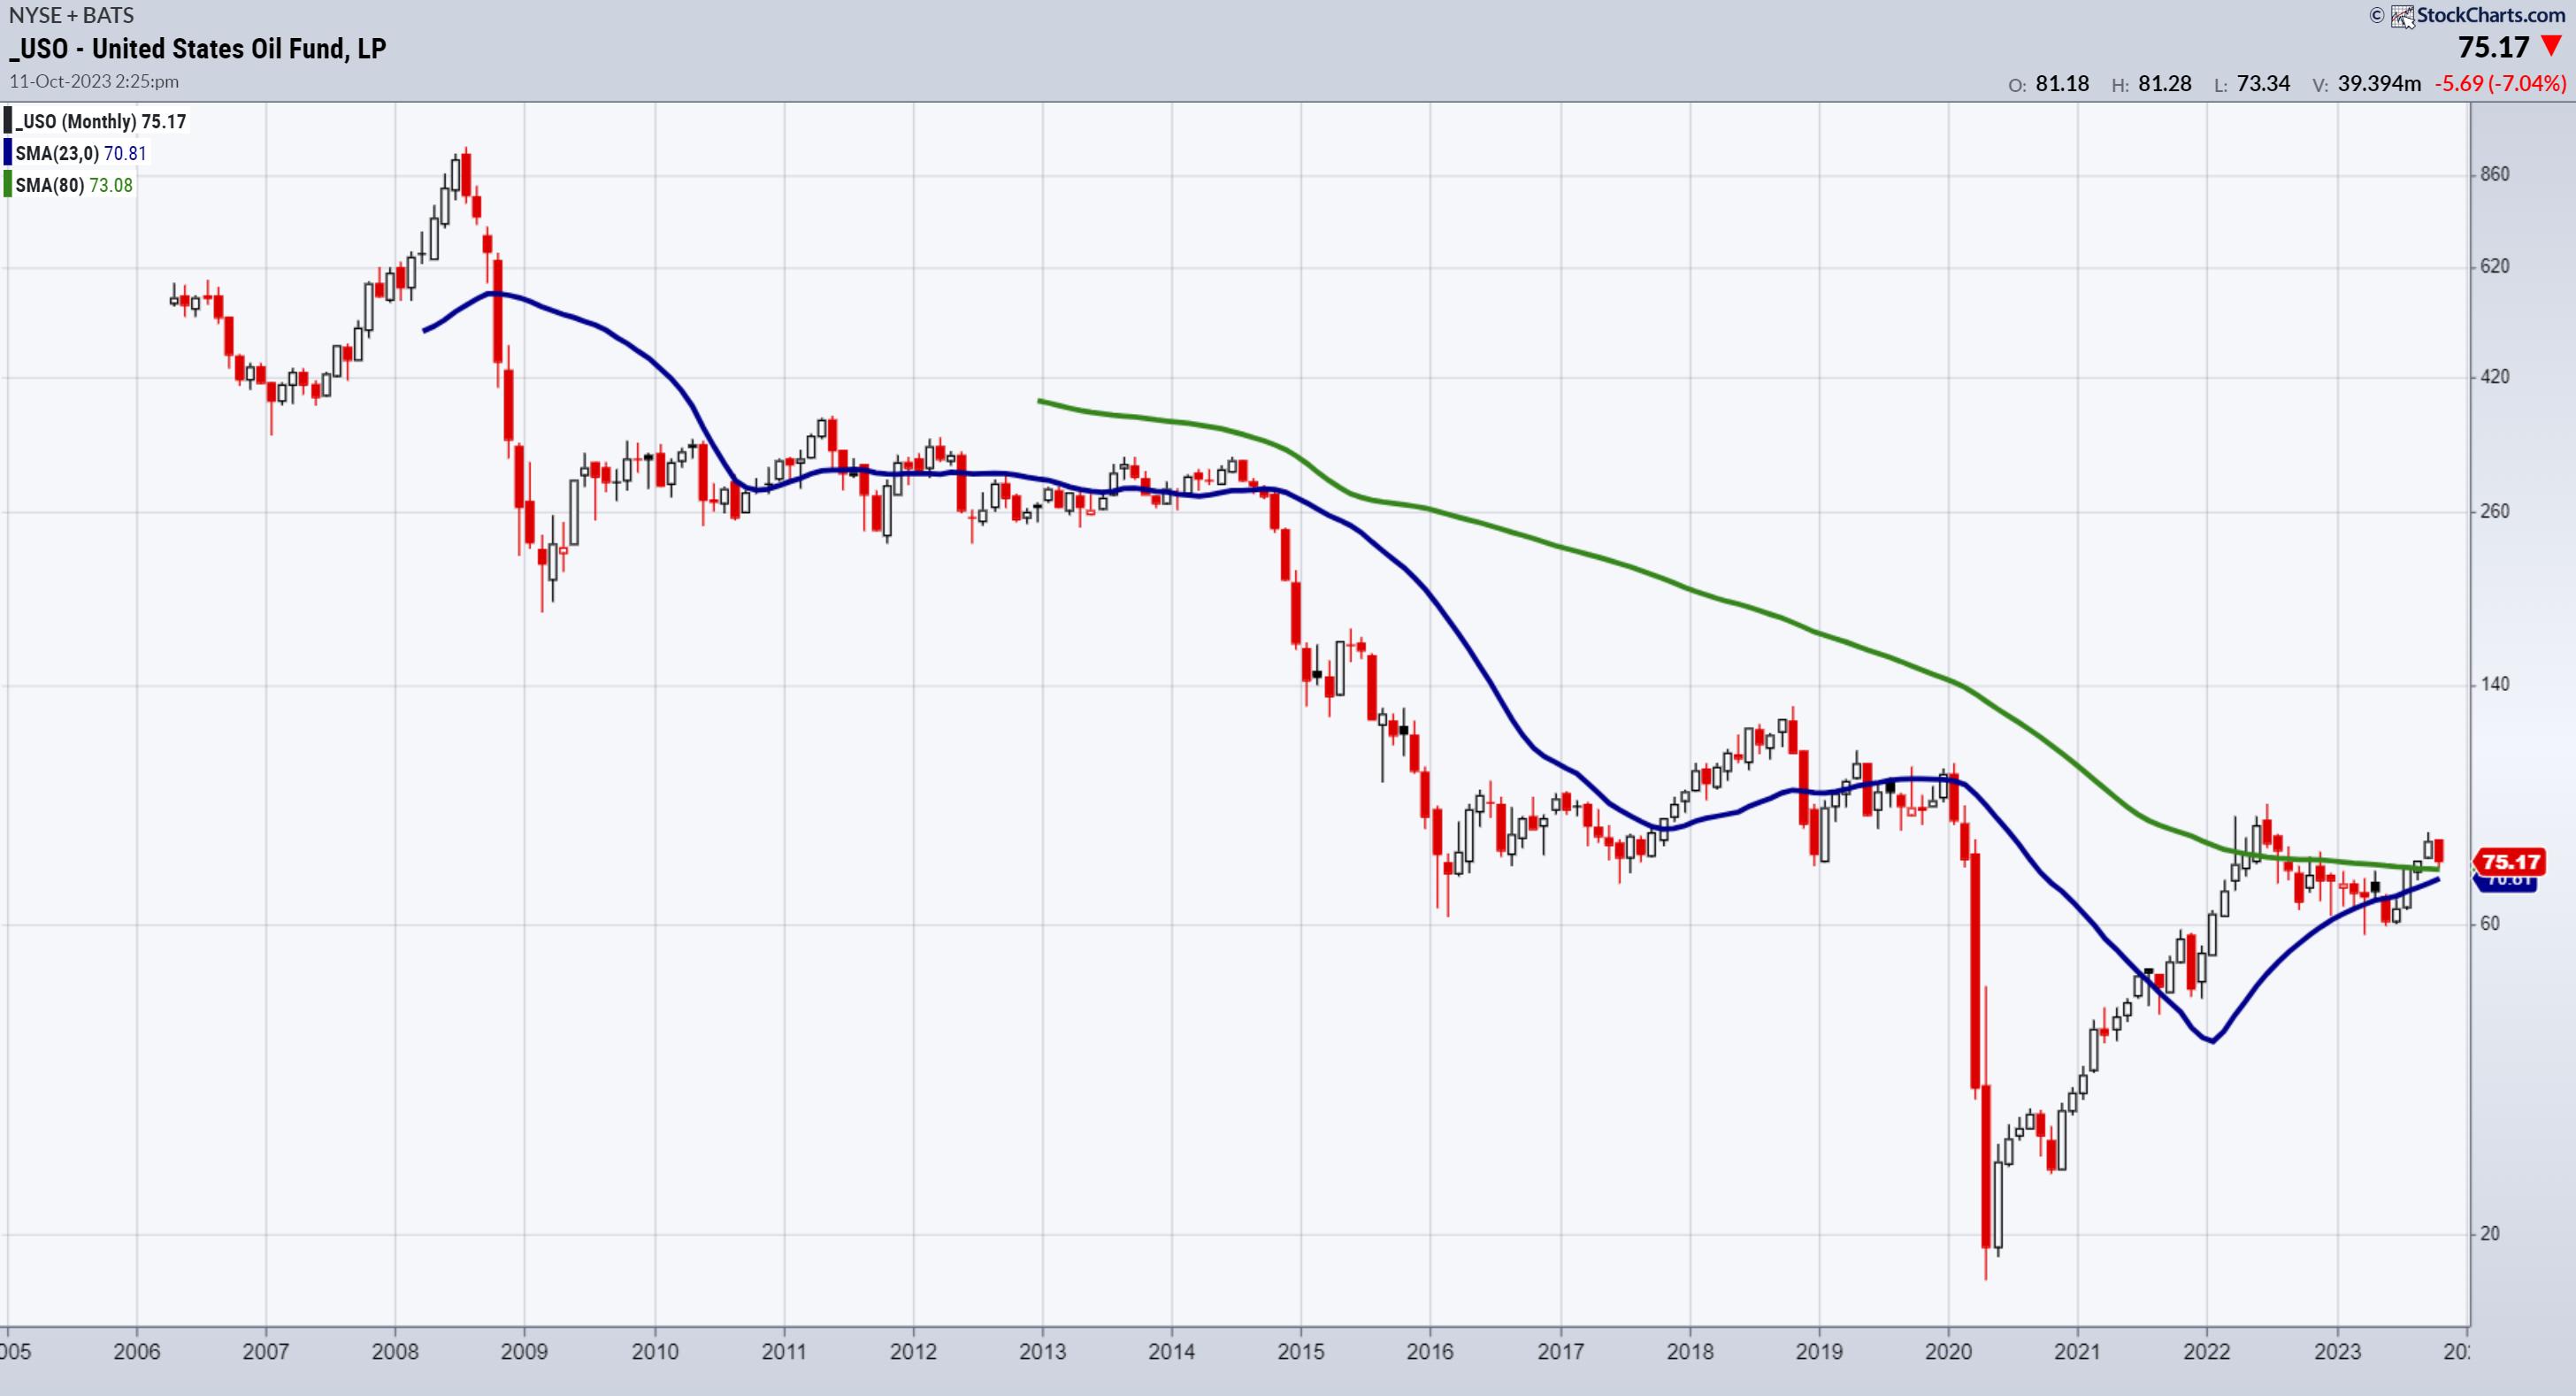
Monthly Chart Points to Much Higher Oil Prices Coming
Before we begin, just a note to mention that TLT took out the fast MA featured in the October 10th daily, while SPY underperformed. If that is a trend, it behooves you to review that daily.
Loyal readers of the Daily know that we often focus on zooming out to...
READ MORE
MEMBERS ONLY

A Closer Look at Long Bonds and The US Dollar
The next direction of the long bonds is crucial in determining the macro.
First, after a wrecking ball crash and ahead of the FOMC, we could surmise that a bottoming-like action defines the last several trading days. Our Real Motion indicator shows a mean reversion. The 10-day moving averages (cyan...
READ MORE
MEMBERS ONLY
What We Will Use to Ascertain the Market's Next Moves
For consistency, here are the key go-tos during an uncertain time in the market:
1. The next direction of long bonds (TLT).
2. The next direction of the small caps and retail sectors (IWM, XRT).
3. The next direction of commodities, all of them, but particularly the agricultural ones, oil...
READ MORE
MEMBERS ONLY

Small-Caps and Retail Hold the Line in the Sand
I spent all of last week, in the media and in print, going over the importance of 2 key indicators. (See the media clips below.)
1. Our risk gauges on Big View, all of which kept flashing risk-on regardless of the doom-and-gloom and initial selloff in bonds and SPY.
2....
READ MORE
MEMBERS ONLY
Watch Mish on Real Vision and More!
Yesterday, we covered the 80-month moving average in small caps and retail.
Today, I did several interviews -- some already out (BNN Bloomberg), others out soon (Financial Sense with Jim Pupluva), and the one that you'll find on YouTubelater today with Real Vision.
We chose this one to...
READ MORE
MEMBERS ONLY
When the Dollar Stops Going Up, Will These Markets Stop Going Down?
by Martin Pring,
President, Pring Research
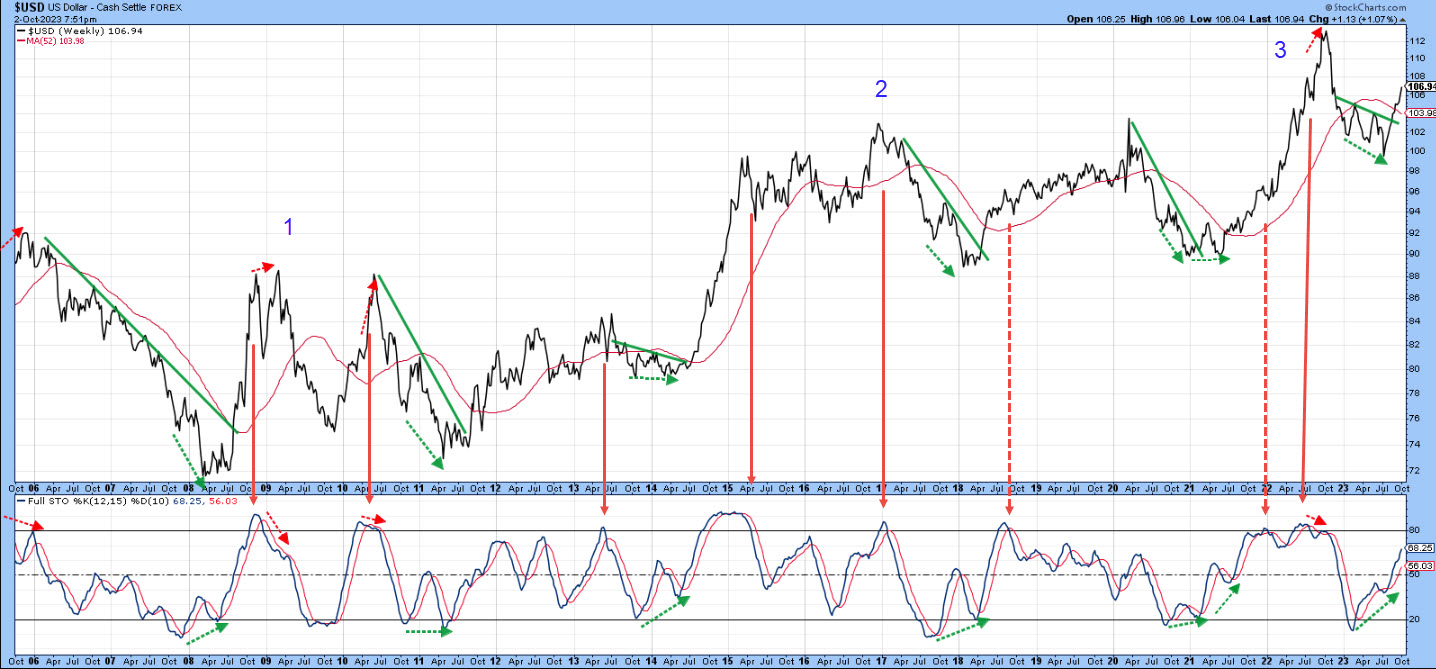
The Dollar Index
I last wrote an article on the dollar in August, The Dollar Index Goes to Missouri. In it, I pointed out that the Index had reached crucial resistance, which, if surpassed, would signal a new primary bull market and a likely fourth up leg to the secular...
READ MORE
