MEMBERS ONLY
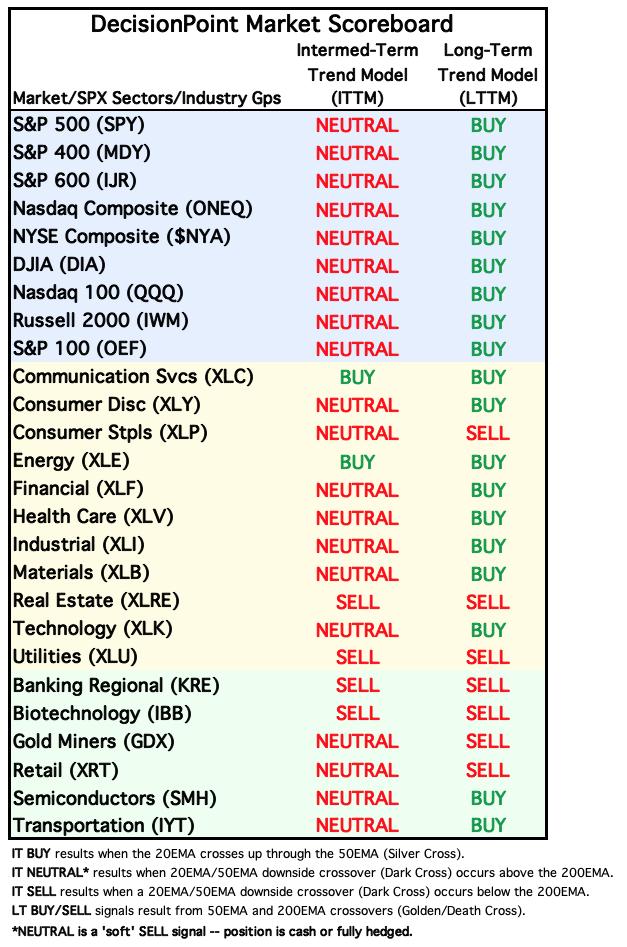
New Tables Show Intermediate-Term Overview is Negative

by Carl Swenlin,
President and Founder, DecisionPoint.com
We have introduced two new tables in the DecisionPoint ALERT to give an overview of trend and BIAS for the major market indexes, sectors, and industry groups that we track. The first is our Market Scoreboard, which shows the current Intermediate-Term and Long-Term Trend Model (ITTM and LTTM) signal status....
READ MORE
MEMBERS ONLY

What to Do When The MACD Is Broken

by Joe Rabil,
President, Rabil Stock Research
On this week's edition of Stock Talk with Joe Rabil, Joe explains how the creator of the MACD, Gerald Appel, used this indicator as an overbought/oversold oscillator. He shows how using the SPY on the daily chart as an example. He then explains what to do when...
READ MORE
MEMBERS ONLY

Sector Spotlight: Sector Rotation Sends Mixed Signals

by Julius de Kempenaer,
Senior Technical Analyst, StockCharts.com
On this episode of StockCharts TV's Sector Spotlight, after two weeks of non-regular market updates, I'm back with a regular episode. Here, I dive deep into the current state of rotation in asset classes, highlighting the strength of commodities and the opposing rotations for stocks and...
READ MORE
MEMBERS ONLY

DP Trading Room: Don't Forget The MONTHLY CHARTS! Earnings Spotlight

by Erin Swenlin,
Vice President, DecisionPoint.com
by Carl Swenlin,
President and Founder, DecisionPoint.com
In this week's edition of The DecisionPoint Trading Room, Carl opens with a discussion on why you should use monthly charts even if you are investing in the shorter term. He gives us insight into the market as a whole and reviews the Magnificent 7 stocks and Tesla...
READ MORE
MEMBERS ONLY

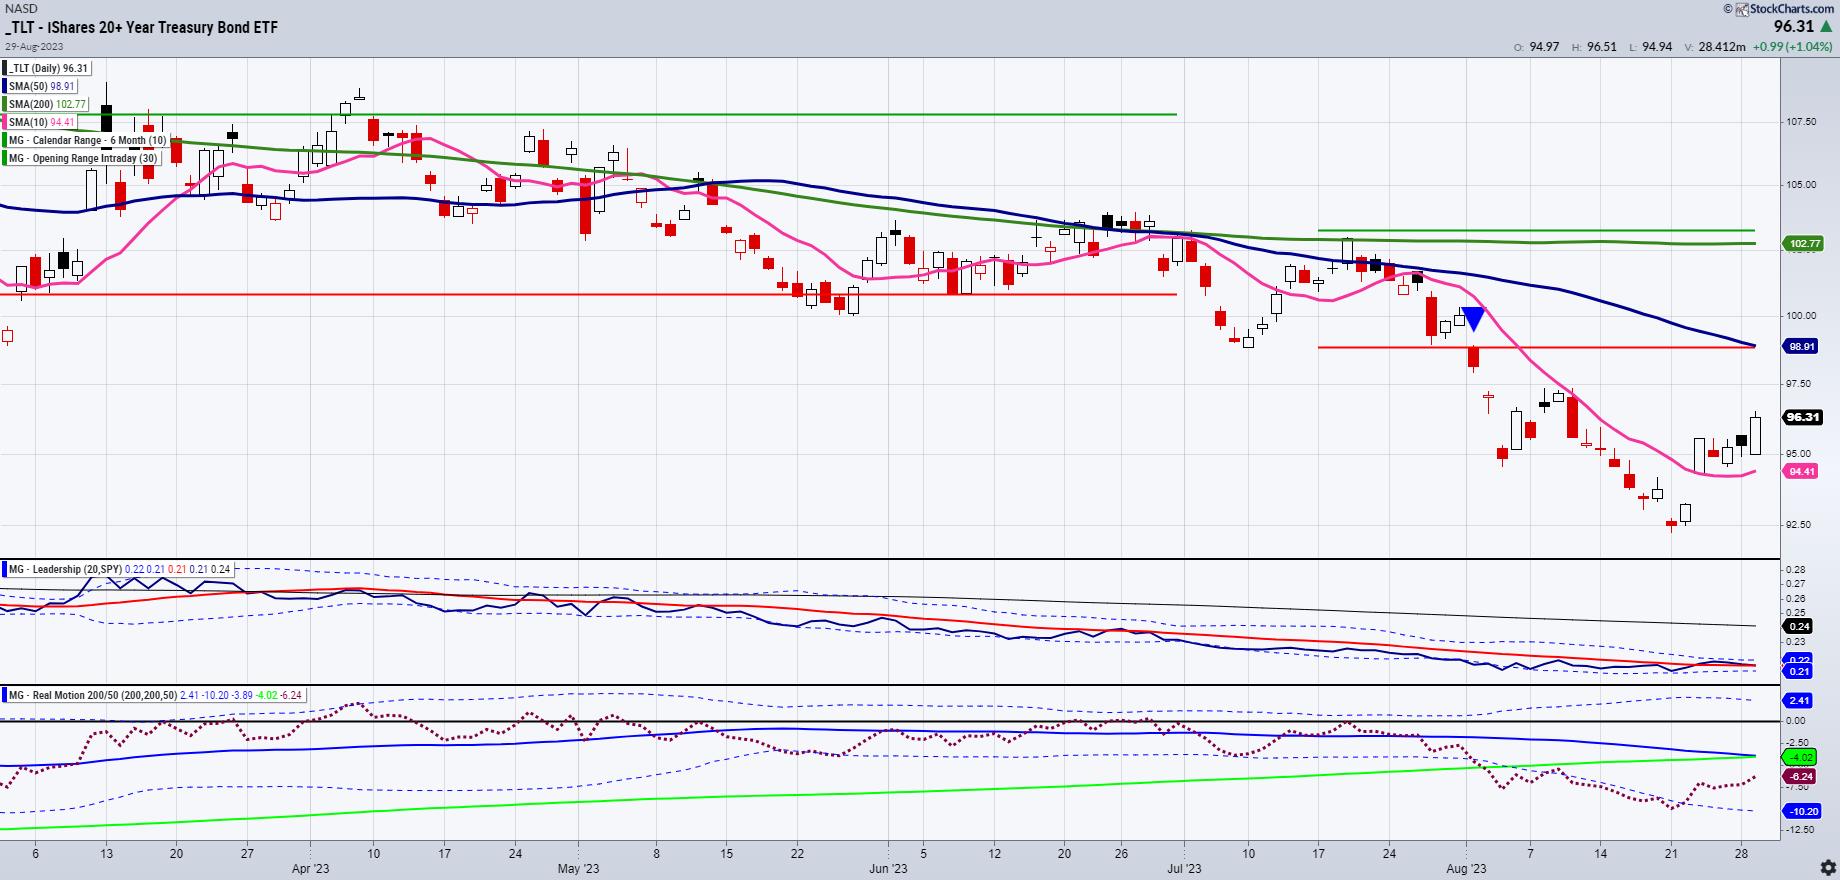
The Halftime Show: Fixed Income Continues To Fall, Can't Say I Didn't WARN You!

by Pete Carmasino,
Chief Market Strategist, Chaikin Analytics
Pete has been monitoring and calling out the downfall of TLT for nearly 20 months. In this week's edition of StockCharts TV'sHalftime, Pete explains why the ETF broke below $90 and how the US 10-year is over 4.5% on the same day. He dives into...
READ MORE
MEMBERS ONLY

MEM TV: How to Tell When It's Safe to Get Back Into the Markets

by Mary Ellen McGonagle,
President, MEM Investment Research
In this episode of StockCharts TV'sThe MEM Edge, Mary Ellen reviews what drove the previous week's sharp pullback and what we'll need to see before the markets can turn positive again. She also highlights recession-proof stocks that are currently attractive as well as high...
READ MORE
MEMBERS ONLY

Energy Sector Roulette: Bullish Signals, Sluggish Projections

by Karl Montevirgen,
The StockCharts Insider
KEY TAKEAWAYS
* Energy Select Sector SPDR Fund (XLE) shows some promising technicals, signaling room for a potential climb and a strong chance for a breakout to the upside
* Technical indicators suggest that the Energy sector has a high probability of breaking out to the upside
* A breakout above its all-time...
READ MORE
MEMBERS ONLY

Seasonality and Fundamentals Converging on GLD
by Karl Montevirgen,
The StockCharts Insider
KEY TAKEAWAYS
* A convergence of fundamental and seasonality data predicts a potential decline in gold prices by the end of the year
* Demand for gold has decreased by about 5% year-over-year in the first half of 2023, with central banks being the primary buyers
* The Williams True Seasonal indicator aligns...
READ MORE
MEMBERS ONLY
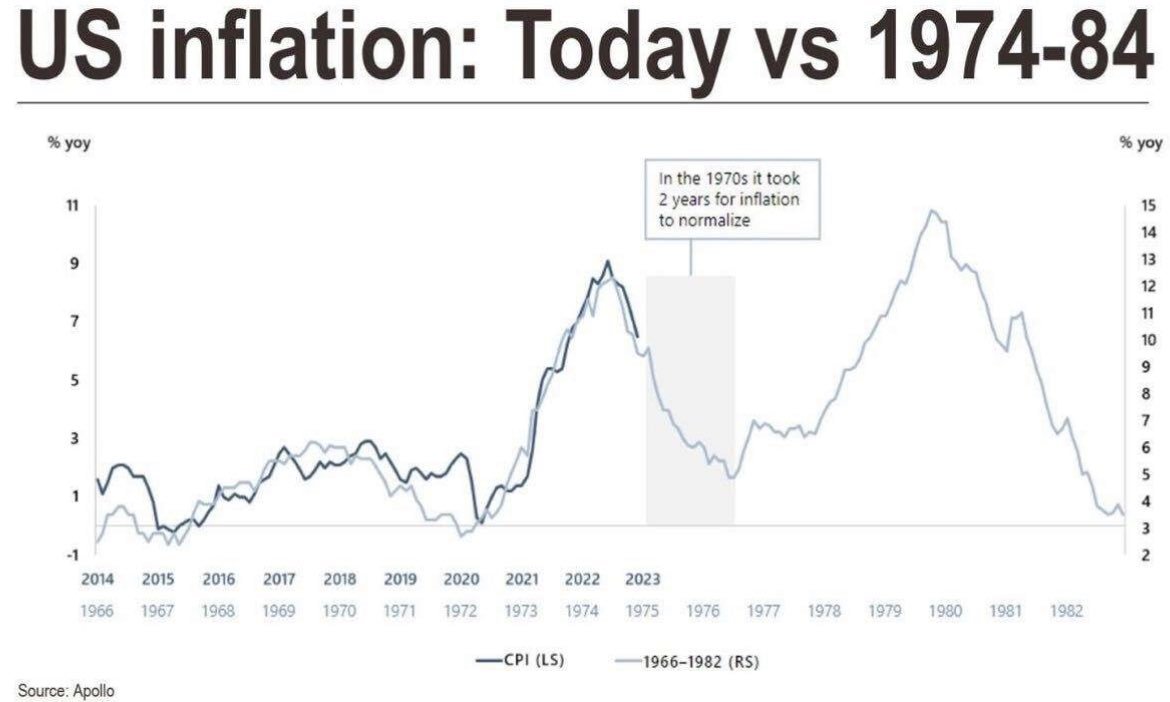
History Rhymes: 1974-1976 vs. 2022-2024?
How many of you have heard me say that commodities are inherently volatile?
Clearly, from this chart, you can see that after the oil rally in the mid 1970s, the CPI went from nearly 9% in 1974 down to 2% in 1976. Sugar, my favorite barometer of inflation, ran to...
READ MORE
MEMBERS ONLY

Q4 Stock Market Outlook: 3 Analysts, 3 Insights

by Jayanthi Gopalakrishnan,
Director of Site Content, StockCharts.com
KEY TAKEAWAYS
* Although September is considered a seasonally weak period for the stock market the fourth quarter is typically a strong period
* There's a high probability of the S&P 500 Index reaching a new high in Q4
* Growth stocks, Industrials, Financials, and Commodities could all see...
READ MORE
MEMBERS ONLY
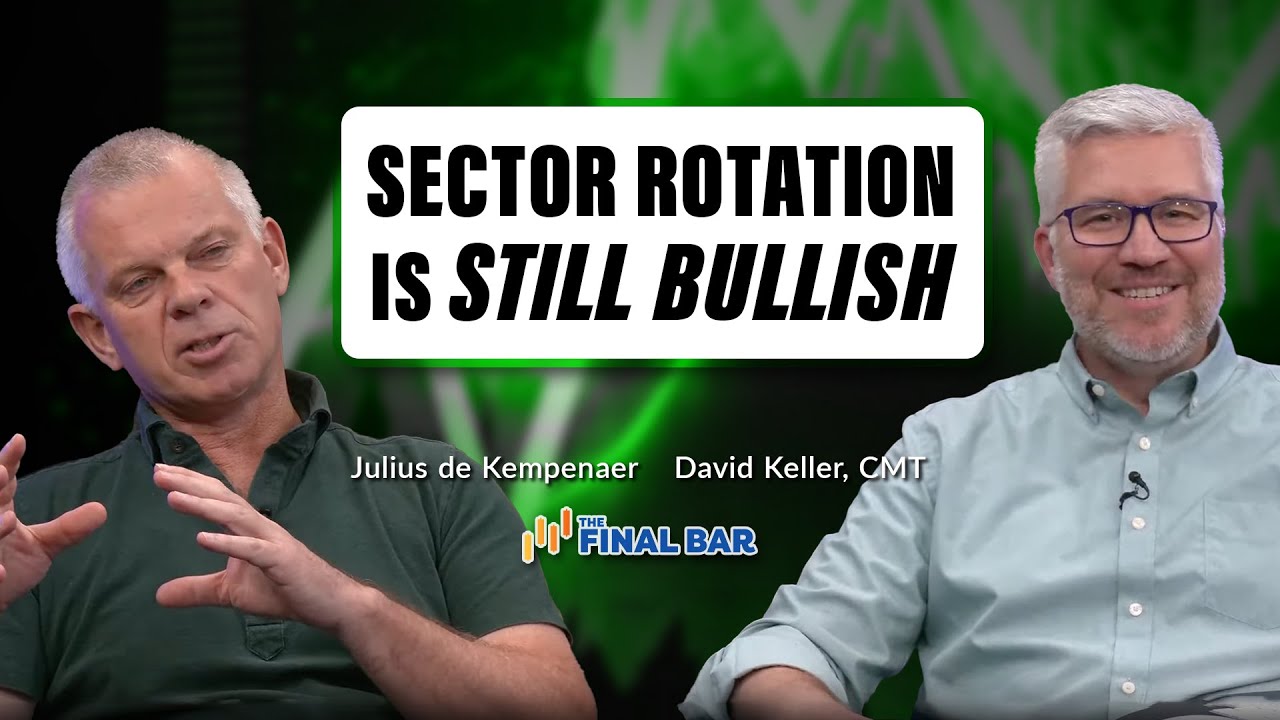
Sector Rotation Analysis Still Quite Bullish

by David Keller,
President and Chief Strategist, Sierra Alpha Research
In this edition of StockCharts TV'sThe Final Bar, guest Julius de Kempenaer of RRG Research shows how his market visualizations still show stocks over bonds and offense over defense. Host David Keller, CMT highlights one industry sector breaking down due to higher crude oil prices.
This video originally...
READ MORE
MEMBERS ONLY

Chesapeake Energy: A Stock That Could Pump Much More
by Jayanthi Gopalakrishnan,
Director of Site Content, StockCharts.com
KEY TAKEAWAYS
* Chesapeake Energy stock has been trending higher since June 2023
* Chesapeake Energy stock has room for upside growth
* CHK could benefit from the rise in crude oil prices
In addition to analyzing the stock market's overall performance, running scans when the market opens and after it...
READ MORE
MEMBERS ONLY
Stock Market Wrap-Up: Equities, Oil Close Higher While Treasury Yields Slightly Lower
by Jayanthi Gopalakrishnan,
Director of Site Content, StockCharts.com
KEY TAKEAWAYS
* September is usually a weak month in the stock market and this time it may be no different
* In spite of the selloff the broader equity indexes are still trending higher
* Rising oil prices and the US dollar may put some pressure on inflation
"September is when...
READ MORE
MEMBERS ONLY

Can the Windowmaker Natural Gas Resuscitate?
Probably the worst or at least one of the worst performers in the overall market and in the commodities market, natural gas is choppy and lifeless. So why write about it?
For starters, we love an underdog. Perhaps a bit too contrarian, as the reasons for the decline in natural...
READ MORE
MEMBERS ONLY

GNG TV: XOP's Strength vs. the S&P's Weakness

by Tyler Wood,
Co-founder, GoNoGo Charts®
In this edition of the GoNoGo Charts show, Tyler examines a return to strong "Go" conditions in the US Dollar index (UUP) and US Treasury rates ($TNX) on both the daily and weekly timeframes. The trend following model is clearly to the upside, but momentum has not shown...
READ MORE
MEMBERS ONLY

Energy Stocks in the Spotlight: A Look at Diamondback Energy
by Jayanthi Gopalakrishnan,
Director of Site Content, StockCharts.com
KEY TAKEAWAYS
* Energy stocks are in focus as US crude oil prices continue rising higher
* Oil prices have more room to rise but if prices go too high there may be demand pressures
* Diamondback Energy is getting close to its 52-week high
With Labor Day weekend behind us, it'...
READ MORE
MEMBERS ONLY
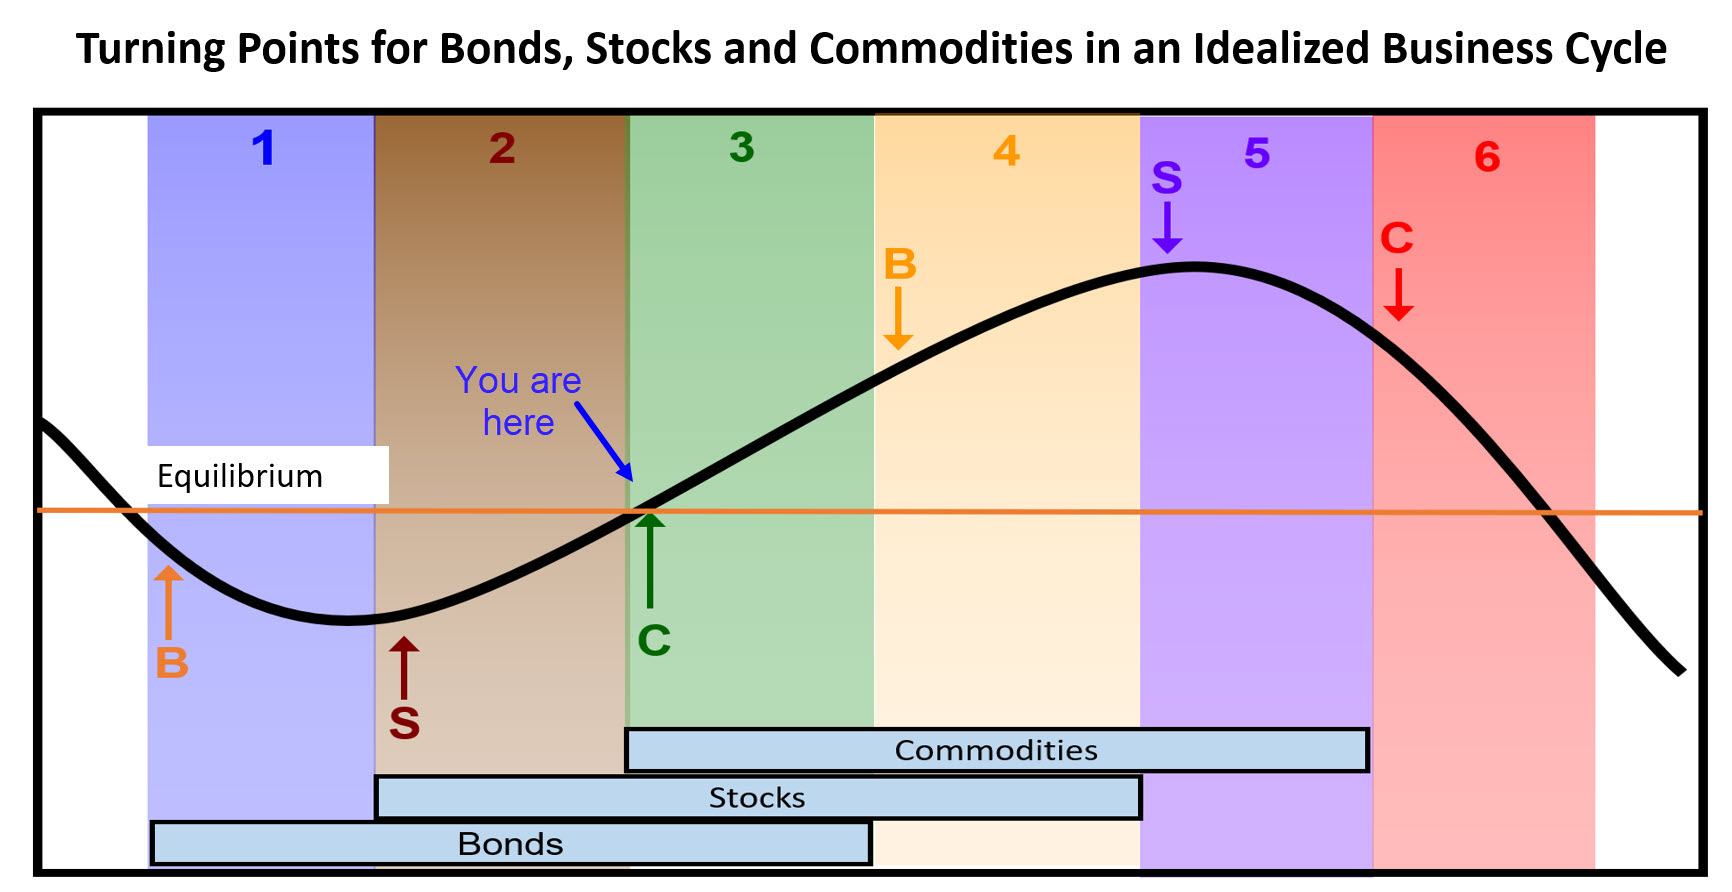
Some Investment Implications for Stage 3 of the Business Cycle

by Martin Pring,
President, Pring Research
The business cycle has been with us for as long as reliable financial records have been available, and that's at least 200 years. It may seem to be a mysterious force, but it is nothing more than a set sequence of chronological events that just keeps repeating. The...
READ MORE
MEMBERS ONLY

Yields, Oil, US Dollar Rise, Equities Tepid: Stock Market Starts the Month With Mixed Signals
by Jayanthi Gopalakrishnan,
Director of Site Content, StockCharts.com
KEY TAKEAWAYS
* Overall, the stock market has managed to hold on to its upward rally even in spite of a pullback
* Crude oil prices rose on news of production cuts
* Treasury yields rose on the jobs report data
The much-awaited August jobs report was released on Friday. While it came...
READ MORE
MEMBERS ONLY
The GDP PCE ADP Waltz
Conference Board Economic Forecast:
Looking into 2024, we expect the volatility that dominated the US economy over the pandemic period to diminish. In the second half of 2024, we forecast that overall growth will return to more stable pre-pandemic rates, inflation will drift closer to 2 percent, and the Fed...
READ MORE
MEMBERS ONLY

Will the Rotation to Small Caps Hold and Last THIS TIME?
In this special edition of StockCharts TV'sThe Final Bar, guest host Mish Schneider (MarketGauge) steps in for Dave. Mish puts her own spin on the Market Recap, starting with the indices and exploring sectors using her "Economic Modern Family" analysis.
Mish then sits down with Keith...
READ MORE
MEMBERS ONLY
Trading With the Williams Money Flow Index
by Karl Montevirgen,
The StockCharts Insider
KEY TAKEAWAYS
* Large pools of "informed money" have a significant impact on price movements in the market
* The Williams Money Flow Index is designed to reveal "institutional" buying and selling activity that may sway the longer-term price direction
* The Williams Money Flow Index can be applied...
READ MORE
