MEMBERS ONLY

Navigating Global Uncertainty with Coinbase (COIN)

Cryptocurrency prices have been under pressure. Here's a bear put spread options setup for a short-term bearish trade in COIN.... READ MORE
Cryptocurrency prices have been under pressure. Here's a bear put spread options setup for a short-term bearish trade in COIN.... READ MORE
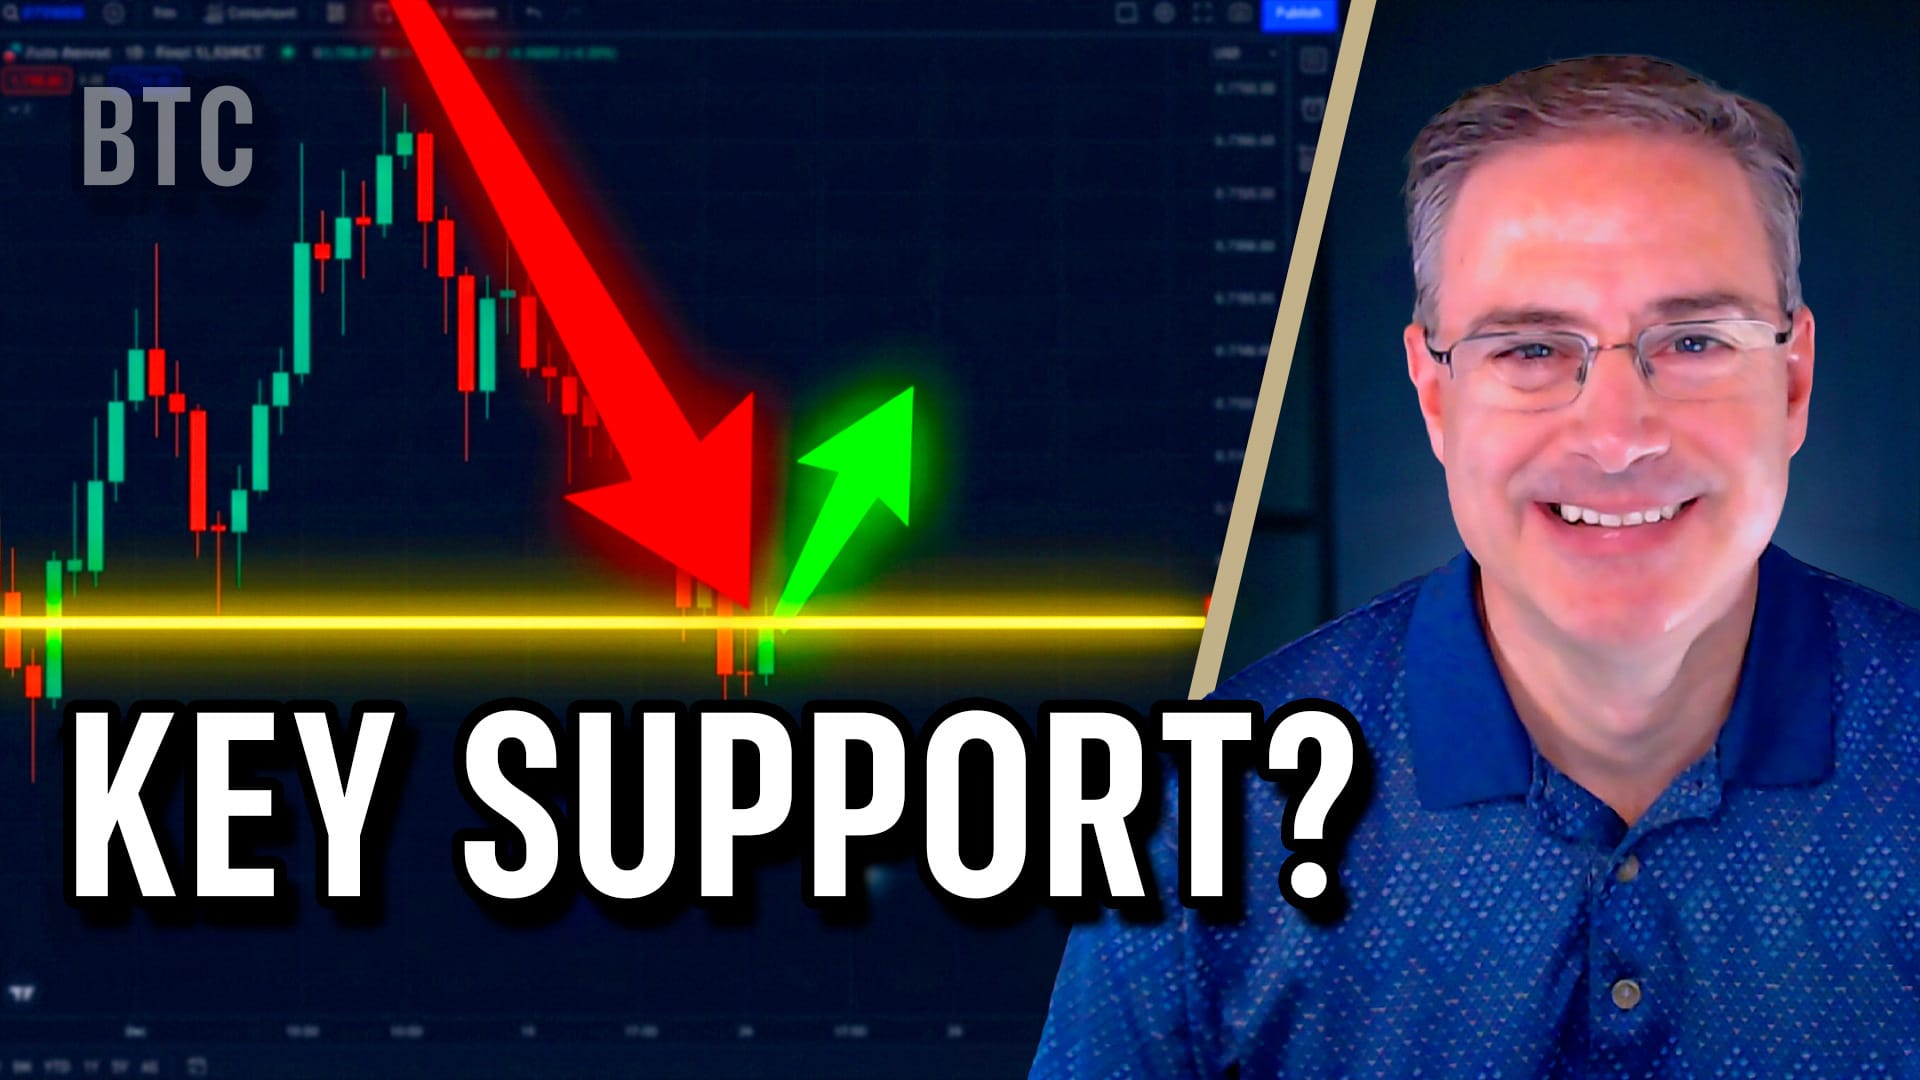

Joe Rabil explains why Bitcoin is sitting at key support near a major retracement level and what would confirm an interim low. He also reviews SPY volatility, sentiment, ADX conditions, and several stock setups.... READ MORE
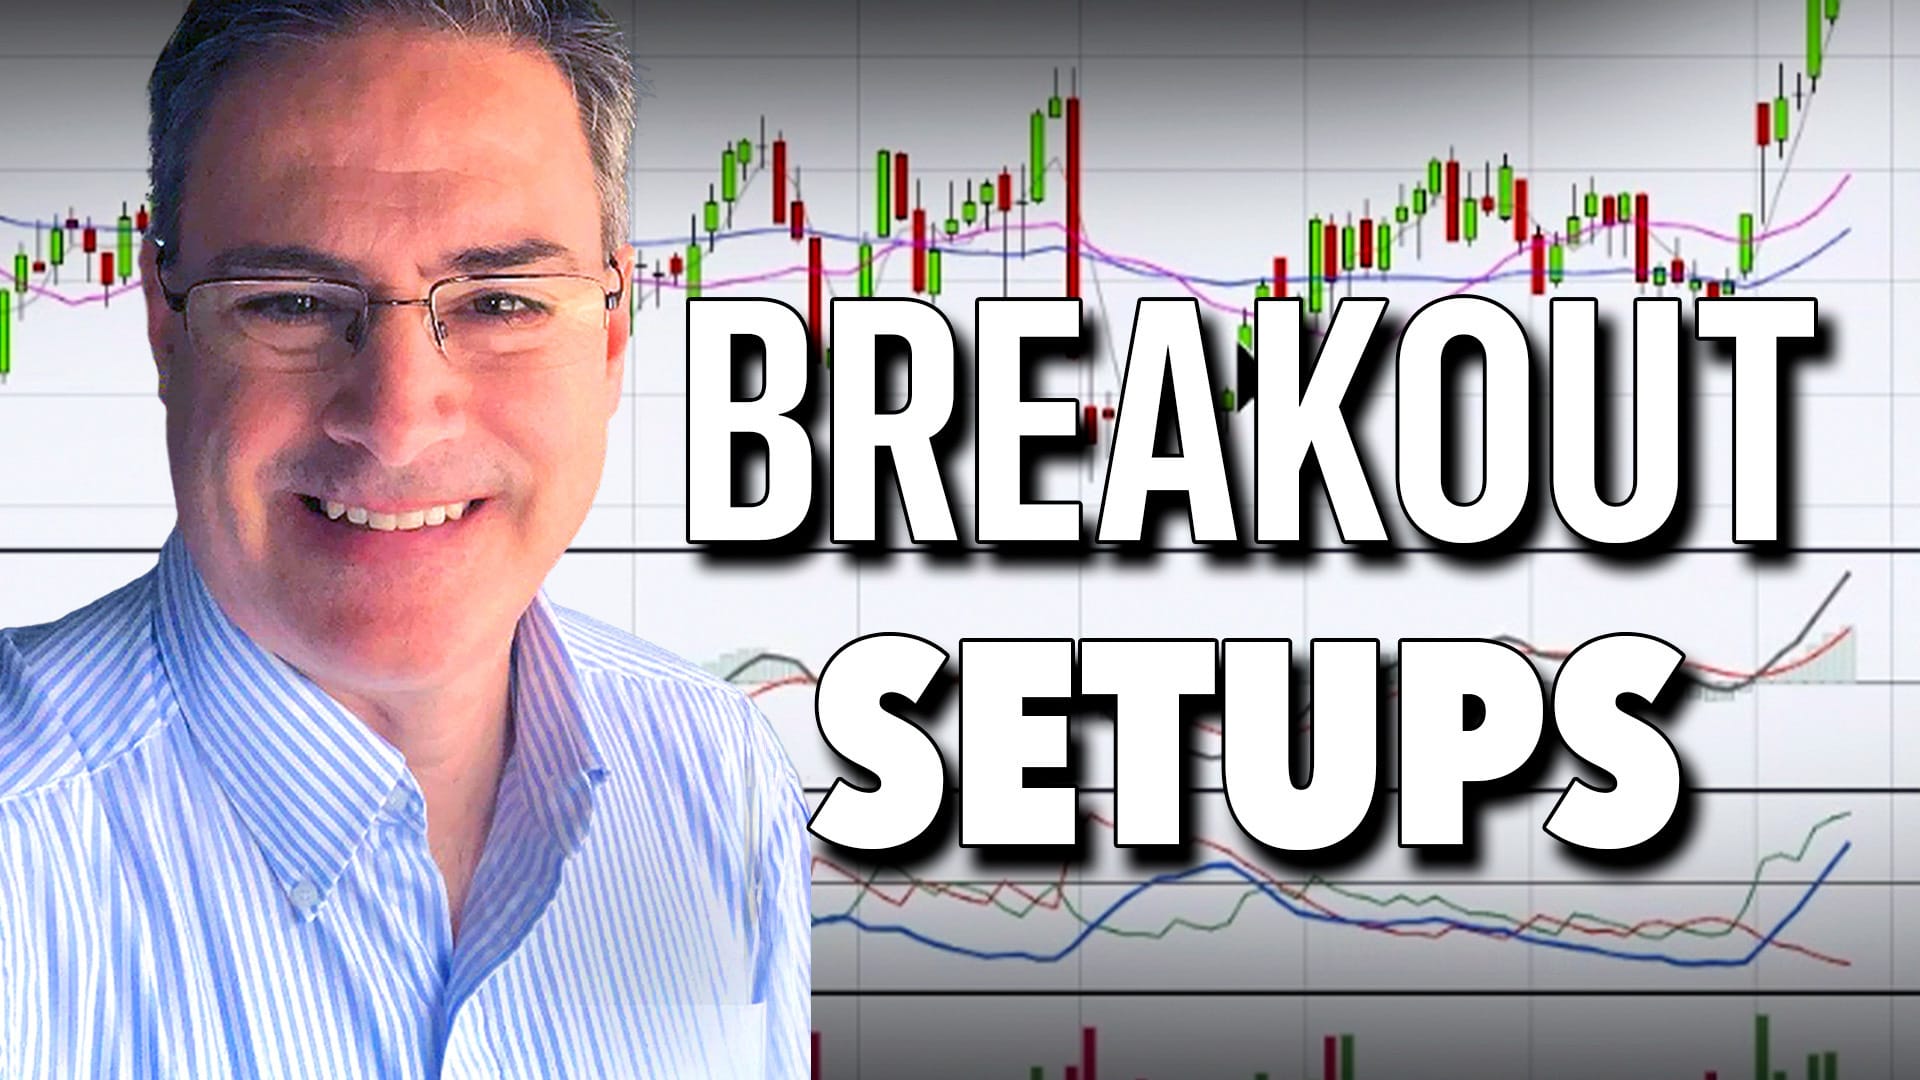
Joe Rabil highlights breakout setups that are forming and explains what to watch for in a quality breakout entry. He also takes a look at SPY market conditions, volatility, sentiment, and Bitcoin’s technical outlook.... READ MORE


Cryptocurrencies continue to slide, and the charts suggest a further drop is possible. Could we see a double bottom or a drop to the 61.8% Fibonacci retracement level?... READ MORE


Frank Cappelleri breaks down why financials and semiconductors are showing strength and how Bitcoin is attempting to regain momentum early in 2026. Failed breakdowns, bullish patterns, and key levels are shaping what happens next in the market.... READ MORE


Bitcoin has recently sold off sharply. Was 2025 the top, or will prices continue to rise higher in 2026? Martin Pring analyzes Bitcoin from various angles and shares his perspective.... READ MORE
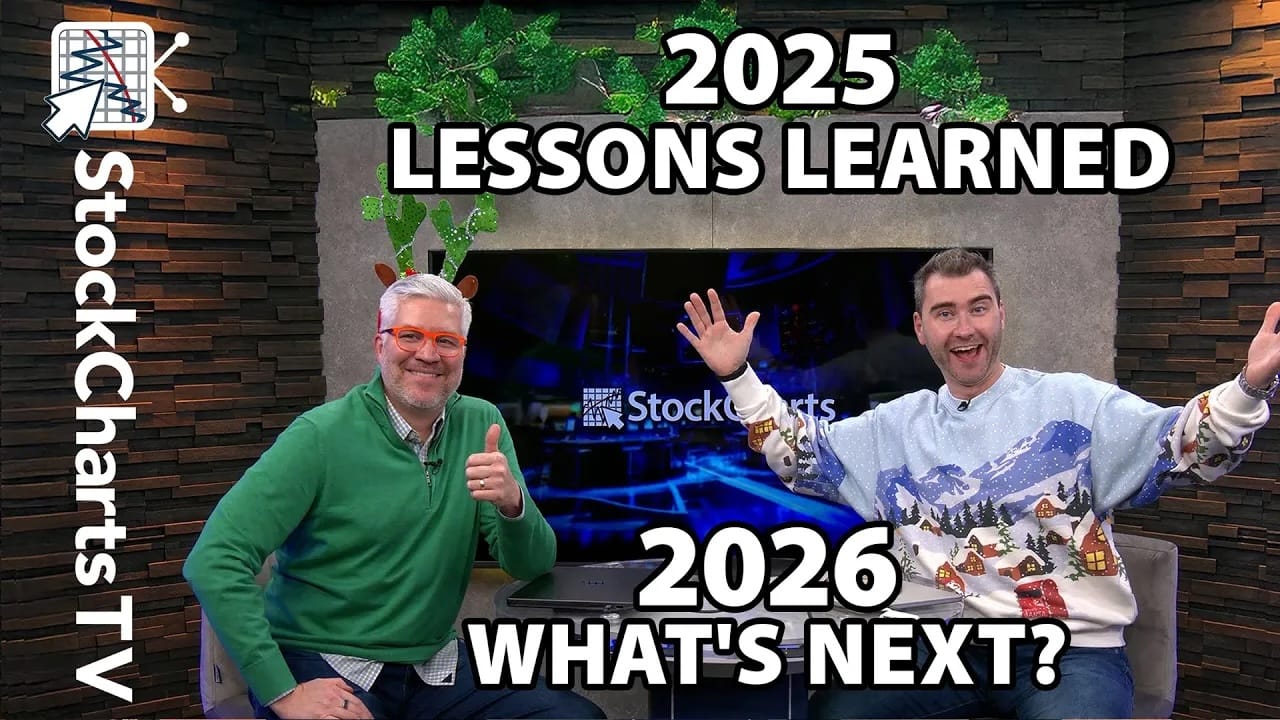


Grayson and Dave give their year-end thoughts about the wild market action of 2025, what worked (or not) for traders over the course of the year, and what lessons to take for 2026. ... READ MORE

The S&P 500 defends key support after a CPI surprise. Explore what the charts reveal about stocks, crypto, and precious metals.... READ MORE


Bitcoin and the S&P 500 often move in tandem, but when they move in opposite directions, it's time to pay attention. Find out what Tom Bowley's analysis reveals about Bitcoin signaling an early warning.... READ MORE
In this video, Joe Rabil of Rabil Stock Research takes a fresh look at Bitcoin, breaking down how its trend is shifting and what the MACD and ADX signals could mean for the next big move. He also touches on the psychological 100K level and how the broader risk-on/risk-off... READ MORE
In this video, Frank Cappelleri takes us on a tour of the market, discussing the Nasdaq 100's huge run since April and the healthy pullback that followed. He points out a possible inverse head-and-shoulders pattern forming under the surface and why it could matter as we head toward... READ MORE
David Keller, CMT uses the modern Dow Theory, sector rotation, and Bitcoin’s decline to illustrate what might be a developing market top. With StockCharts’ tools, Dave tracks weakening momentum, defensive shifts, and the S&P 500’s crucial 6550 support level.... READ MORE

Martin Pring analyzes Bitcoin using charts of different time frames, highlighting key support levels and divergences. Keep an eye on these charts.... READ MORE
Joe Rabil breaks down the MACD warning and weakening momentum in the S&P 500 as the index tests support near its 18-week moving average. Additionally, he reviews Bitcoin’s reversal setup and highlights stocks with improving relative strength and trend structure.... READ MORE

Cryptocurrencies have been under pressure, and two key chart developments indicate further downside. Here's what you need to watch as the year-end approaches.... READ MORE


When technology ETFs are breaking down, insurance stocks and bonds are showing strength, and Bitcoin is triggering a downtrend, it means the stock market is showing signs of risk aversion. Arthur Hill analyzes charts of these asset groups and identifies the signals they are sending.... READ MORE

Joe Rabil spotlights an ADX setup signaling that auto stocks may be ready to break out. He also reviews the S&P market trends, volatility, and key stock requests like Meta and Bitcoin.... READ MORE
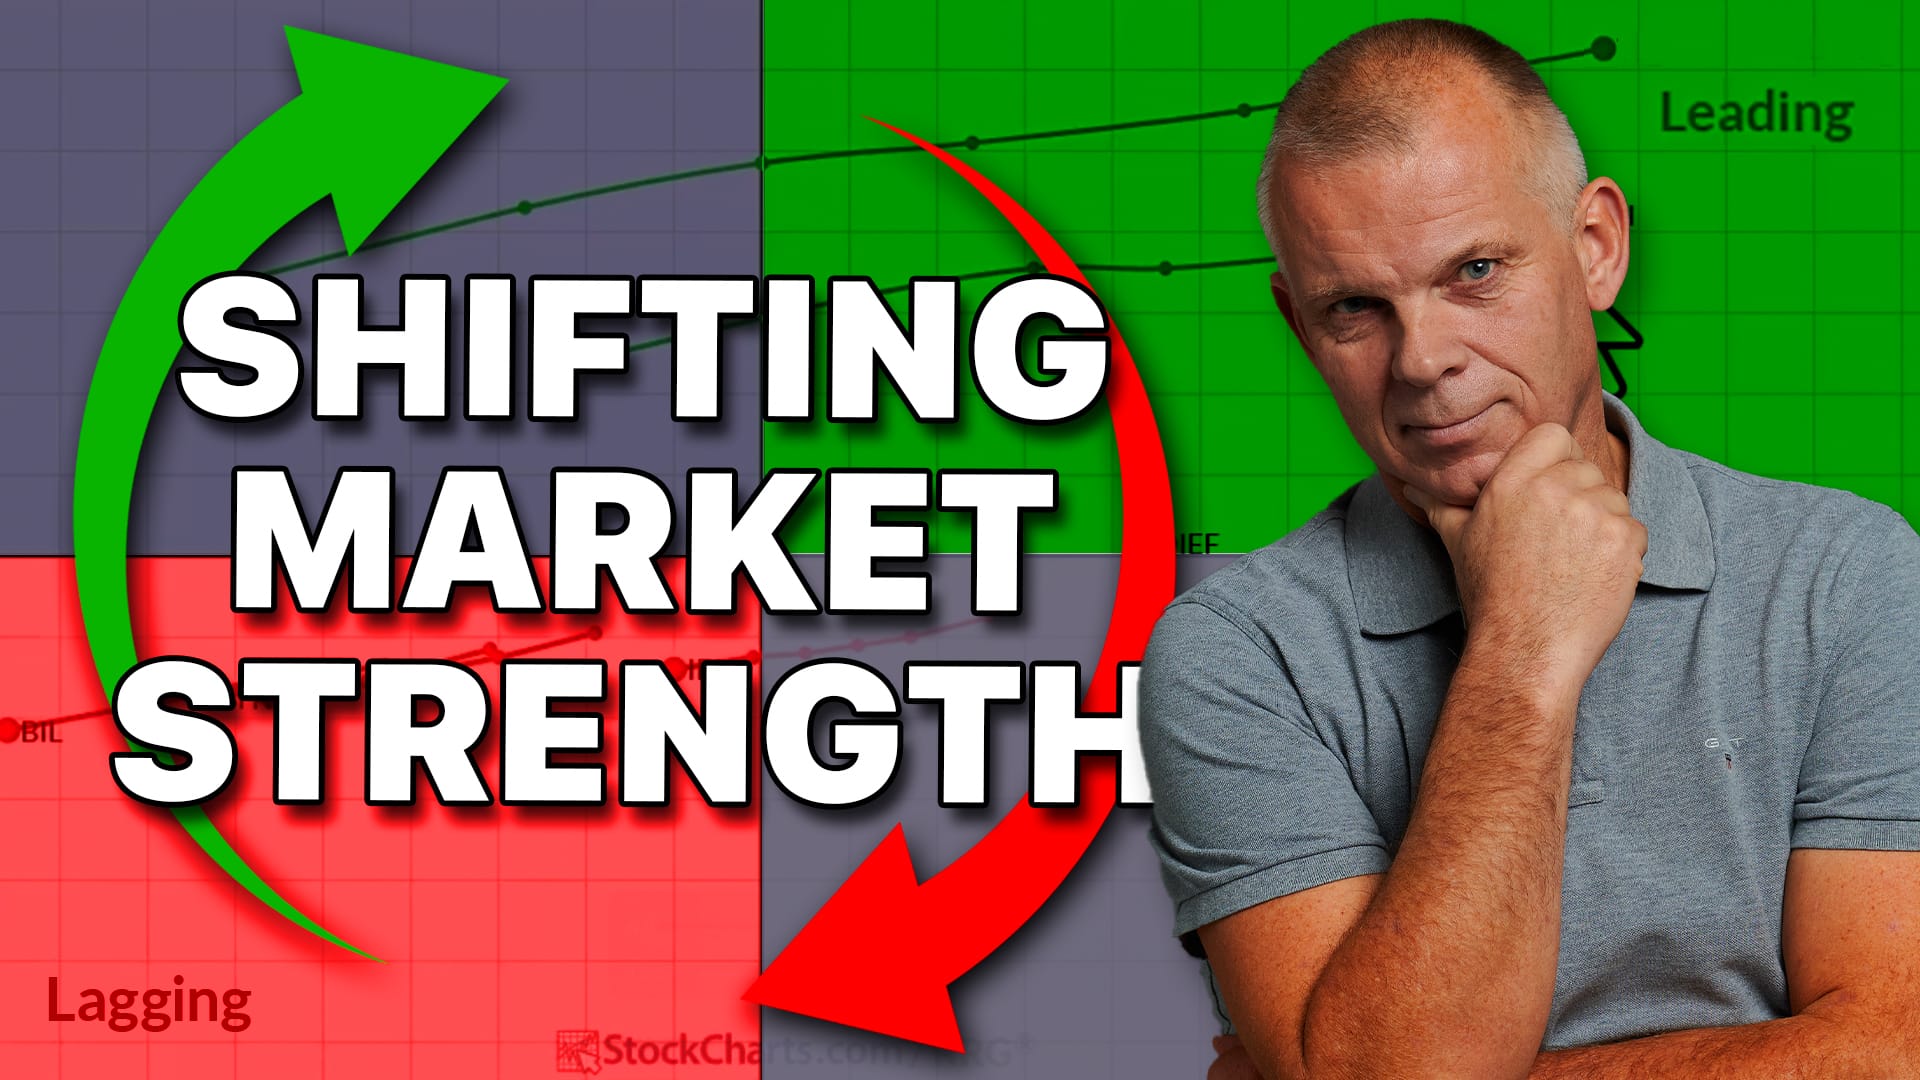

Julius builds on his new portfolio framework to reveal where market strength is shifting across asset classes and sectors. While stocks and commodities continue to lead, Julius breaks down the changes happening beneath the surface.... READ MORE
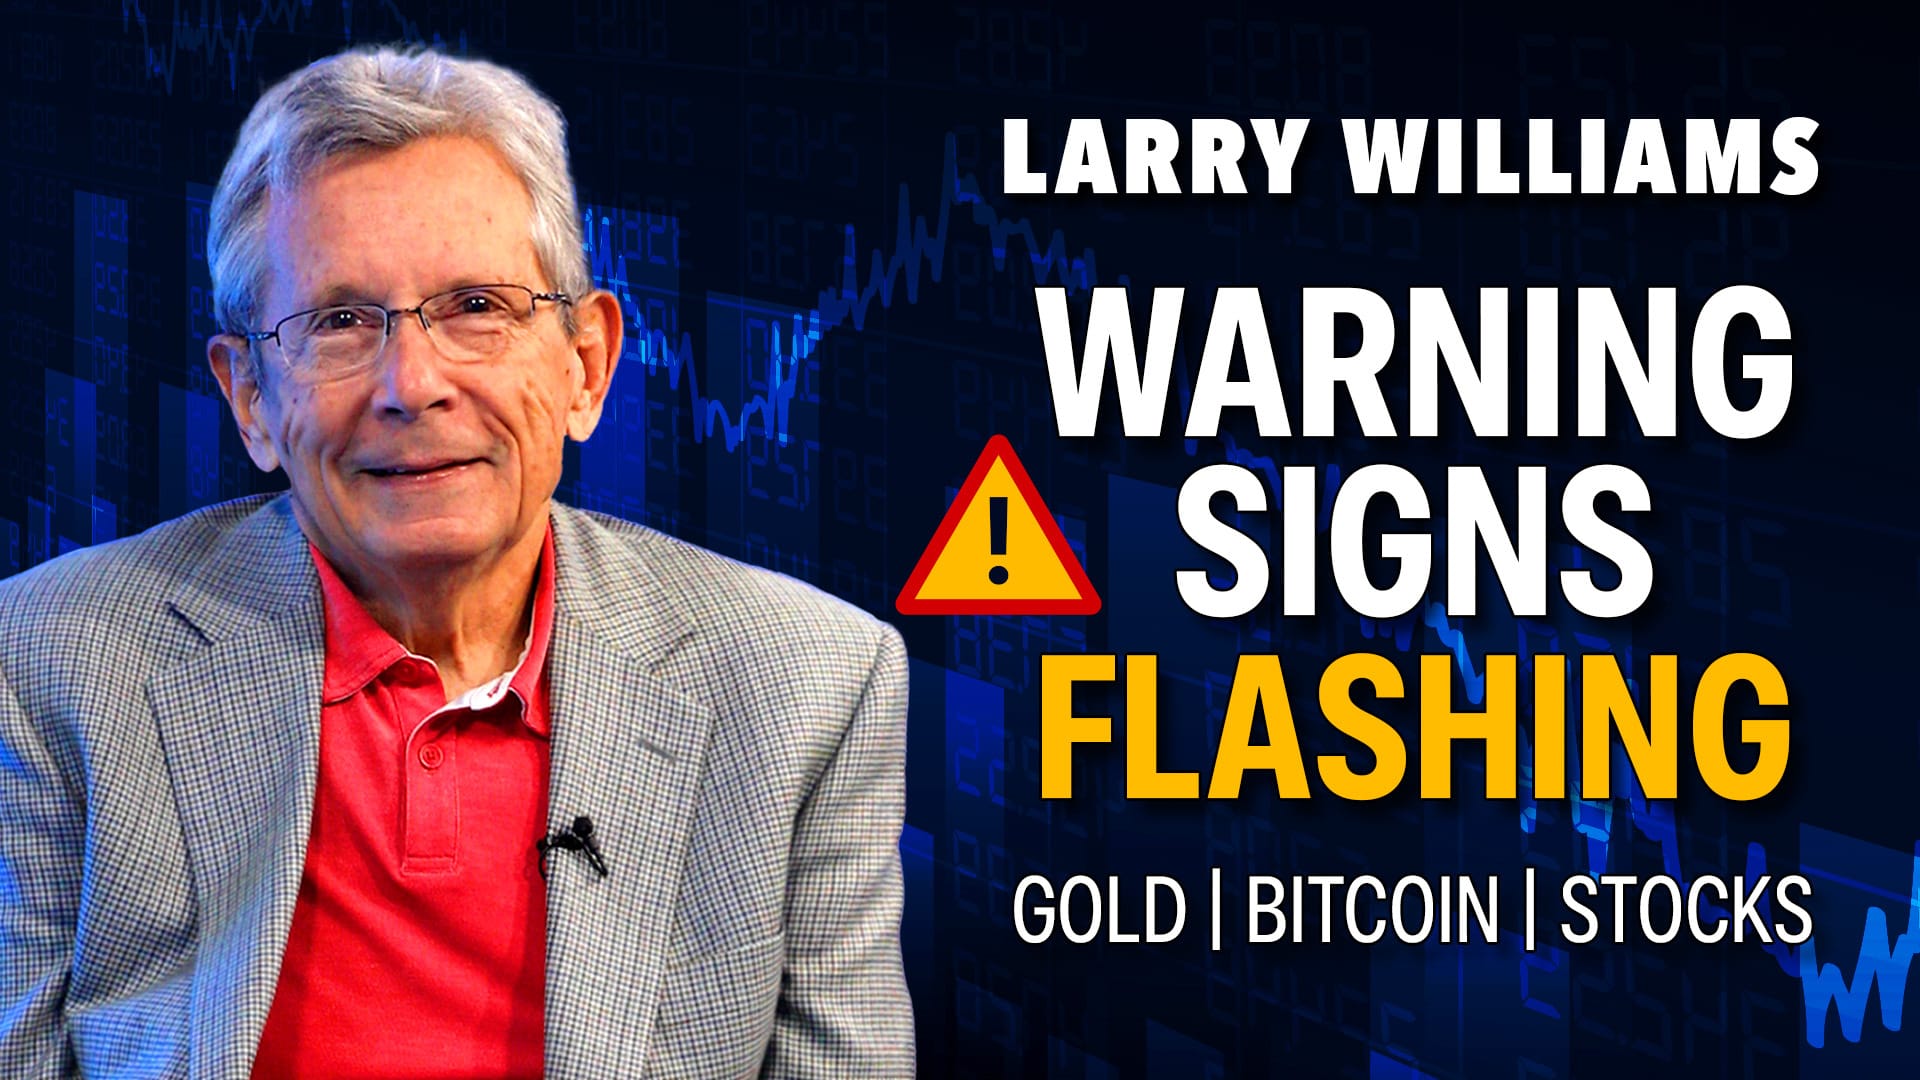

Larry Williams reveals why gold, Bitcoin, and stocks are flashing warning signs, backed by cycles, sentiment, and valuation data. See what seasoned traders are watching as these major markets show signs of weakness.... READ MORE

Stocks rebound as buyers return, but will momentum last? See key charts, trends, and signals shaping the next market move.... READ MORE

Intermarket relationships between stocks, bonds, the US dollar, and commodities are unsettled at the moment. What happens next? Here are the charts investors should be watching for clues.... READ MORE

Follow along as Frank Cappelleri breaks down the S&P 500’s pullback, small-cap growth momentum, biotech leadership, and Bitcoin’s key support test. See what patterns and sector shifts could define the next market move!... READ MORE
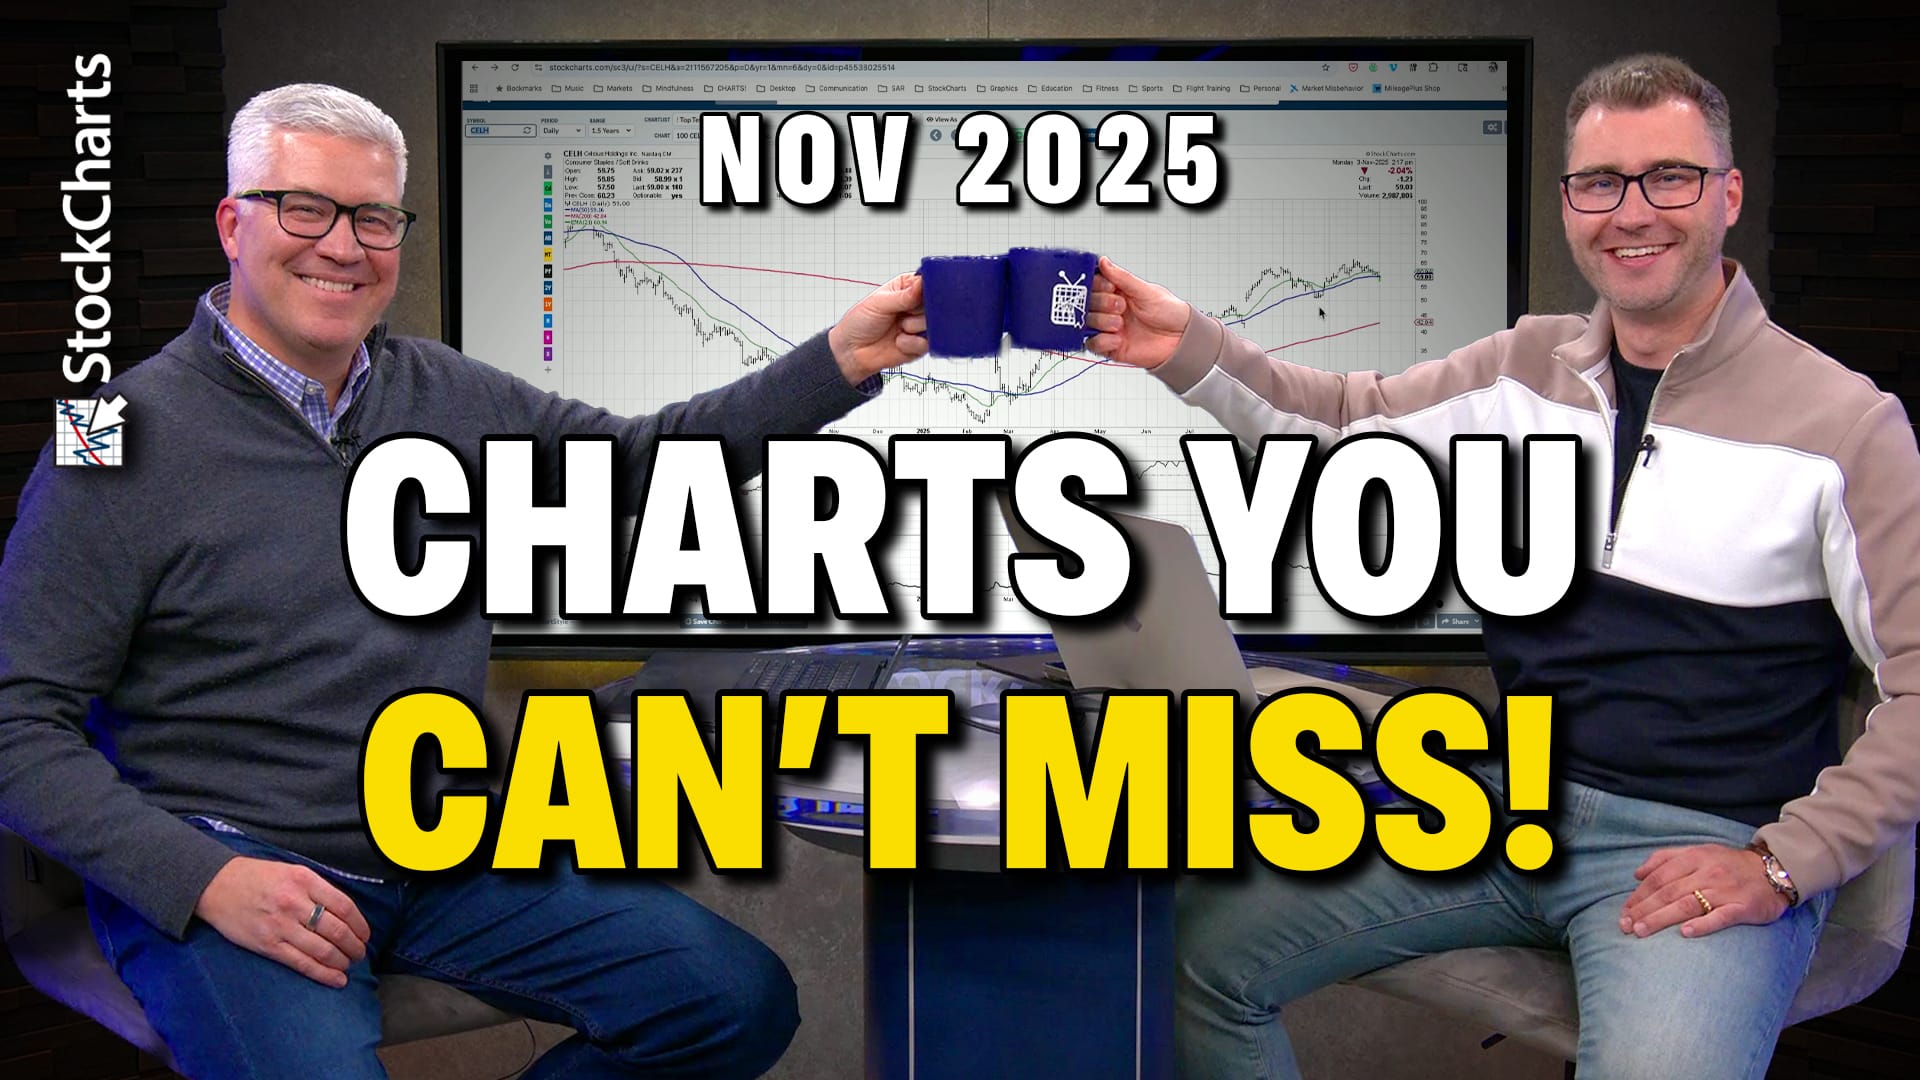
Grayson Roze and David Keller share ten charts to watch for November, including setups in Celsius, Regeneron, Caterpillar, Eli Lilly, and Shopify. Learn how they use StockCharts tools and trend analysis to locate strength and manage risk in a stretched bull market.... READ MORE
Frank Cappelleri analyzes the S&P 500, small-cap value, gold, and Bitcoin after October's pullback. He explores chart patterns, momentum, and divergences to reveal what may come next for key markets.... READ MORE

Gold is completing multi-year consolidation or reversal patterns relative to different asset classes, setting the stage for significant breakouts. Here's an analysis of these different intermarket relationships.... READ MORE

Japan's Nikkei surges and France faces fresh turmoil, shaking global rates as U.S. stocks hit records. Here's what it means for the dollar, gold, and bitcoin.... READ MORE

Mary Ellen reviews the week’s market action, highlighting leadership shifts in semiconductors, health care, utilities, and alternative energy. As sector rotation continues, she also shares how biotechs, small caps, and select quantum and crypto names are setting up with new opportunities. New videos from Mary Ellen premiere weekly on... READ MORE
Frank reviews the S&P 500, key ETFs, and major asset classes as September 2025 ends and the fourth quarter begins. He highlights surprising market calm, talks seasonality patterns, and makes comparisons to 2017 and 2018. His analysis covers MSOS cannabis, biotech ETFs, Bitcoin’s October seasonality, and gold’... READ MORE

Mary Ellen breaks down where strength is emerging beneath the surface of the markets, highlighting leadership in energy stocks, utilities, and industrials. She then shares setups in coal, natural gas, and electricity names, along with constructive moves in DOW components like INTC, IBM, AAPL, and CAT. In addition, she takes... READ MORE

Larry compares Bitcoin and gold, looking at their shared appeal; he notes caution signals for Bitcoin and similar risks for gold. He also revisits past forecasts and updates his market outlook.... READ MORE

Stocks rebounded after Tuesday’s dip, but Friday’s jobs report could be the real market mover. Here’s what investors need to watch. ... READ MORE

Signs of correction and rotation emerged this week as money moved out of tech-related groups and into defensive groups. Here's a perspective on this week's rotation with some year-to-date performance metrics.... READ MORE
In this market update, Frank takes a close look at the S&P 500, key indices, ETFs, crypto, and a recent trade idea. Frank compares the 2025 market to 2020 patterns, reviewing corrections and highlighting bullish and bearish setups. He focuses on weekly Bollinger Bands, GoNoGo charts, sector performance... READ MORE

Earlier this summer, I pointed out that Bitcoin had experienced a bearish shooting star on the day it experienced a new all-time high, and noted that this probably foreshadowed some short-term weakness. I pointed out that no damage whatsoever had been done to the basic uptrend, as the consensus of... READ MORE

Here's a deep dive into the differences between the 2024 bull market and 2025 bull run, small-cap performance, the price action in Bitcoin and gold, and the Bollinger Band squeeze in Tesla's stock price.... READ MORE

Stock market correction risks are rising as key indicators flash warnings. Discover sector correlations with SPY, potential safe havens, and how Bitcoin's surge aligns with QQQ in this data-driven analysis.... READ MORE

In this video, Julius breaks down current market trends using Relative Rotation Graphs (RRG). He examines weekly and daily asset class rotations, highlighting key developments in stocks, commodities, bonds, the U.S. dollar, and crypto. From there, Julius analyzes sector momentum shifts, including technology, energy, and real estate, and explains... READ MORE
From the S&P 500's pause within a bullish trend, to critical support levels in semiconductors, plus bullish breakouts in Ethereum and Bitcoin, Frank highlights how the market's recent consolidation may lead to major upside. In this video, Frank explores how to use StockCharts to... READ MORE

Bitcoin broke out to a new all-time high last week, so it seemed to me that it would be a good time to come out with a bullish article. After all, Chart 1 shows that a solid breakout came from a one-year reverse head-and-shoulders pattern, which was also accompanied by... READ MORE


KEY TAKEAWAYS * $BTCUSD recently broke above critical resistance at $112k. * Historically, the crypto has made significant moves after clearing a prolonged period of sideways trading. * It's time to set upside and downside targets—key levels we discuss below. Bitcoin ($BTCUSD) is riding a wave of surging optimism, smashing... READ MORE