MEMBERS ONLY

Loved to Unloved: Why the Financials Sector is the S&P 500 Bellwether Right Now
The Financials sector is lagging in 2026, but a trend reversal may be near. Analyze the key support levels and stock charts to watch before the start of the next earnings season....
READ MORE
MEMBERS ONLY

Cracks in Mega-Cap Leadership: What MSFT, AMZN, and TSLA Are Telling Us

by David Keller,
President and Chief Strategist, Sierra Alpha Research
Mega cap leaders are beginning to weaken beneath the surface of a rangebound market. Dave Keller, CMT, highlights bearish patterns in Microsoft, Amazon, and Tesla, raising concerns that deteriorating leadership could lead to further downside for the S&P 500 and Nasdaq....
READ MORE
MEMBERS ONLY

Enterprise IT Spending Shows Signs of Cooling: A Bearish Setup In Cisco

by Tony Zhang,
Chief Strategist, OptionsPlay
Enterprise IT spending may be slowing. See how weakening momentum in CSCO stock and a bearish options setup could present trading opportunities....
READ MORE
MEMBERS ONLY

Fed Uncertainty Sparks Selloff — This Level Matters Now

by Tom Bowley,
Chief Market Strategist, EarningsBeats.com
Hot inflation data and Fed uncertainty triggered a sharp late-day selloff in stocks and bonds. Tom Bowley breaks down weakening breadth, rising volatility, and why the S&P 500’s key support level could determine what happens next....
READ MORE
MEMBERS ONLY
These Charts Could Decide the Next Market Move
by David Keller,
President and Chief Strategist, Sierra Alpha Research
Why hasn’t the market broken down, even amid weakening breadth? Dave Keller shows how a small group of mega-cap stocks may be holding the indexes together, and the key levels that could decide the next market move....
READ MORE
MEMBERS ONLY

The AI Supercycle: How the AMAT-Micron Alliance is Shaping the Future of Tech

by Mary Ellen McGonagle,
President, MEM Investment Research
Mary Ellen McGonagel digs into the topic of supercycles and where we at in a new AI-driven supercycle....
READ MORE
MEMBERS ONLY

Stock Market Is Sending Mixed Signals; Here’s What to Watch

by Jayanthi Gopalakrishnan,
Director of Site Content, StockCharts.com
The stock market is sending mixed signals. See what the charts reveal about current trends and why semiconductors may lead the next move....
READ MORE
MEMBERS ONLY

Rising Oil Prices, Rising Fear — What the Charts Are Showing Now
by Mary Ellen McGonagle,
President, MEM Investment Research
Rising oil prices and geopolitical tensions pushed volatility higher as the S&P 500 tested key support levels. Mary Ellen McGonagle analyzes what the charts reveal about inflation fears, sector weakness, and the few pockets of strength emerging in this volatile market....
READ MORE
MEMBERS ONLY

Market Breadth Breaks Down, but These Stocks Still Look Strong
by David Keller,
President and Chief Strategist, Sierra Alpha Research
Even as market breadth deteriorates and the S&P 500 slips below key support, strong setups still exist. Dave Keller, CMT, highlights Marathon Petroleum, Target, and Palantir — three charts showing breakouts, trend strength, and improving momentum into March....
READ MORE
MEMBERS ONLY

Two Bullish Inter-Asset Relationships that Could Signal the Next Bear Market

by Martin Pring,
President, Pring Research
Martin Pring analyzes the behavior of two inter-asset relationships, namely Stocks vs. Commodities and Stocks vs. Bonds. Read about his insights and know how to uncover the clues going forward....
READ MORE
MEMBERS ONLY
This RSI Setup Could Be Your First Entry After the Breakout

by Joe Rabil,
President, Rabil Stock Research
Joe Rabil shows how a specific RSI setup can help traders identify the first pullback entry after a breakout. He also reviews S&P 500 volatility, sentiment, QQQ, IWM, and several stock setups....
READ MORE
MEMBERS ONLY

Is Distribution Hitting the S&P 500? What Traders Should Watch Now
As large-cap stocks dip to multi-month lows, some shifts are taking place that investors shouldn't ignore. Two indicators to watch are SPY distribution risk and the U.S. dollar's consolidation. Watch these charts closely....
READ MORE
MEMBERS ONLY

Navigating Global Uncertainty with Coinbase (COIN)
by Tony Zhang,
Chief Strategist, OptionsPlay
Cryptocurrency prices have been under pressure. Here's a bear put spread options setup for a short-term bearish trade in COIN....
READ MORE
MEMBERS ONLY
Top 10 Charts to Watch | March 2026 Breakouts & Inflection Points
by David Keller,
President and Chief Strategist, Sierra Alpha Research
With corporate earnings now behind us, investors can shift their focus to the trends taking shape in Q1.
In this video, David Keller, CMT, shares the top 10 charts he's watching for March 2026, and more importantly, why they matter right now. Dave organizes his charts into three...
READ MORE
MEMBERS ONLY

AI Trade Cools — Defensive Rotation Heats Up!
by Mary Ellen McGonagle,
President, MEM Investment Research
In spite of strong Nvidia earnings, the broader AI trade showed fatigue. Mary Ellen McGonagle highlights rotation into healthcare leaders and selective consumer discretionary stocks, but highlights where this market demands careful positioning going forward....
READ MORE
MEMBERS ONLY

When the Rally Stops Working: How to Know If Your AI Stock Is Rolling Over
by Mary Ellen McGonagle,
President, MEM Investment Research
When strong earnings stop driving higher prices, leadership may be shifting. Learn the chart signals that tell you when an AI stock is rolling over....
READ MORE
MEMBERS ONLY

Nervous Investors Should Look Here in March
by Tom Bowley,
Chief Market Strategist, EarningsBeats.com
The Utilities sector is approaching a seasonally strong month. Tom Bowley analyzes this sector and makes a case for why utility stocks may soar in March....
READ MORE
MEMBERS ONLY

Mag 7 Leaders and Laggards; 3 Trend Reversals; Analysis and Key Levels for Apple

by Arthur Hill,
Chief Technical Strategist, TrendInvestorPro.com
The Mag 7 stocks have lost steam since November. However, four of the seven are showing long-term uptrends. Arthur Hill analyzes each of these charts and identifies potential reversal or continuation levels....
READ MORE
MEMBERS ONLY
NVDA Earnings Preview: 5 Charts That Could Define the Next Major Move
by David Keller,
President and Chief Strategist, Sierra Alpha Research
With NVIDIA earnings having the potential to trigger a major move, Dave Keller takes a close look at it’s chart across multiple timeframes. From long-term PPO signals to key support and resistance, he explains the critical features that could confirm a breakout or breakdown....
READ MORE
MEMBERS ONLY

JPMorgan Crumbles as AI Disruption Hit Wall Street's Fortress
by Tony Zhang,
Chief Strategist, OptionsPlay
JPM's stock price is showing technical weakness. Here's a bearish options strategy setup with a compelling risk/reward structure. Explore how you can take advantage of it....
READ MORE
MEMBERS ONLY

Tariff Relief Rally? Why Retail Charts Tell a Mixed Story
Retail stocks rose after the recent tariff ruling, but the charts give a mixed story. Here's a look at four retail stocks with support, resistance, and congestion zones....
READ MORE
MEMBERS ONLY

The "AI Bubble" Didn't Burst. It Went on Sale.
by Tony Zhang,
Chief Strategist, OptionsPlay
Tony Zhang discusses a bullish counter-trend options setup for Amazon's stock. Here's how he found the trade and why he's seeing a high-conviction contrarian play....
READ MORE
MEMBERS ONLY
RSI Divergences Can Signal Major Tops — But Only If Confirmed!
by David Keller,
President and Chief Strategist, Sierra Alpha Research
RSI divergences can warn of potential major tops, but only if confirmed by breakdown signals. David Keller walks through DG, GOOGL, AT&T, and the S&P 500 to show what must happen before a divergence becomes actionable....
READ MORE
MEMBERS ONLY

Bottom Fishing or Breakdown? How to Spot a True Trend Reversal
by David Keller,
President and Chief Strategist, Sierra Alpha Research
When high-flying stocks tumble, is it a buying opportunity or the start of a deeper decline? Dave Keller, CMT, uses Alaska Air as a case study to show how momentum divergences and moving averages can confirm a true bottom—then applies the framework to PLTR and COIN....
READ MORE
MEMBERS ONLY
Sector Strength Is Building Even as the Market Stalls
by Joe Rabil,
President, Rabil Stock Research
Joe Rabil highlights improving sector strength and internal breadth, even as the broader market remains stuck in a range. He also reviews SPY conditions, volatility, sentiment, IWM relative strength, and select stock setups....
READ MORE
MEMBERS ONLY

Trillion-Dollar Walmart Hits New Highs Ahead of Earnings: What It Means for the Market
With Walmart's Q4 earnings on the horizon, Mike Zaccardi breaks down what makes WMT so critical this season and what's at stake for this year's leading sectors....
READ MORE
MEMBERS ONLY

AI Fears Introduce a New Wave of Market Volatility: Here’s How To Combat It
by Mary Ellen McGonagle,
President, MEM Investment Research
As the market experiences significant turbulence, Mary Ellen McGonagle talks ways to strategize beyond buy-and-hold. She also takes a look at EWJ in the wake of Japan's general election....
READ MORE
MEMBERS ONLY
AI Fears Are Driving Rotation as Short Covering Is Fueling the Bounce!
by Mary Ellen McGonagle,
President, MEM Investment Research
Mary Ellen McGonagle breaks down how AI disruption fears are driving defensive rotation, along with how elevated short interest is fueling sharp short-covering bounces. She highlights what’s behind the volatility and what investors should watch for as positioning shifts intensify....
READ MORE
MEMBERS ONLY

Semiconductors vs. Software: The Battle Driving This Market
by Tom Bowley,
Chief Market Strategist, EarningsBeats.com
Though the market remains range-bound, a growing split inside technology could decide the next move. Follow along as Tom Bowley breaks down the semiconductor breakout attempt, software weakness, and the key levels shaping this battle....
READ MORE
MEMBERS ONLY
These Breakout Setups Are Forming — Here’s What to Watch
by Joe Rabil,
President, Rabil Stock Research
Joe Rabil highlights breakout setups that are forming and explains what to watch for in a quality breakout entry. He also takes a look at SPY market conditions, volatility, sentiment, and Bitcoin’s technical outlook....
READ MORE
MEMBERS ONLY
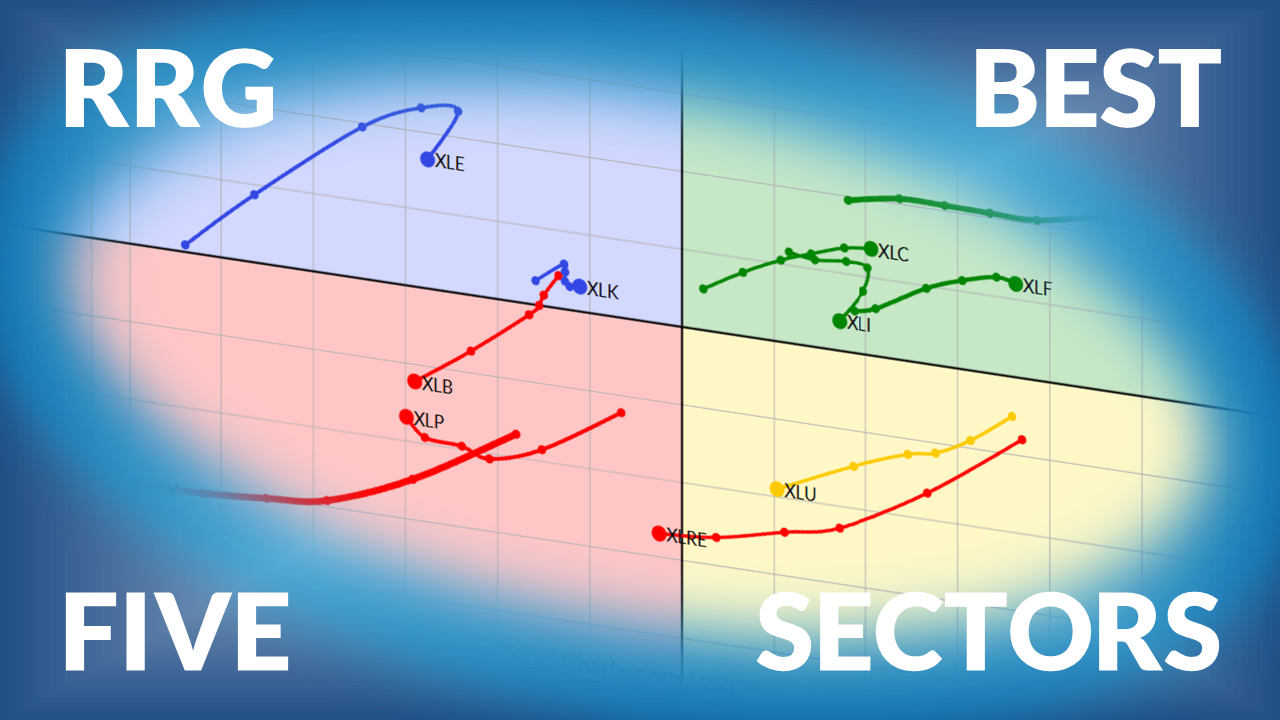
The Best Five Sectors This Week #52

by Julius de Kempenaer,
Senior Technical Analyst, StockCharts.com
Julius de Kempenaer presents his weekly update on sector rotation using Relative Rotation Graphs....
READ MORE
MEMBERS ONLY

Breaking Out: Cigna's Post-Earnings Recovery Just Getting Started
by Tony Zhang,
Chief Strategist, OptionsPlay
Cigna (CI) breaks out above $280 after a post-earnings selloff. In this article, Tony breaks down a compelling bullish options trade setup....
READ MORE
MEMBERS ONLY

The Market Just Made a Powerful Shift: These Stocks Poised to Rise the Highest
by Mary Ellen McGonagle,
President, MEM Investment Research
With tech companies making significant increases in their AI capex, investment patterns could shift. How do you position your portfolio around this shift? These two stocks are likely to benefit from the increased AI investment. ...
READ MORE
MEMBERS ONLY
Sector Rotation Is Picking Up — Here’s What’s Improving
by Joe Rabil,
President, Rabil Stock Research
Joe Rabil highlights sector rotation and shows which sectors and industry groups are improving based on relative strength. He also reviews SPY market conditions, rising volatility, sentiment, and recent symbol requests like KO and DG....
READ MORE
MEMBERS ONLY

AMD Earnings Fallout: What a Break Below $200 Would Really Mean
by David Keller,
President and Chief Strategist, Sierra Alpha Research
After a sharp post-earnings drop, AMD remains locked in a multi-month consolidation between $200 and $265. Dave Keller, CMT, breaks down how accumulation, distribution, and consolidation phases form, along with what price levels would confirm a decisive bearish shift....
READ MORE