MEMBERS ONLY

AI Infrastructure Is Leading — Not the Headlines!

by Mary Ellen McGonagle,
President, MEM Investment Research
Mary Ellen McGonagle breaks down why AI infrastructure continues to lead even as headline tech stocks struggle with earnings volatility. She highlights where capital is flowing under the surface and why long-term demand themes are holding up against short-term noise....
READ MORE
MEMBERS ONLY

Dow Theory Confirmed: Technology Holds Critical Support

by Tom Bowley,
Chief Market Strategist, EarningsBeats.com
The Dow Jones Industrial Average and Dow Jones Transportation Average notched record closes, indicating that economic conditions are strong. Even the S&P 500 and XLK bounced off key support levels. Does this mean we're out of the woods? Find out here....
READ MORE
MEMBERS ONLY
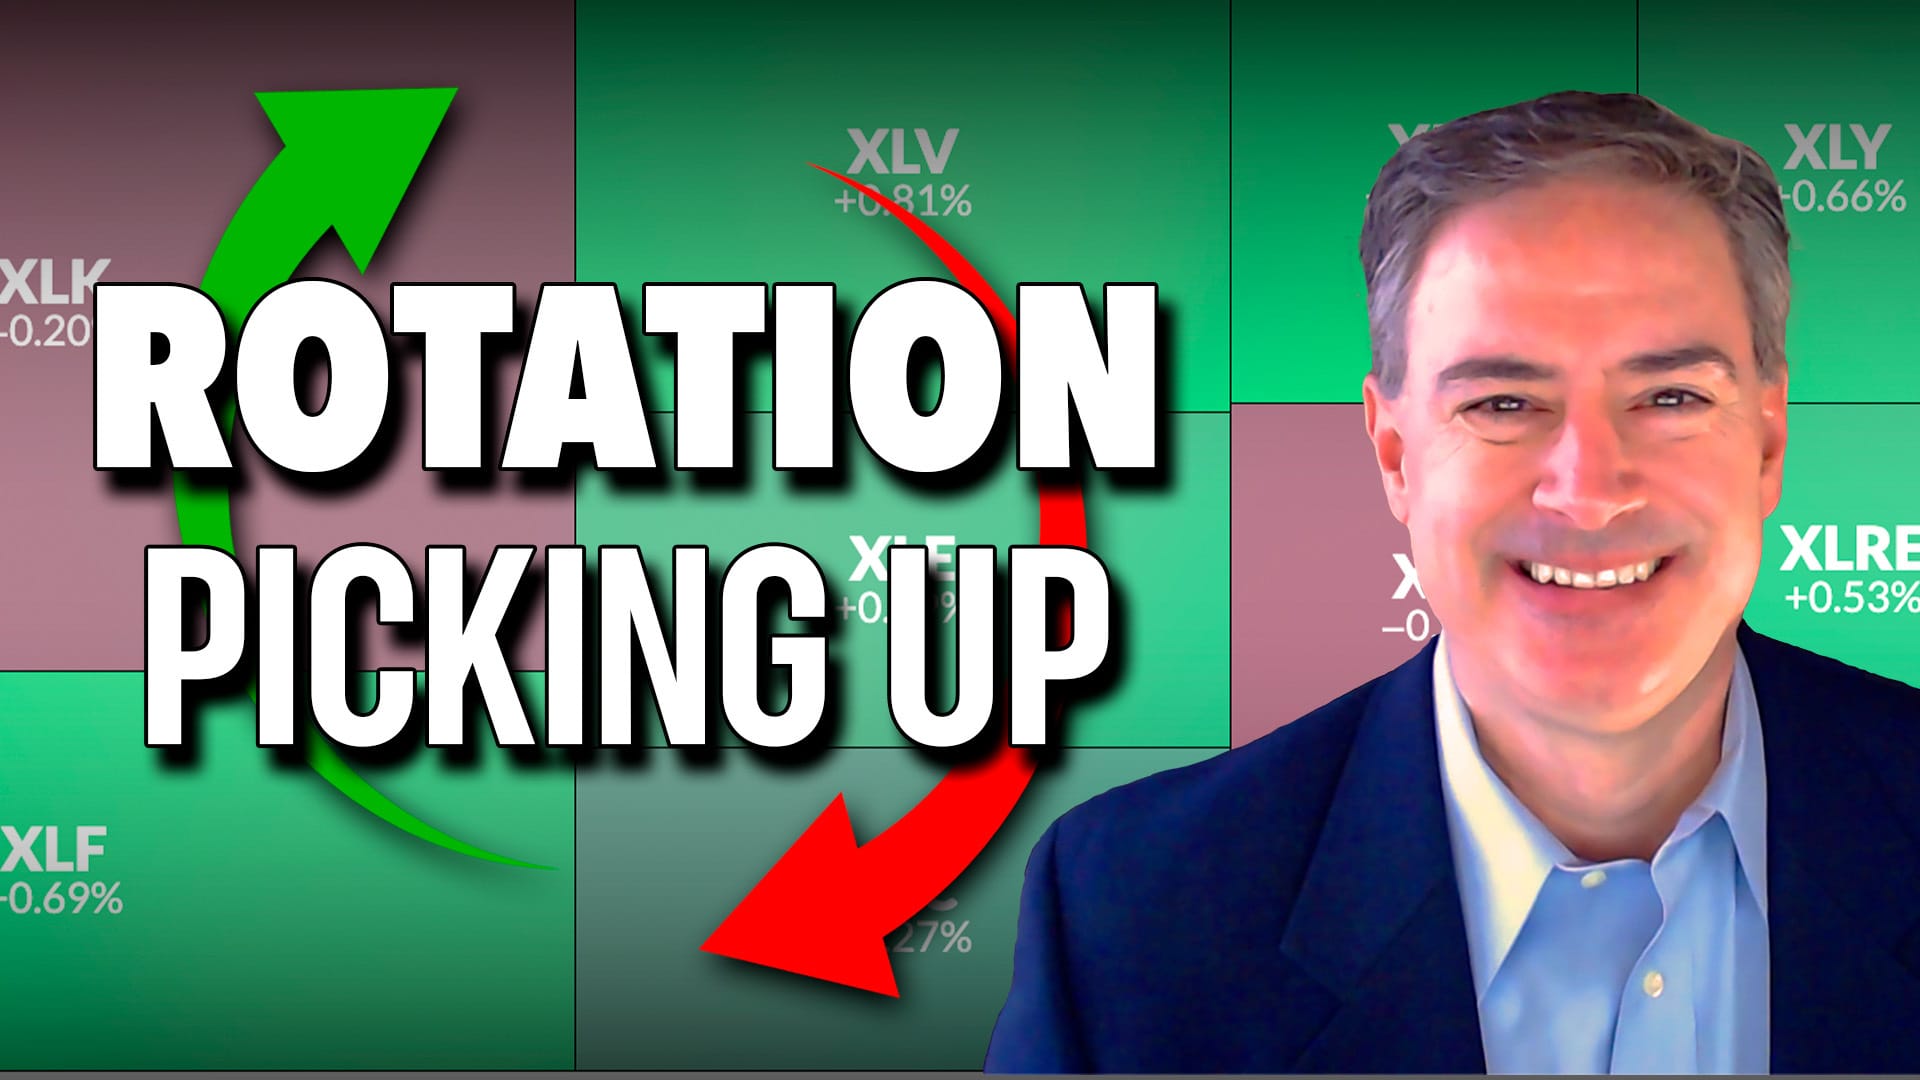
Sector Rotation Is Picking Up — Here’s What’s Improving

by Joe Rabil,
President, Rabil Stock Research
Joe Rabil highlights sector rotation and shows which sectors and industry groups are improving based on relative strength. He also reviews SPY market conditions, rising volatility, sentiment, and recent symbol requests like KO and DG....
READ MORE
MEMBERS ONLY

Earnings Shocks Aren’t Ending This Trend!
by Mary Ellen McGonagle,
President, MEM Investment Research
Mary Ellen McGonagle breaks down how sharp earnings reactions are driving volatility without breaking the broader market trend. She explains why recent pullbacks have been more about profit-taking and expectations than a meaningful shift in trend....
READ MORE
MEMBERS ONLY

Finance SPDR Takes a Hit, but Maintains Uptrend as Trading Setup Emerges

by Arthur Hill,
Chief Technical Strategist, TrendInvestorPro.com
In the last few weeks, the Financials sector took a hit. However, it's oversold within a long-term uptrend. Find out what indicators Arthur Hill uses to identify an ideal long setup....
READ MORE
MEMBERS ONLY

The Dollar Yo-Yo: What a Weak USD and Currency Wars Mean for Investors
As the U.S. dollar weakens, price action, not macro narratives, reveals shifting leadership across sectors and global markets....
READ MORE
MEMBERS ONLY
Tech Leadership Is Rotating. What’s Working Right Now?

by Frank Cappelleri,
Founder & President, CappThesis, LLC
Frank Cappelleri analyzes how leadership within tech is starting to rotate, with some areas holding breakouts while others struggle. Discover which parts of large-cap tech are still working and what patterns investors should be watching....
READ MORE
MEMBERS ONLY

These Areas Are Holding Up — Many Are Not!
by Mary Ellen McGonagle,
President, MEM Investment Research
Mary Ellen McGonagle breaks down a market where strength is holding up in only certain areas while many others continue to weaken. She highlights where relative strength is showing up, where momentum is fading, and what investors should be watching in a selective market....
READ MORE
MEMBERS ONLY

A Four Point Plan Using Market Analysis, PPO, and CCI to Find Robust Entry Points
by Arthur Hill,
Chief Technical Strategist, TrendInvestorPro.com
If you're looking to build a position in a specific industry group ETF, here's a four-point plan to follow....
READ MORE
MEMBERS ONLY

It’s That Time in the Cycle for Materials; Do the Technicals Agree?

by Martin Pring,
President, Pring Research
Are we in the late stage of a business cycle that benefits mining, energy, and basic industry sectors? Martin Pring analyzes the technicals of the sectors to identify where we are in the cycle....
READ MORE
MEMBERS ONLY

The State of the Market: Trend, Breadth & Leadership, Plus a Trend-Momentum Strategy
by Arthur Hill,
Chief Technical Strategist, TrendInvestorPro.com
The S&P 500 is in a clear uptrend with strong breadth, and three sectors leading the trend are Finance, Health Care, and Industrials. Arthur Hills shows you how to use a top-down approach to identify oversold stocks within uptrends....
READ MORE
MEMBERS ONLY

Broadening, Broadening Everywhere in Early 2026: Record-High Mid-Caps
A shift is taking place in the stock market that investors shouldn't ignore. As leadership rotates beyond mega-cap stocks, mid-caps are breaking to record highs. What does this early-year price action indicate? Find out here....
READ MORE
MEMBERS ONLY

Why Financials May Matter More Than Tech in Early 2026

by David Keller,
President and Chief Strategist, Sierra Alpha Research
As we head into 2026, signs of rotating market leadership are already emerging, and the Financial sector is starting to attract attention. In this video, David Keller, CMT, takes a deep dive into the Financial sector, the yield curve, and the shifting interest rate dynamics.
Dave breaks down what the...
READ MORE
MEMBERS ONLY

Maduro’s Fall, Energy’s Rise: Oil & XLE Are Back in Focus, Key Price Levels to Watch
Energy stocks are off to a good start, and after recent geopolitical headlines, you may want to consider this long-time underperforming sector. A break above key technical resistance levels will determine if energy stocks have staying power....
READ MORE
MEMBERS ONLY

The Stock Market May Be Waking Up: It’s Not Just Tech Anymore

by Jayanthi Gopalakrishnan,
Director of Site Content, StockCharts.com
Friday's market bounce brought a surprise: strength beyond Big Tech. See which sectors and ETFs are leading, and what it could mean for 2026....
READ MORE
MEMBERS ONLY

Capital Rotates Into Defense Stocks as the “Golden Dome” Theme Gains Traction
by Mary Ellen McGonagle,
President, MEM Investment Research
Defense stocks offer earnings visibility and act as a hedge against geopolitical risk. Here's a look at why defense-related stocks may be potential investment opportunities....
READ MORE
MEMBERS ONLY

5 Charts That Will Define Markets in 2026
What's on tap for 2026? Here's a deep dive into the five charts that matter most as this bull market matures....
READ MORE
MEMBERS ONLY
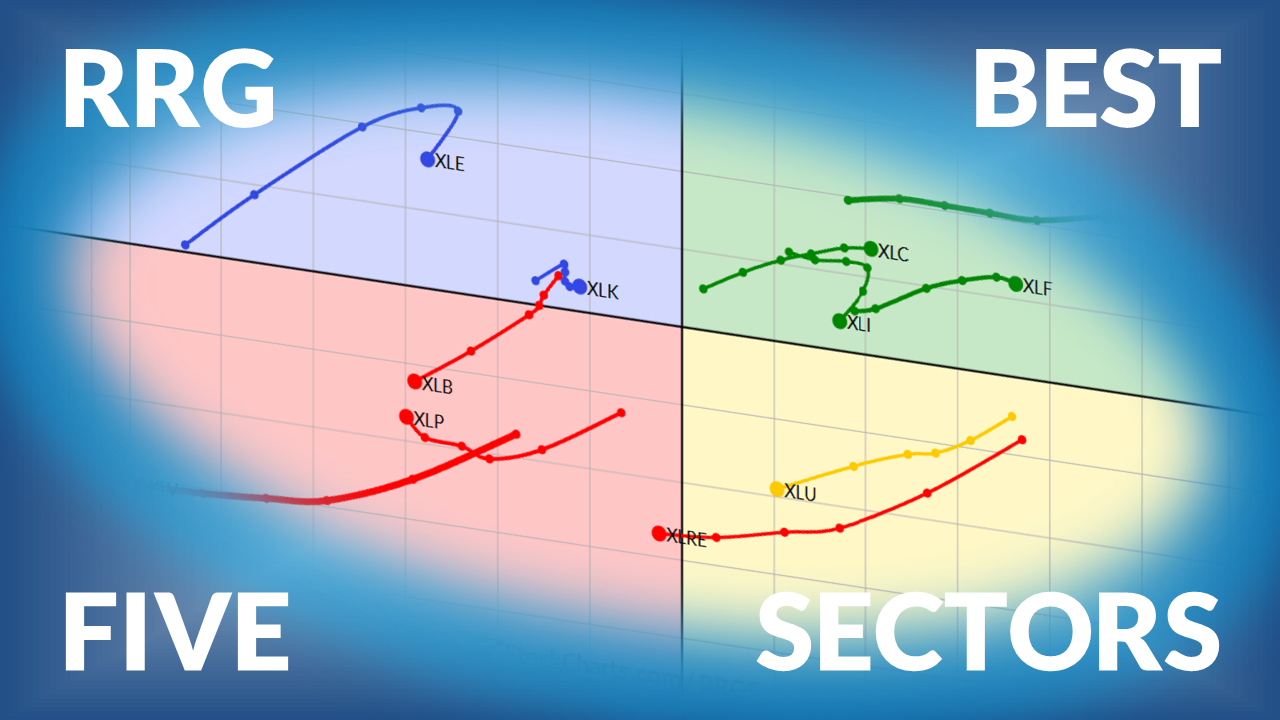
The Best Five Sectors This Week, #51

by Julius de Kempenaer,
Senior Technical Analyst, StockCharts.com
Weekly update on US sector ranking based on Relative Rotation Graphs....
READ MORE
MEMBERS ONLY

StockCharts Insider: How to Spot Style Rotation Before the Crowd

by Karl Montevirgen,
The StockCharts Insider
Before We Dive In…
The market isn’t one story. It’s a dozen stories fighting for the spotlight. And depending on the day, a different one steals the show. One of the cleanest ways to read those stories is through Market Factors—Value, Growth, Momentum, Quality, and more. Spot...
READ MORE
MEMBERS ONLY

Peace on Earth, Stability in Bonds? Watch These 3 Charts for Fixed Income in 2026
What does next year have in store for the bond market? Treasury yields, the yen, and credit spreads are expected to shape fixed-income returns in 2026. Which charts should you be watching? Find out here....
READ MORE
MEMBERS ONLY

The Best Five Sectors This Week, #50
by Julius de Kempenaer,
Senior Technical Analyst, StockCharts.com
Weekly Sector Rotation Update for US Sectors based on Relative Rotation Graphs...
READ MORE
MEMBERS ONLY

Three Investing Lessons from a Challenging 2025 Market
by David Keller,
President and Chief Strategist, Sierra Alpha Research
After a challenging and highly rotational 2025, Dave Keller, CMT, shares three key investing lessons, from focusing on process over prediction to recognizing leadership shifts beneath the surface. Learn how investors can better prepare for market opportunities in 2026....
READ MORE
MEMBERS ONLY

Is a Santa Claus Rally Starting to Take Shape?
by Mary Ellen McGonagle,
President, MEM Investment Research
Mary Ellen analyzes a notable shift in the markets, how to capitalize, and what it might mean for the fabled Santa Claus Rally....
READ MORE
MEMBERS ONLY

To Be Invested or Not to be Invested? That is the Question
by Arthur Hill,
Chief Technical Strategist, TrendInvestorPro.com
These three indicators will filter out the noise and identify whether the stock market is bullish or bearish. This, in turn, will help you determine whether you should remain invested or not. Explore these indicators and find out which key levels to watch....
READ MORE
MEMBERS ONLY

Stocks Showing Early Market Rotation Using Relative Strength
by Joe Rabil,
President, Rabil Stock Research
Joe Rabil of Rabil Stock Research looks at stocks rotating after a long bearish, discusses the prospects of a Santa Claus rally, and breaks down viewer-requested stocks....
READ MORE
MEMBERS ONLY

Calm Markets, Crude Chaos: Why Oil Is the Odd One Out This Holiday Season
While equities have remained relatively calm during this holiday season, oil prices have been under pressure. Even as energy stocks are performing better than crude, the overall trend remains bearish....
READ MORE
MEMBERS ONLY

Two Markets That Could Be Influenced by a Peace Settlement in Ukraine
by Martin Pring,
President, Pring Research
Martin Pring analyzes the two areas that could see a significant upside move if a peace settlement in the conflict in Ukraine is reached....
READ MORE
MEMBERS ONLY

The Best Five Sectors This Week, #49
by Julius de Kempenaer,
Senior Technical Analyst, StockCharts.com
Weekly update on U.S. sector rotation using Relative Rotation Graphs....
READ MORE
MEMBERS ONLY
If Value Is Really Back, These Two Stocks Will Tell Us First
Value stocks are showing signs of strength, but it will take strength from sectors such as Energy and Financials to push this asset group higher. Learn about which charts could provide clues on the value vs. growth trade. ...
READ MORE
MEMBERS ONLY
Is This Rally for Real? Here's What the Charts Are Saying
by Mary Ellen McGonagle,
President, MEM Investment Research
Mary Ellen McGonagle breaks down the current market rally and examines whether expanding participation and sector movement are confirming the move. Discover what market breadth, equal-weight indexes, and sector charts are revealing beneath the surface....
READ MORE
MEMBERS ONLY

Using Trend Signals and Oversold Conditions to Get a Jump on the Breakout
by Arthur Hill,
Chief Technical Strategist, TrendInvestorPro.com
If you're looking to get in early on a breakout, first identify the uptrend and then find oversold setups. Arthur Hill walks you through how to look for the ideal setups....
READ MORE
MEMBERS ONLY

A Stock Market Rally With a Twist: What's Strengthening and What's Cracking?
by Jayanthi Gopalakrishnan,
Director of Site Content, StockCharts.com
The Fed cut sparked new life in the stock market. See which sectors broke out, where weakness remains, and what it means for investors....
READ MORE
MEMBERS ONLY

Is It Finally Time for Small Caps to Outperform?
by Martin Pring,
President, Pring Research
Small caps have made very little upside movement since 2021, but that could be changing. Martin Pring analyzes small-cap stocks and makes his case for a potential rally in this asset group....
READ MORE
MEMBERS ONLY

The Best Five Sectors This Week, #48
by Julius de Kempenaer,
Senior Technical Analyst, StockCharts.com
Weekly update on sector rotation ranking based on Relative Rotation Graphs...
READ MORE
MEMBERS ONLY

Broad Market Rally Continues — New Strength Across Key Sectors!
by Mary Ellen McGonagle,
President, MEM Investment Research
This week, Mary Ellen breaks down the continuation of the market's rally as optimism around a potential Fed rate cut lifts sentiment. She highlights the sectors showing fresh strength, i.e., financials, semiconductors, retail, software, and biotechs, and explains how improving market breadth and strong ETF momentum are...
READ MORE
MEMBERS ONLY

Breadth Not Ideal, but Still Net Bullish; Homebuilders Breakout Could Bode Well for 2026
by Arthur Hill,
Chief Technical Strategist, TrendInvestorPro.com
Learn how to quantify signals using new highs, new lows, and the percentage of stocks with golden crosses. Another area that could hold the key to broadening leadership in 2026 is homebuilder stocks. ...
READ MORE
MEMBERS ONLY

Market Strength Broadens — What’s Powering This Rally?
by Mary Ellen McGonagle,
President, MEM Investment Research
Mary Ellen McGonagle breaks down this week’s market pullback and the key chart signals emerging after the break below support. She highlights the areas still showing strength and where potential opportunities may be forming beneath the surface....
READ MORE
MEMBERS ONLY

The Best Five Sectors This Week, #46
by Julius de Kempenaer,
Senior Technical Analyst, StockCharts.com
Weekly Update on Sector Ranking for US stocks based on Relative Rotation Graphs...
READ MORE
MEMBERS ONLY

Will the Dow Transports Give Traders Something to Be Thankful For?
The Dow Transports has been a laggard, moving sideways since May 2021. However, lately, there have been some signs that this industry group may be perking up. Watch these technical setups as we head into 2026....
READ MORE
MEMBERS ONLY

Breakdown or Opportunity? What the Charts Reveal Now
by Mary Ellen McGonagle,
President, MEM Investment Research
Mary Ellen McGonagle breaks down this week’s market pullback and the key chart signals emerging after the break below support. She highlights the areas still showing strength and where potential opportunities may be forming beneath the surface....
READ MORE
