MEMBERS ONLY
NVDA Earnings Miss, Yet Dow Powers Higher

by David Keller,
President and Chief Strategist, Sierra Alpha Research
In this edition of StockCharts TV'sThe Final Bar, Dave breaks down key sector leadership themes and why growth stocks like Nvidia continue to take a back seat to value-oriented sectors. He speaks to the inverted yield curve, performance of the equal-weighted S&P 500 vs....
READ MORE
MEMBERS ONLY
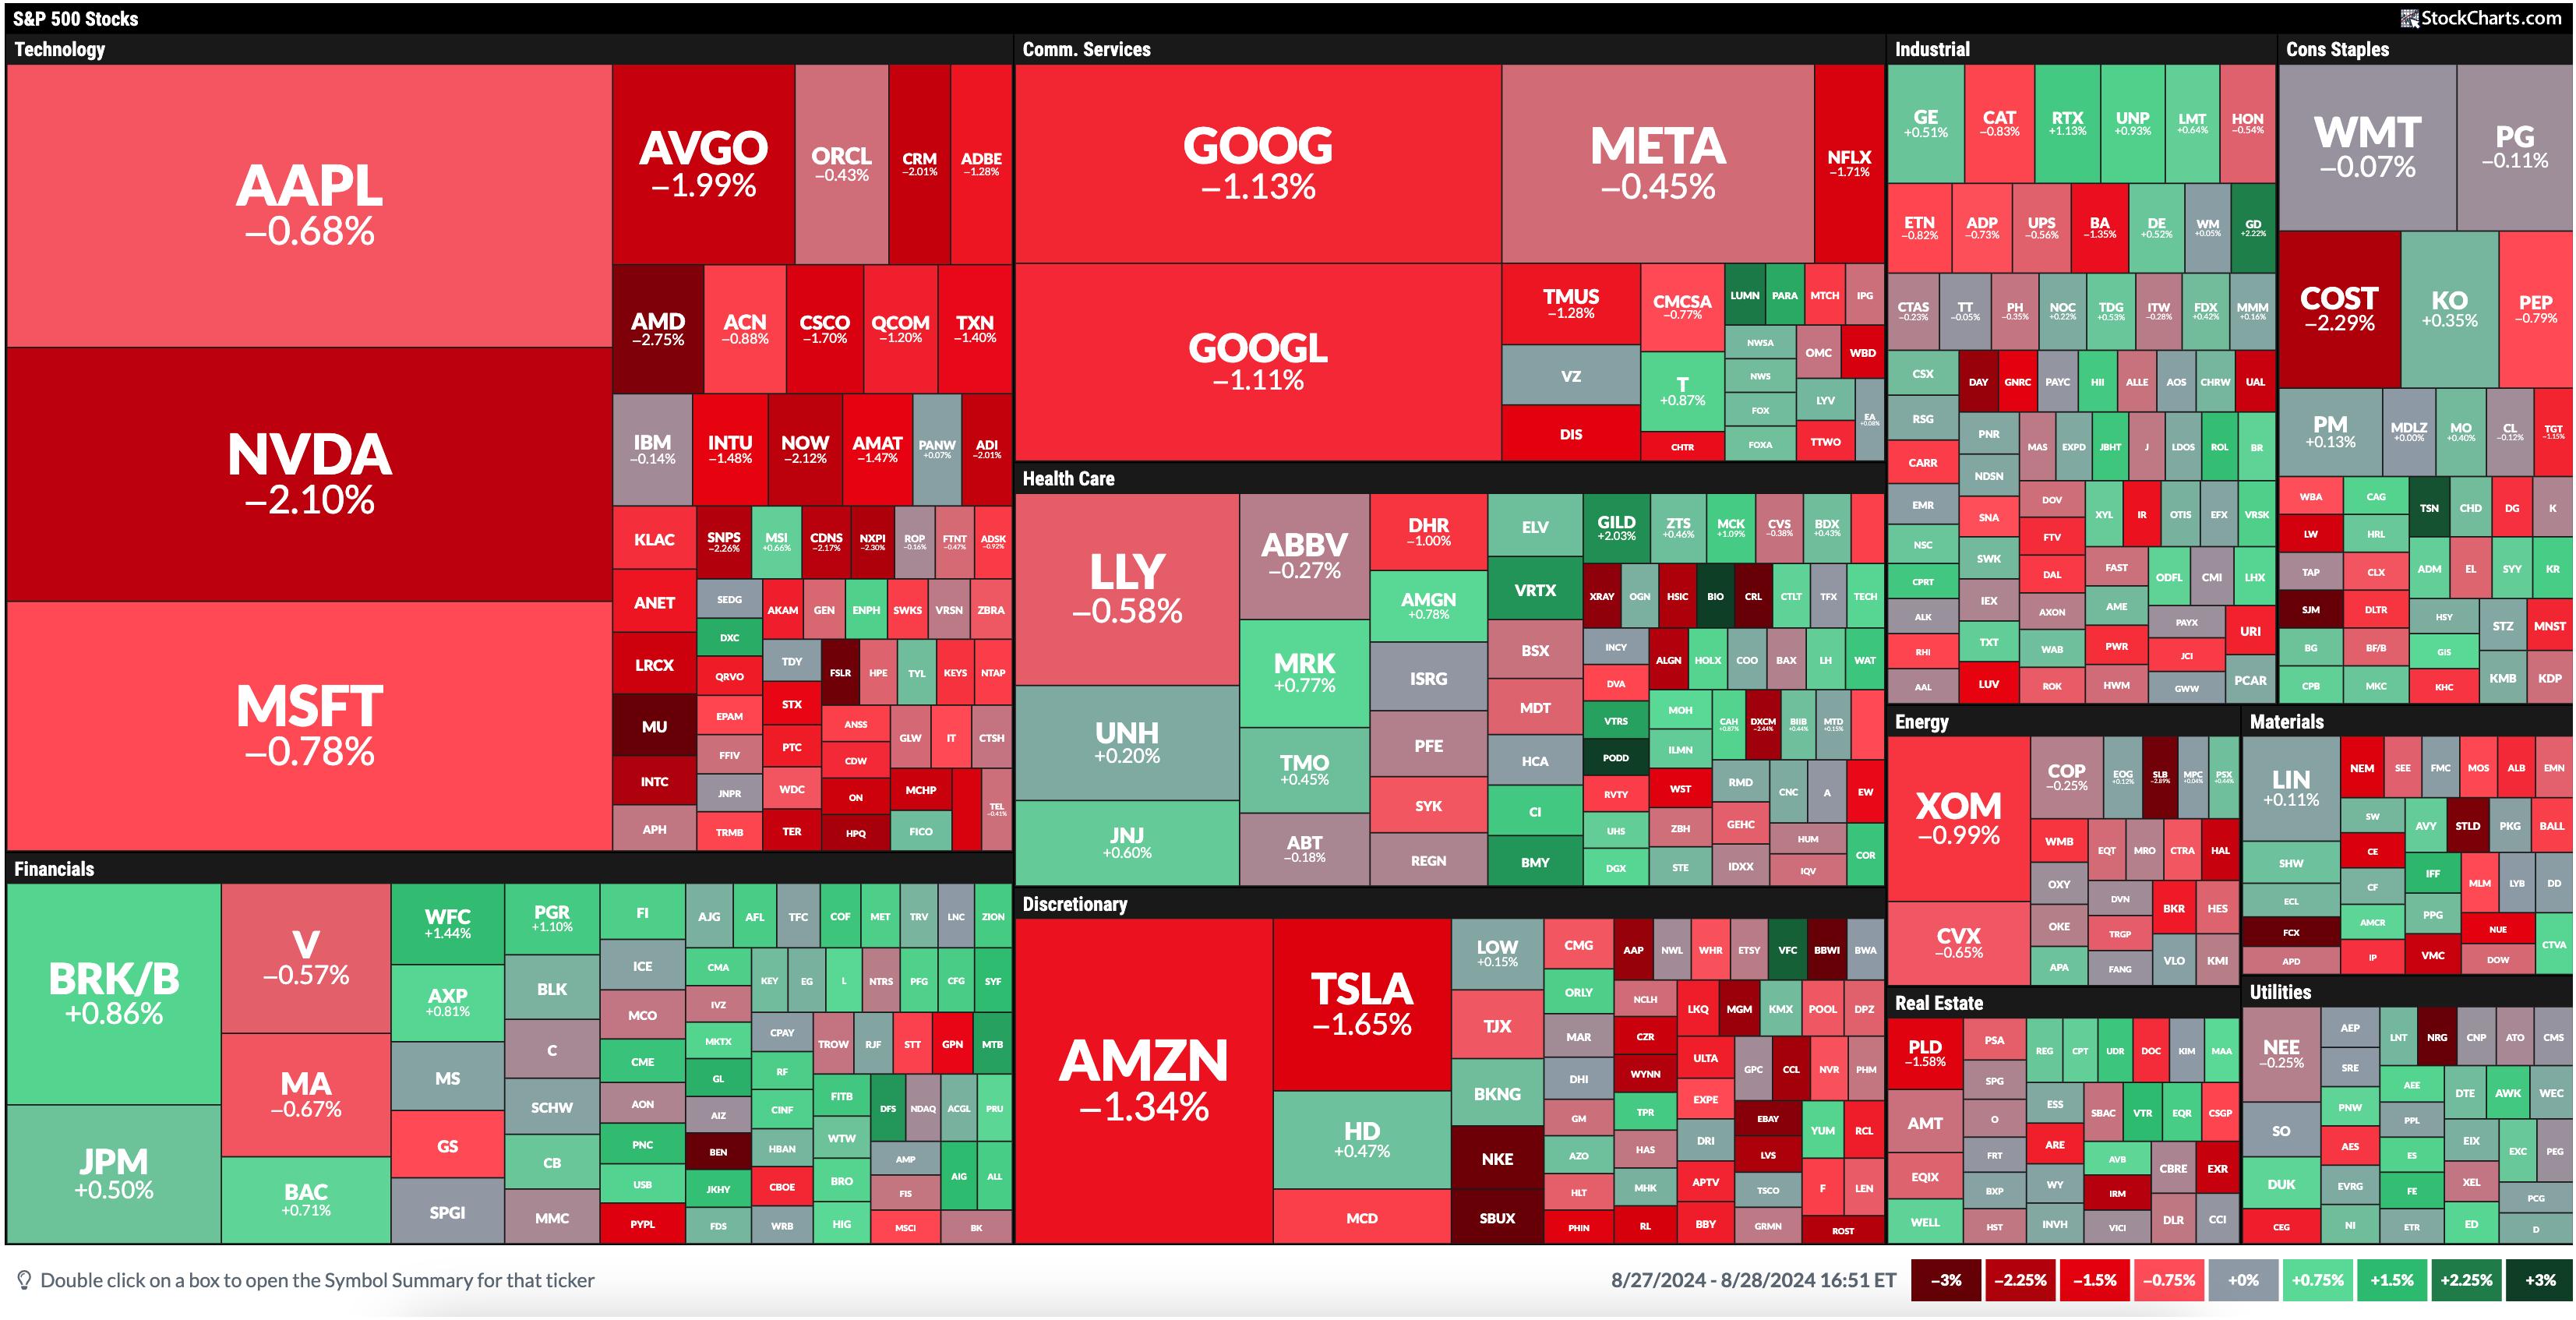
Stock Market Today: NVDA Reports, Tech Lags, Financials Take the Lead

by Jayanthi Gopalakrishnan,
Director of Site Content, StockCharts.com
KEY TAKEAWAYS
* The leading sector today was the Financials, followed by Health Care and Utilities.
* Technology stocks sold off significantly and was the worst sector performer.
* With interest rate cuts expected in the next FOMC meeting, financial stocks have the potential to rise further.
Today's MarketCarpet was a...
READ MORE
MEMBERS ONLY

Earnings Provide Another Nail in the Retail Coffin
by David Keller,
President and Chief Strategist, Sierra Alpha Research
In this edition of StockCharts TV'sThe Final Bar, Dave recaps a brutal day for retailers as ANF, FL, and BBWI drop on earnings misses. He also highlights the bullish primary trend for hold, shares two breakout names in the consumer staples sector, and breaks down key names in...
READ MORE
MEMBERS ONLY

Three Technology Stocks in Make or Break Scenarios
by David Keller,
President and Chief Strategist, Sierra Alpha Research
In this edition of StockCharts TV'sThe Final Bar, Dave focuses in on three key charts to watch in the technology sector as investors anxiously await NVDA earnings and Friday's inflation data. He also shares two important charts for tracking improving market breadth conditions and highlights the...
READ MORE
MEMBERS ONLY
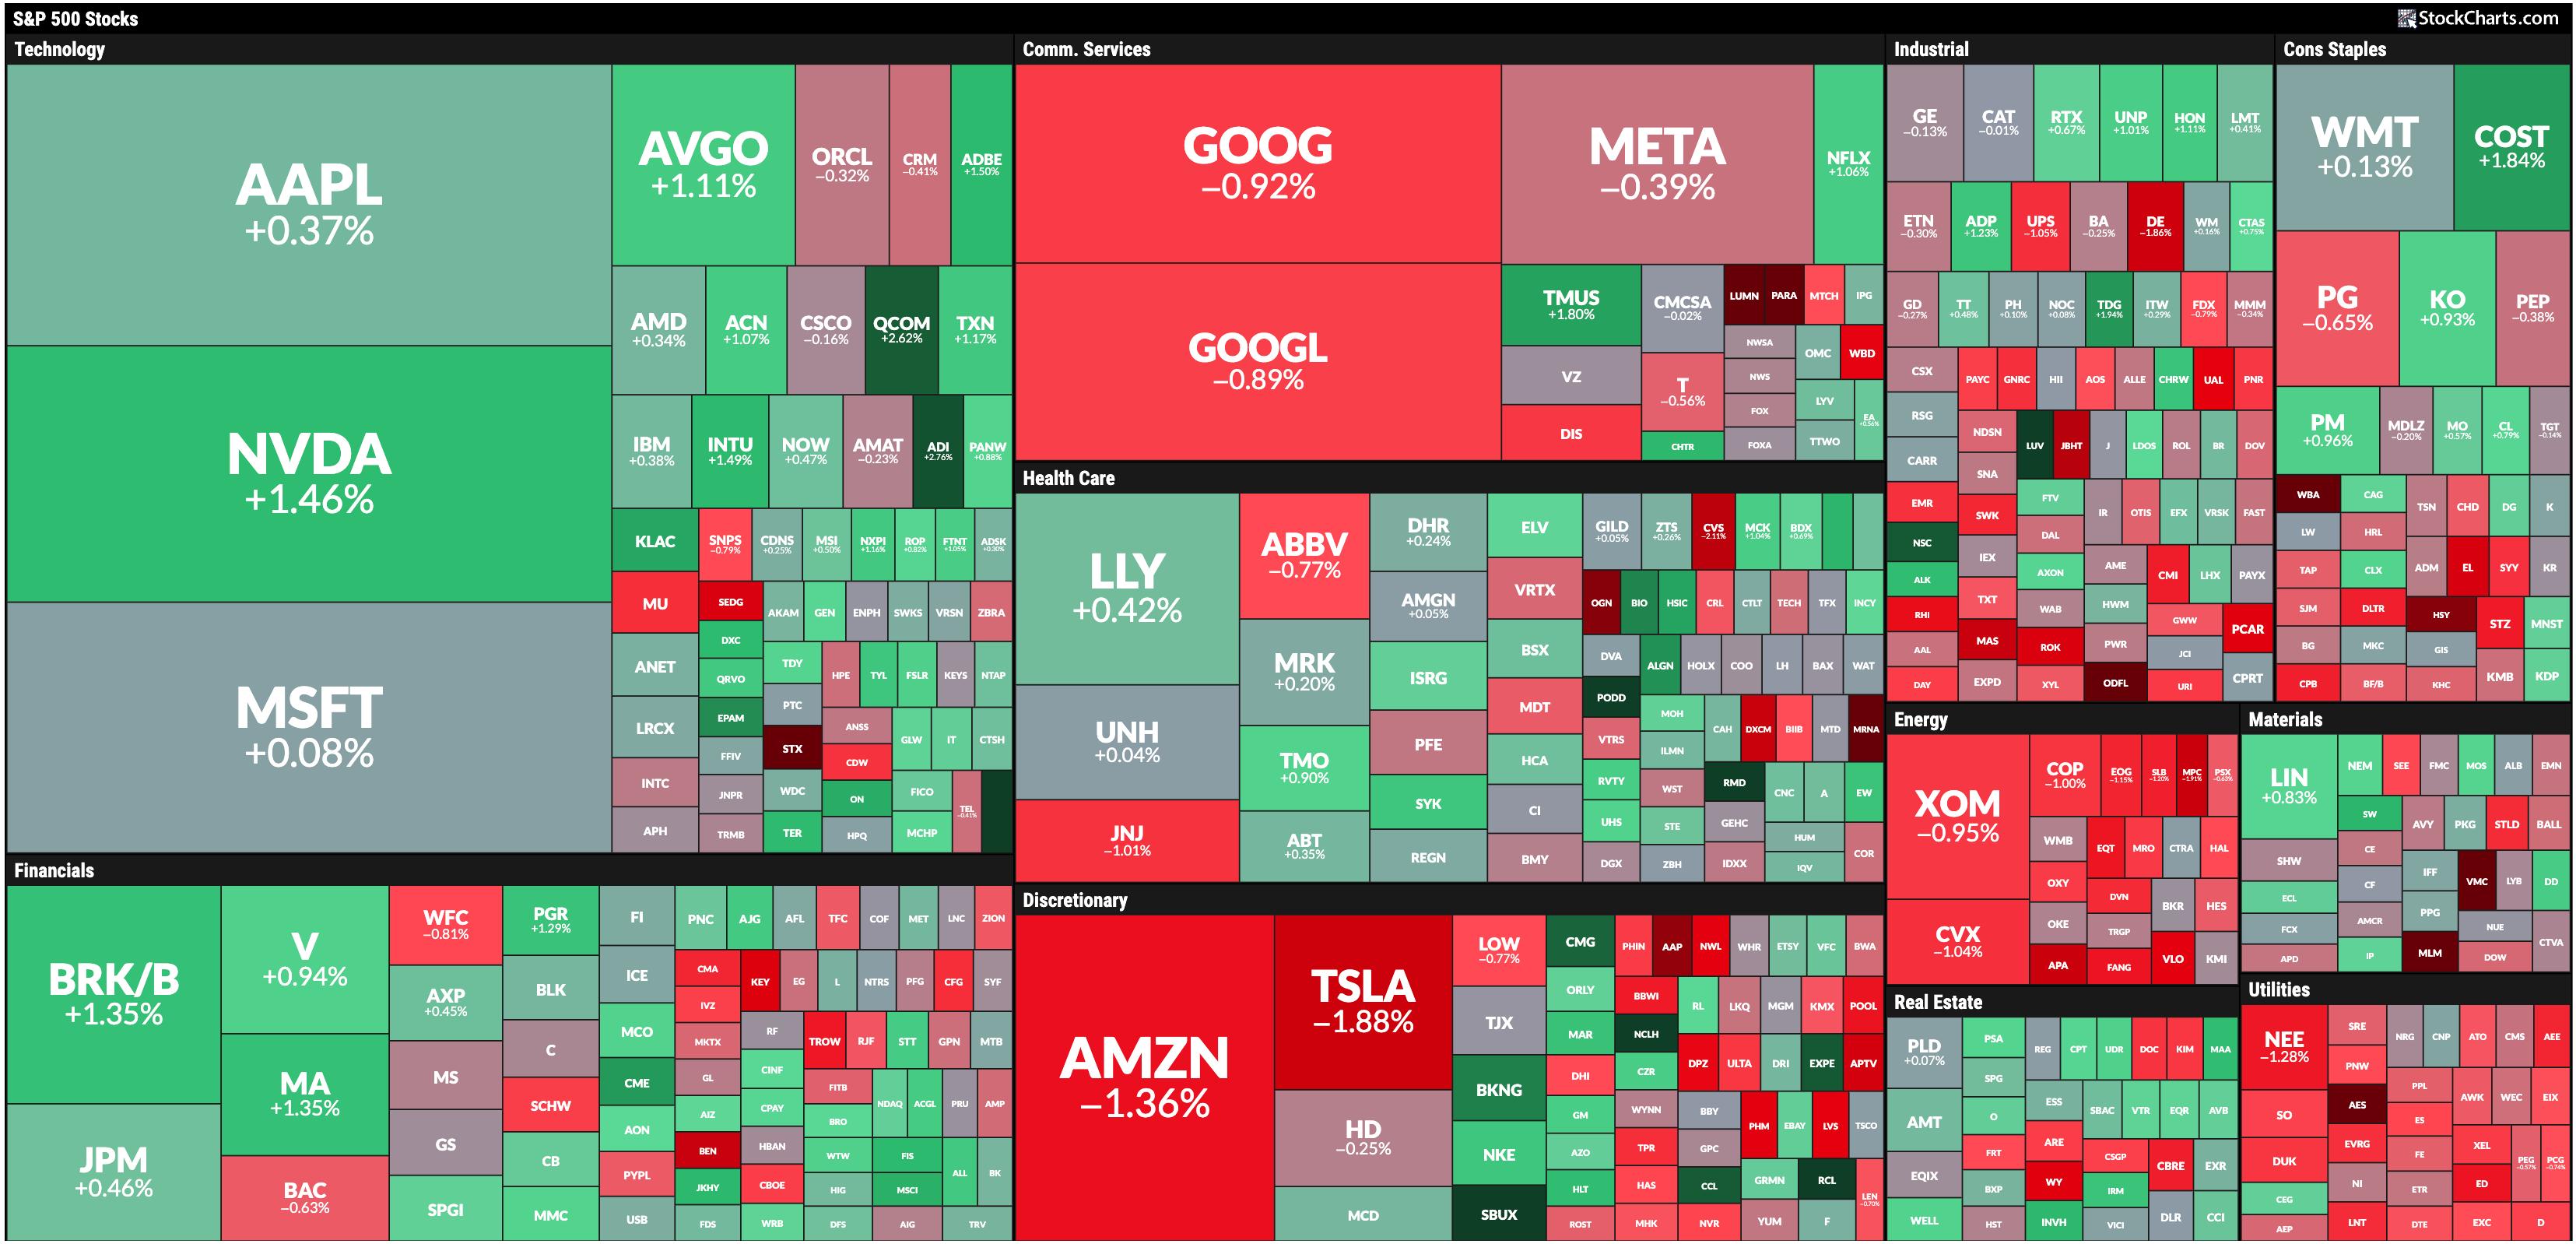
Stock Market Today: Two Sectors That Can Make Sizable Moves
by Jayanthi Gopalakrishnan,
Director of Site Content, StockCharts.com
KEY TAKEAWAYS
* Financial and Technology sectors were the leaders.
* With NVDA reporting earnings, tech stocks, especially semiconductors, could steal the spotlight again.
* With interest rate cuts on the horizon, financial stocks could see increased momentum.
Have you ever been in a plane that keeps circling around, waiting to land? That&...
READ MORE
MEMBERS ONLY

Major Market Shift As Week Ends Strong!

by Mary Ellen McGonagle,
President, MEM Investment Research
In this StockCharts TV video, Mary Ellen reviews the broader market's health while highlighting big shifts into newer areas, including banks, retail, and autos. Sharing one of the reasons Tech stocks were weak, she highlights which areas as seeing renewed strength. She also looked at individual stocks that...
READ MORE
MEMBERS ONLY
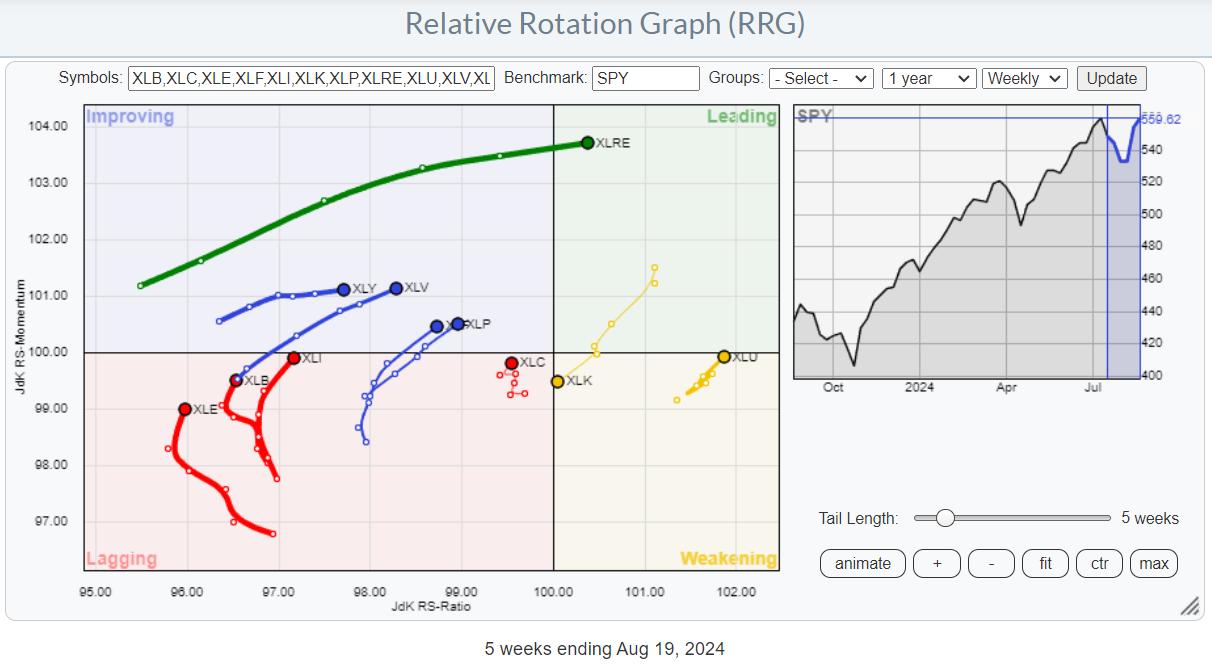
RRG-Velocity Jumping on XLF Tail

by Julius de Kempenaer,
Senior Technical Analyst, StockCharts.com
KEY TAKEAWAYS
* Sector rotation out of technology
* All other sectors are picking up relative strength
* Real-Estate, Utilities, and Financials showing strong rotations
On the weekly Relative Rotation Graph, the rotation still favors almost every sector over Technology. I discussed the opposite rotations between weekly and daily RRGs in last...
READ MORE
MEMBERS ONLY
Gold Miners' Performance vs. Gold -- Does It Say Sell Gold?

by Carl Swenlin,
President and Founder, DecisionPoint.com
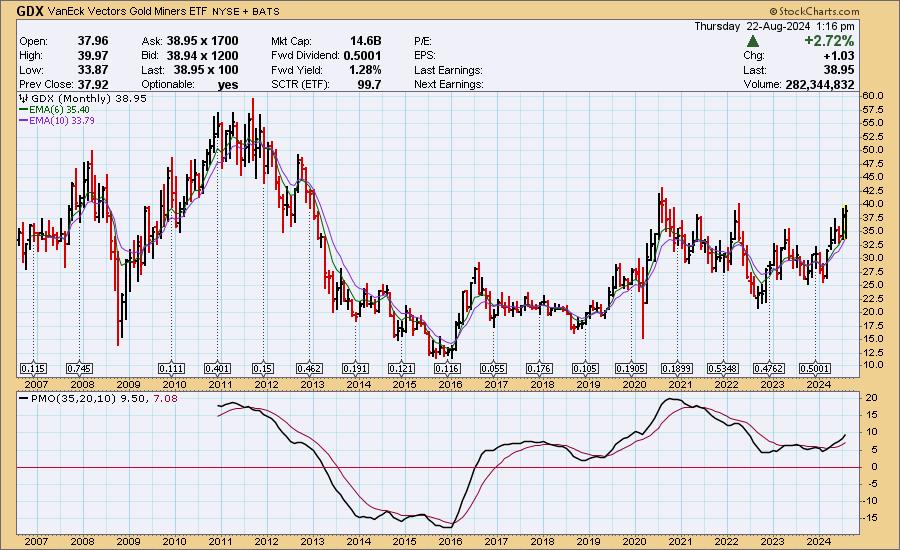
In Monday's DecisionPoint Trading Room video, we were asked why we cover Gold Miners (GDX) as well as Gold (GLD). There are two reasons:
1. Some people prefer to own the commodity, Gold, and others prefer to own an operating company that benefits from the price of Gold,...
READ MORE
MEMBERS ONLY
Looking for the Next Entry Point in SPY? USE RSI!

by Joe Rabil,
President, Rabil Stock Research
In this exclusive StockCharts TV video, Joe shows how to use RSI in multiple timeframes to identify the next buying opportunity in the SPY. He explains why he thinks this rally is important and uses the ADX on the daily to distinguish between the strength in different indices. Joe also...
READ MORE
MEMBERS ONLY
What Does This Mean for the S&P 500 Rally?
by Julius de Kempenaer,
Senior Technical Analyst, StockCharts.com
In this video from StockCharts TV,Julius looks at the conflicting rotations in both asset classes and equity sectors. The weekly rotations differ significantly from their daily counterparts. What does it mean for the current rally in the S&P 500, and what does it mean for the relationship...
READ MORE
MEMBERS ONLY

This Market is On Track for a 45-Year Breakout

by Martin Pring,
President, Pring Research
It's not very often that any market experiences a 10-year breakout, let alone a 45-year one. That, however, is what Chart 1 says is about to materialize for the inflation-adjusted gold price.
Since the chart is based on monthly data, we will not know for...
READ MORE
MEMBERS ONLY
These Groups Just Turned BULLISH!
by Mary Ellen McGonagle,
President, MEM Investment Research
In this StockCharts TV video, Mary Ellen highlights what drove last week's sharp rally in the markets - posting their largest weekly gains for the year! She takes a close look at retail and cybersecurity stocks setting up for gains, and shares some of the best ways to participate....
READ MORE
MEMBERS ONLY

Will XRT (Retail) Sink or Soar? Here's What the Charts Say

by Karl Montevirgen,
The StockCharts Insider
KEY TAKEAWAYS
* Retail stocks jumped on Thursday as the retail sales report came out higher than expected
* The SPDR S&P Retail ETF, XRT, gapped higher, but it's stuck in the middle of a wide rectangle formation
* Whether XRT breaks out or breaks down, there are key...
READ MORE
MEMBERS ONLY
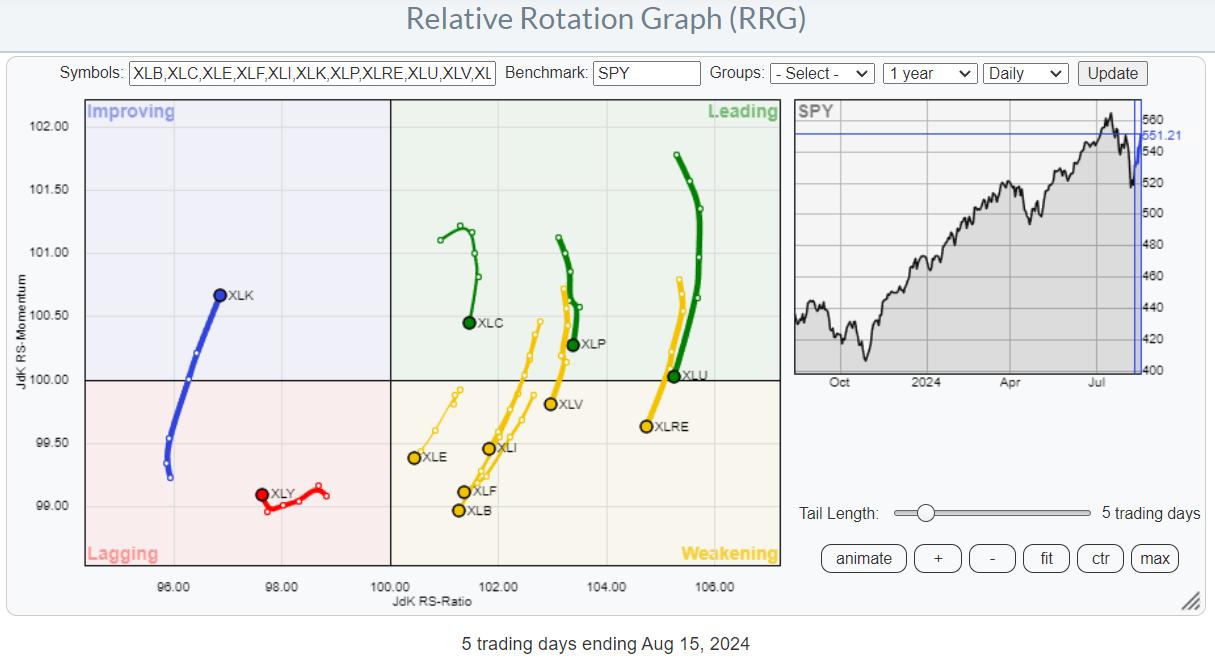
Strength Off the Lows, But Concerns Remain
by Julius de Kempenaer,
Senior Technical Analyst, StockCharts.com
KEY TAKEAWAYS
* Rotation to large-cap growth is back
* And so is the narrow foundation/breadth supporting this rally
* Weekly and daily $SPX charts need to get in line
Stronger than Expected
The recent rally out of the August 5th low is definitely stronger than I had anticipated. I was...
READ MORE
MEMBERS ONLY
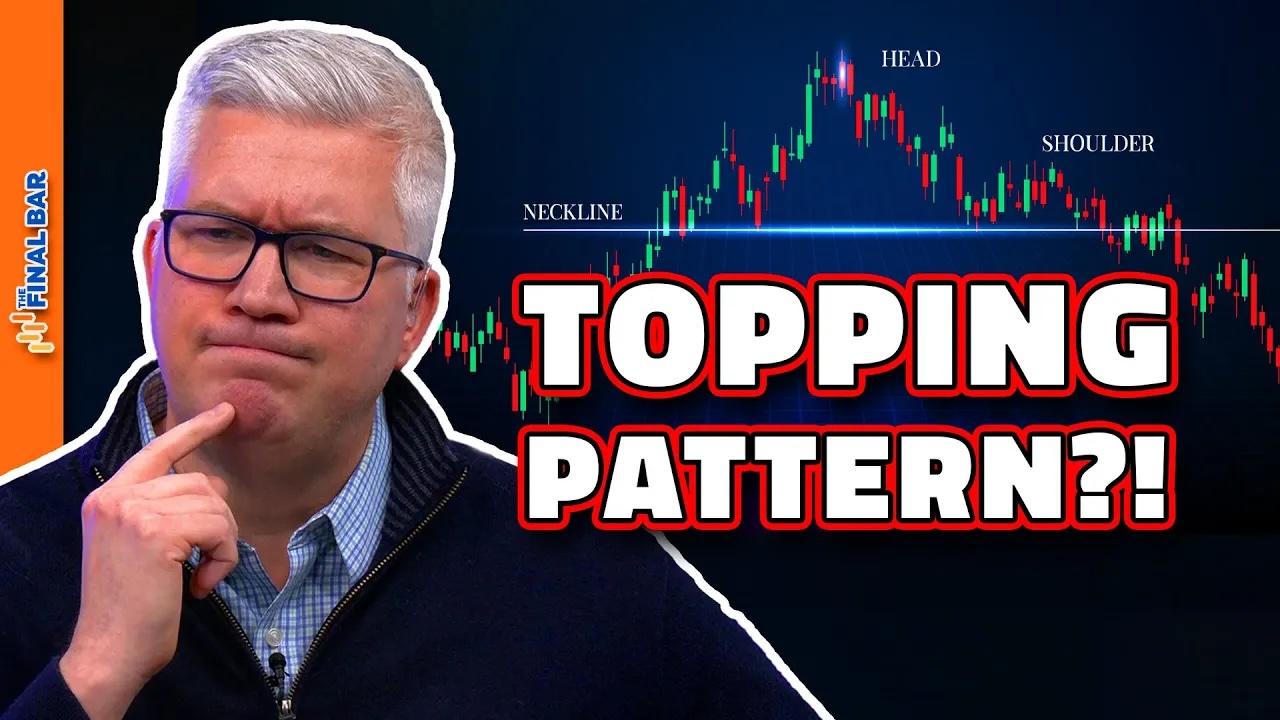
Head and Shoulders Top for Semiconductors?
by David Keller,
President and Chief Strategist, Sierra Alpha Research
In this edition of StockCharts TV'sThe Final Bar, Dave shows how breadth conditions have evolved so far in August, highlights the renewed strength in the financial sector with a focus on insurance stocks, and describes how the action so far in Q3 could be forming a potential head-...
READ MORE
MEMBERS ONLY

How ADX Stage Analysis Can Make You a BETTER Trader!
by Joe Rabil,
President, Rabil Stock Research
In this exclusive StockCharts TV video, Joe shows the four stages a stock or market can be in at any time. He explains each stage and how ADX & Volatility can help define each stage. He then shows what stage the SPY is right and why the bias is still...
READ MORE
MEMBERS ONLY

S&P 500 Teetering On 100-Day Moving Average Support
by Jayanthi Gopalakrishnan,
Director of Site Content, StockCharts.com
KEY TAKEAWAYS
* The stock market indexes end the week on a positive note after a scary Monday
* Volatility steps back slightly after a brief spike over 65
* Next week's consumer and producer inflation data could help set direction
A sigh of relief? The US stock market started the...
READ MORE
MEMBERS ONLY

Will USO Soar to $83? Here Are the Key Levels to Watch!
by Karl Montevirgen,
The StockCharts Insider
KEY TAKEAWAYS
* Fundamental, technical, and seasonality factors suggest an upside move in WTI crude oil.
* Seasonality and other indicators suggest a swing trading opportunity in the United States Oil Fund (USO).
* Supply and geopolitical factors can quickly change the conditions of the market and the trade.
Oil prices are climbing...
READ MORE
MEMBERS ONLY

The Great Rotation: Not What You Think
by Martin Pring,
President, Pring Research
KEY TAKEAWAYS
* Small-cap stocks look like they have lost momentum.
* Market breadth in small-cap stocks appears to be weakening.
* The Utilities sector seems to be gaining momentum.
Just so we are on the same page, I looked up "Great Rotation" on Microsoft's Copilot and...
READ MORE
MEMBERS ONLY

QQQ: Critical Levels to Watch as Nasdaq Teeters on the Edge
by Karl Montevirgen,
The StockCharts Insider
KEY TAKEAWAYS
* QQQ has bounced off its 200-day moving average.
* An optimal entry point for QQQ would be the 50% to 61.8% Fibonacci retracement range.
* If QQQ drops below $350, it can mean further downside.
Just Another Manic Monday? On Monday, the Nasdaq plunged over 3%. With the...
READ MORE
MEMBERS ONLY

It's Been a Long Time Mr Bear, Where Have You Been?
by Julius de Kempenaer,
Senior Technical Analyst, StockCharts.com
KEY TAKEAWAYS
* Some real damage for the markets
* Equal weight sector rotation paints a more realistic picture
* The BIG ROTATION into small caps has come to a halt
And then ..... all of a sudden..... things are heating up. Lots of (downside) market action in the past week.
Let's...
READ MORE
MEMBERS ONLY

Small Caps Poised to Soar: Is Now the Time To Buy IWM?
by Karl Montevirgen,
The StockCharts Insider
KEY TAKEAWAYS
* Small caps saw an impressive surge in July, outpacing the S&P 500 in that month alone.
* IWM, a Russelll 2000 proxy, is only 8% away from its all-time highs, potentially signaling the start of a new bull market.
* As IWM pulls back (along with the...
READ MORE
MEMBERS ONLY

Semiconductors Are Down: Is Now the Time to Buy SMH?
by Karl Montevirgen,
The StockCharts Insider
KEY TAKEAWAYS
* SMH has completed 100% of a measured move from the bottom of a double-top reversal.
* SMH has broken below several key levels based on various indicators.
* There are actionable levels in the SMH chart that traders can take advantage of if they materialize.
Nvidia (NVDA) was perhaps...
READ MORE
MEMBERS ONLY

S&P 500 Equal Weight ETF Gains Strength

by Bruce Fraser,
Industry-leading "Wyckoffian"
The S&P 500 index ($SPX) is a capitalization-weighted stock index. Many lesser capitalization blue-chip stocks that compose these 500 companies have been performance laggards. Though smaller companies in the index, these corporations are among the bluest of the blue-chip stocks. These prestigious corporations have been...
READ MORE
MEMBERS ONLY
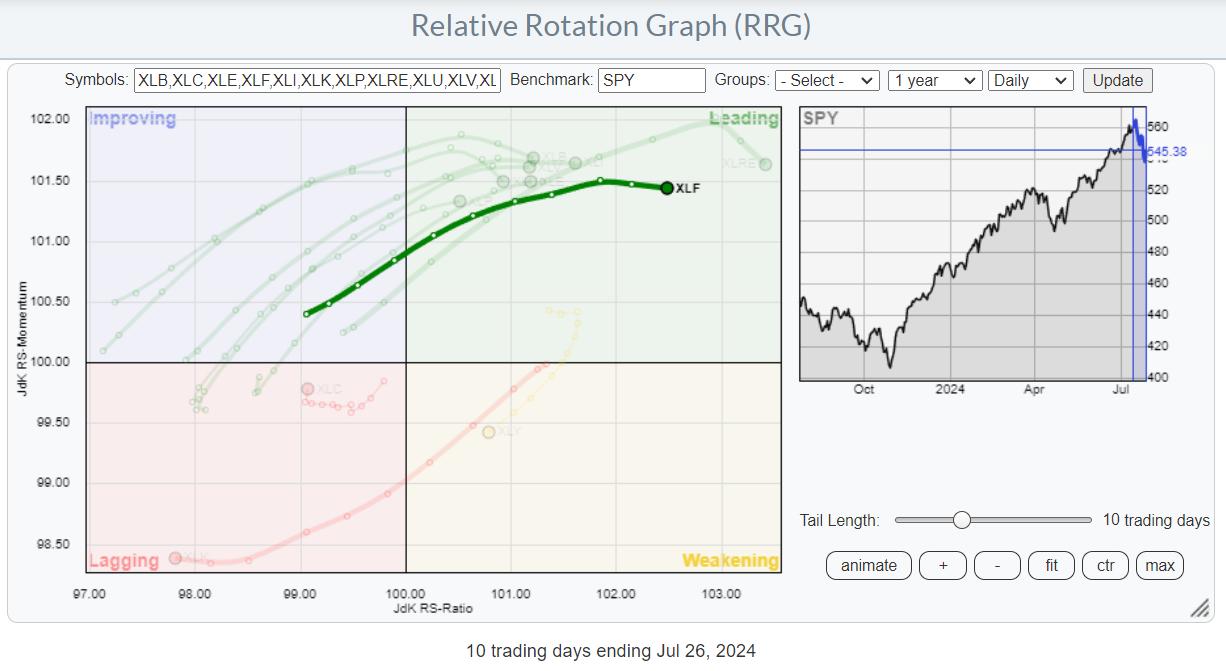
Flying Financials. Will It Be Enough?
by Julius de Kempenaer,
Senior Technical Analyst, StockCharts.com
KEY TAKEAWAYS
* Strong Sector Rotation Out Of Technology
* Financials and Real Estate Lead
* Stock/Bond Ratio Triggers Sell Signal
Flying Financials
In the recent sector rotation, basically OUT of technology and INTO anything else, Financials and Real-Estate led the relative move.
On the RRG above, I have highlighted the...
READ MORE
MEMBERS ONLY

After the Tech Bloodbath: Ways to Strategize Your Portfolio
by Jayanthi Gopalakrishnan,
Director of Site Content, StockCharts.com
KEY TAKEAWAYS
* Tech stocks took a dive on Wednesday but look like they are making up some of those losses prior to hitting the next support level.
* Expect volatility in the stock market in the coming weeks since it's earnings season and there's a Fed meeting...
READ MORE
MEMBERS ONLY

1-2-3 Reversal Pattern: What It Is and How to Use It
by Joe Rabil,
President, Rabil Stock Research
In this exclusive StockCharts TV video, Joe explains the 1-2-3 reversal pattern, its criteria, and what it will take for QQQ to complete the pattern. He also discusses how the pattern is not always as clean as we would like. Joe then shares a few Crypto markets which...
READ MORE
MEMBERS ONLY

Can Small and Mid-Caps Save the Market?
by Julius de Kempenaer,
Senior Technical Analyst, StockCharts.com
In this video from StockCharts TV,Julius takes a look at the markets through the lens of the "market factors" panel you can find on your StockCharts dashboard. Starting from the RRG, he then moves to the individual charts for these factors and notes a low correlation for...
READ MORE
MEMBERS ONLY
Is It Game Over for Growth Stocks?
by Mary Ellen McGonagle,
President, MEM Investment Research
In this StockCharts TV video, Mary Ellen examines which areas of the market have moved into favor amid the S&P 500 pullback. She compares value vs. growth stocks and the merits of both, and highlights the move away from technology stocks. Which areas are poised for more downside?...
READ MORE
MEMBERS ONLY

Hindenburg Omen: The Truth, Effects, and Duration
by David Keller,
President and Chief Strategist, Sierra Alpha Research
In this edition of StockCharts TV'sThe Final Bar, Dave answers viewer questions on the best time frames for viewing charts, insights on using Vanguard ETFs for sector rotation, the duration and effect of the Hindenburg Omen indicator, how stocks are indexed in Dow Jones Groups on StockCharts, and...
READ MORE
MEMBERS ONLY

VIX SPIKES! Is a Market Correction Coming?
by David Keller,
President and Chief Strategist, Sierra Alpha Research
In this edition of StockCharts TV'sThe Final Bar, Dave shares a market update including key levels to watch for the S&P 500 index, what a VIX above 15 means for a possible market correction, the improvement in value-oriented sectors, and why DPZ may be the...
READ MORE
MEMBERS ONLY
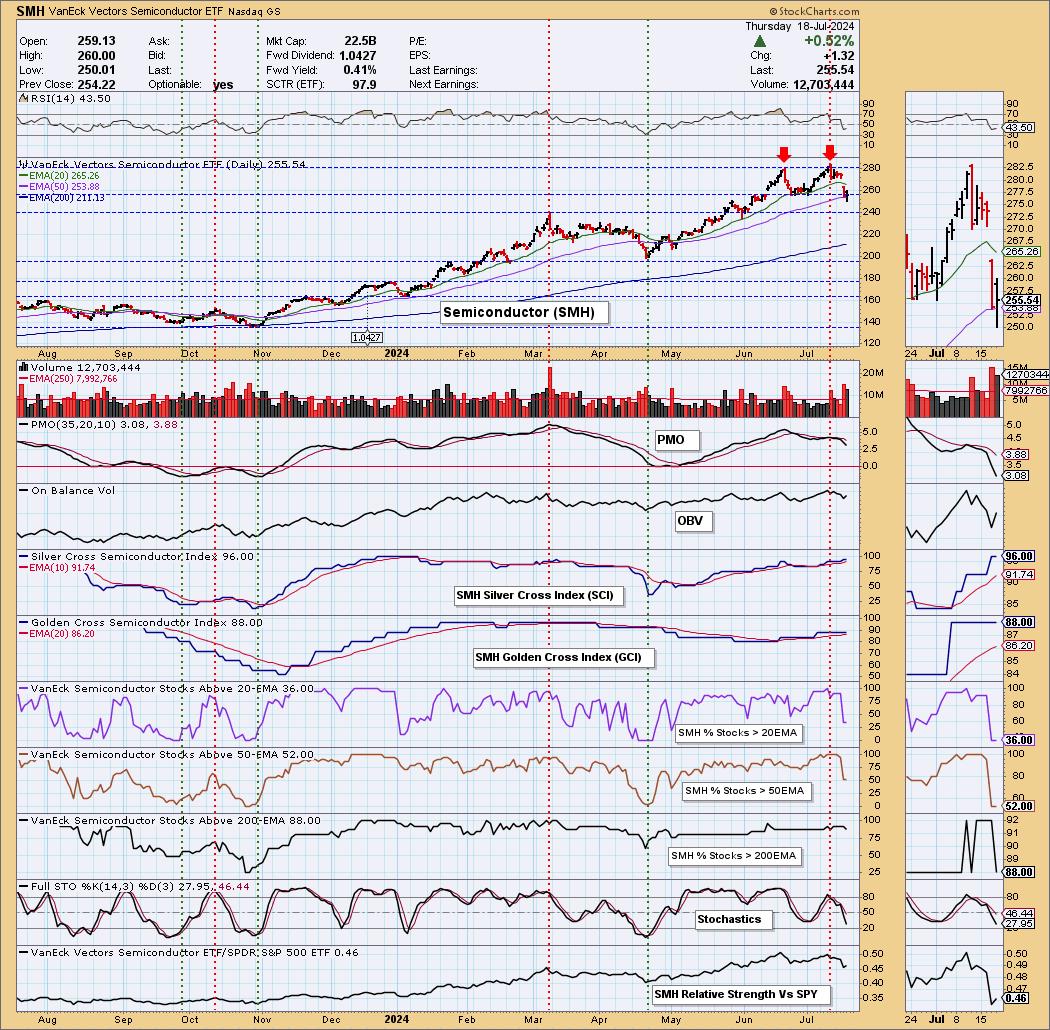
Double Top on Semiconductors (SMH)

by Erin Swenlin,
Vice President, DecisionPoint.com
(This is an excerpt from the subscriber-only DecisionPoint Alert)
We noticed a double top on the Semiconductor industry group (SMH) that looks very much like the NVIDIA (NVDA) chart. NVDA is clearly the bellwether for the group, and it appears all of the Semiconductors are feeling the pain. The...
READ MORE
MEMBERS ONLY

Will This Sector Rotation Be the Start of Something Bigger?
by Julius de Kempenaer,
Senior Technical Analyst, StockCharts.com
KEY TAKEAWAYS
* Technology is rotating out of favor
* Market Capitalization is a two-edged sword
* Negative divergences on Technology and S&P 500 charts are executing
Strong Rotations on Daily RRG
This daily RRG shows the sector rotation over the last five days. With only one more trading day...
READ MORE
MEMBERS ONLY

Why Homebuilder Stocks are on Fire Right Now!
by Karl Montevirgen,
The StockCharts Insider
KEY TAKEAWAYS
* Homebuilder stocks are rallying on hopes of at least one (if not three) interest rate cuts in 2024
* The SPDR S&P Homebuilders ETF broke out above a short-term downward trend
* Though much depends on the interest rate environment, the charts of individual homebuilder stocks show...
READ MORE
MEMBERS ONLY

Find Trades Using These POWERFUL MACD Combinations
by Joe Rabil,
President, Rabil Stock Research
In this exclusive StockCharts TV video, Joe shows how to use 2-3 specific MACD patterns on the monthly and weekly charts to set the stage for potential trading ideas. Joe then goes through the shifts in the Sector action and shows where the money is flowing. He covers the...
READ MORE
MEMBERS ONLY

Seasonal Sector Investing in the Fall: Top Sectors to Watch Now!
by Karl Montevirgen,
The StockCharts Insider
KEY TAKEAWAYS
* One sector ETF is slightly outperforming the S&P 500 while the rest are underperforming the index.
* The performances of the four outperforming sector ETFs from September to December vary.
* Check the price action and fundamentals to see if both might agree with each sector's...
READ MORE
MEMBERS ONLY

Small Caps & Value Sectors are Booming (For Now)
by David Keller,
President and Chief Strategist, Sierra Alpha Research
In this edition of StockCharts TV'sThe Final Bar, Dave recaps a strong Monday for value stocks, with the Financial and Energy sectors leading the S&P 500 and Nasdaq to new highs. He shares an update on the Hindenburg Omen, how Bitcoin has regained its 200-day...
READ MORE
MEMBERS ONLY

Is It Time To SELL Your Magnificent 7 Stocks?
by Mary Ellen McGonagle,
President, MEM Investment Research
In this StockCharts TV video, Mary Ellen reviews the sharp rotation that took place in the markets after inflation data came in below estimates. She also highlights new areas of possible leadership as interest rates decline. Most importantly, she shares the best way to uncover leadership names that are in...
READ MORE
MEMBERS ONLY

Citi Predicts $3,000 Gold by 2025 — What You Need to Know
by Karl Montevirgen,
The StockCharts Insider
KEY TAKEAWAYS
* What the Fed does in the coming months could dramatically affect the direction of gold prices
* While seasonality suggests a shift from slump to strong performance for gold, it will likely coincide with the Fed's rate decisions in the coming months
* Goldman Sachs projects gold to...
READ MORE
MEMBERS ONLY

Simple RSI Trend Strategy: Entry BEFORE a Breakout!
by Joe Rabil,
President, Rabil Stock Research
In this exclusive StockCharts TV video, Joe shows an RSI strategy that offered a few opportunities to get into AAPL before the big breakout. He then highlights what to watch for in TSLA, which may provide the same type of RSI setup sometime over the next week or so; this...
READ MORE