MEMBERS ONLY
The Best Five Sectors, #2

by Julius de Kempenaer,
Senior Technical Analyst, StockCharts.com
KEY TAKEAWAYS
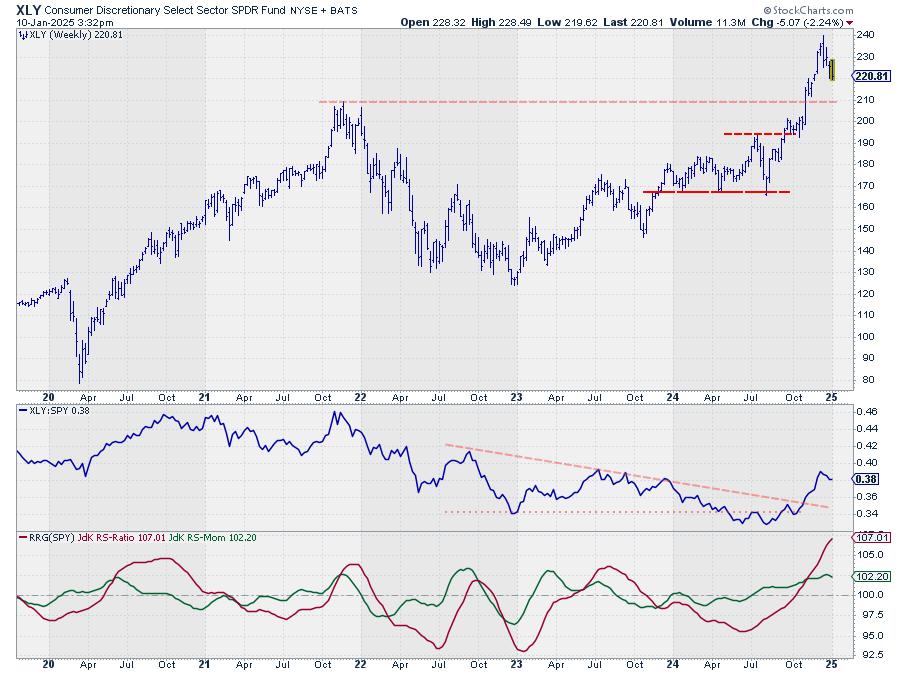
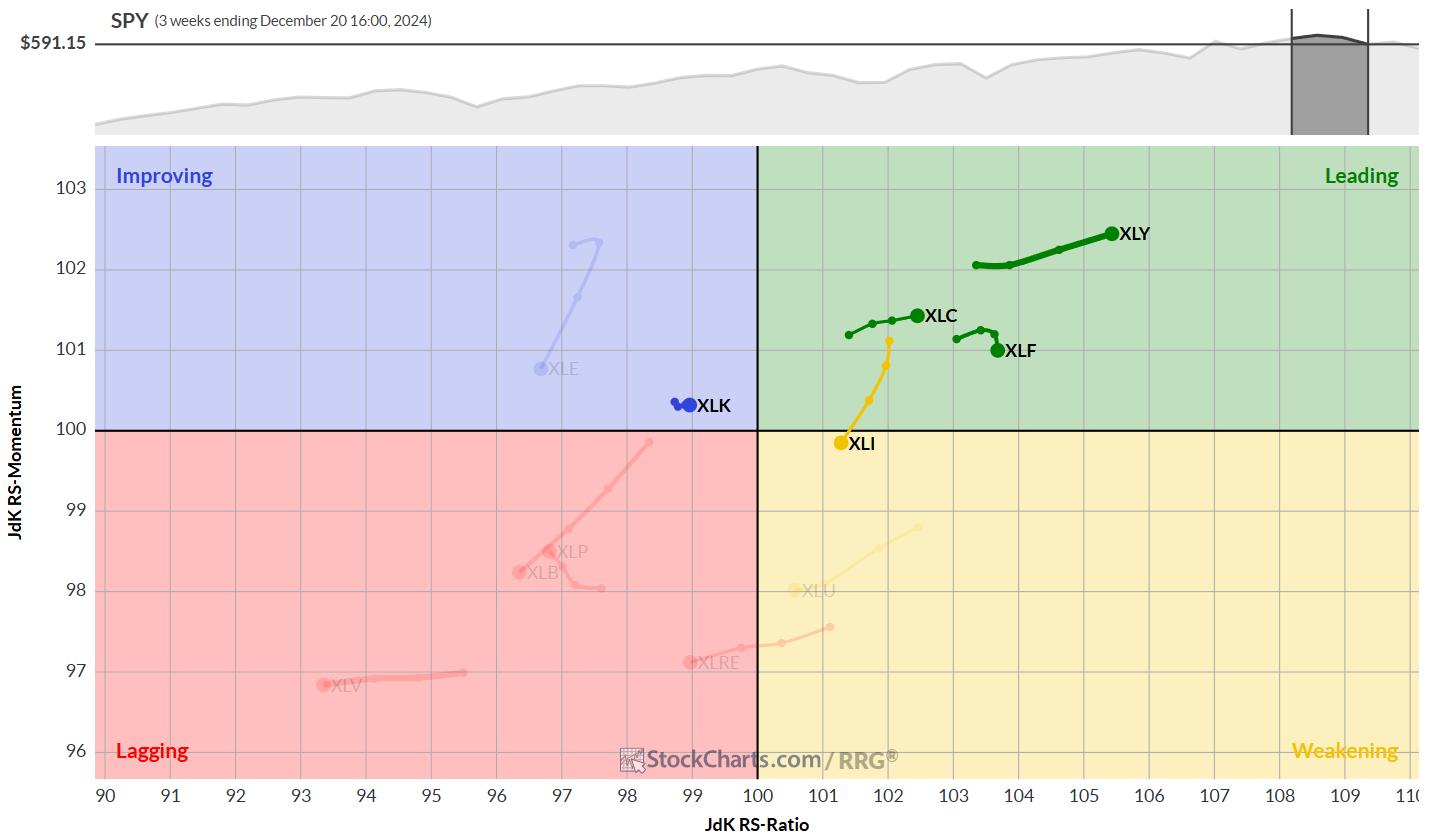
* The best five sectors remain unchanged.
* XLC and XLF are both starting to show weakness.
* XLI is holding above support, while XLK remains within rising channel.
The composition of the top five sectors remains unchanged this week, despite an interrupted trading week. This stability comes against a backdrop...
READ MORE
MEMBERS ONLY

These Riskier Areas Start the New Year RALLY!

by Mary Ellen McGonagle,
President, MEM Investment Research
In this video, Mary Ellen analyzes the divergence between the S&P 500 and the Nasdaq while highlighting some of the areas driving Growth stocks. She also talks about the continuation rally in Energy and Utility stocks and shares which stocks are driving these areas higher.
This video originally...
READ MORE
MEMBERS ONLY
The Best Five Sectors, #1
by Julius de Kempenaer,
Senior Technical Analyst, StockCharts.com
HAPPY NEW YEAR!!!
Ever since the introduction of RRG back in 2011, many people have asked me questions like: "What is the track record for RRG" or "What are the trading rules for RRG"?
My answers have always been, and will continue to be, "There...
READ MORE
MEMBERS ONLY

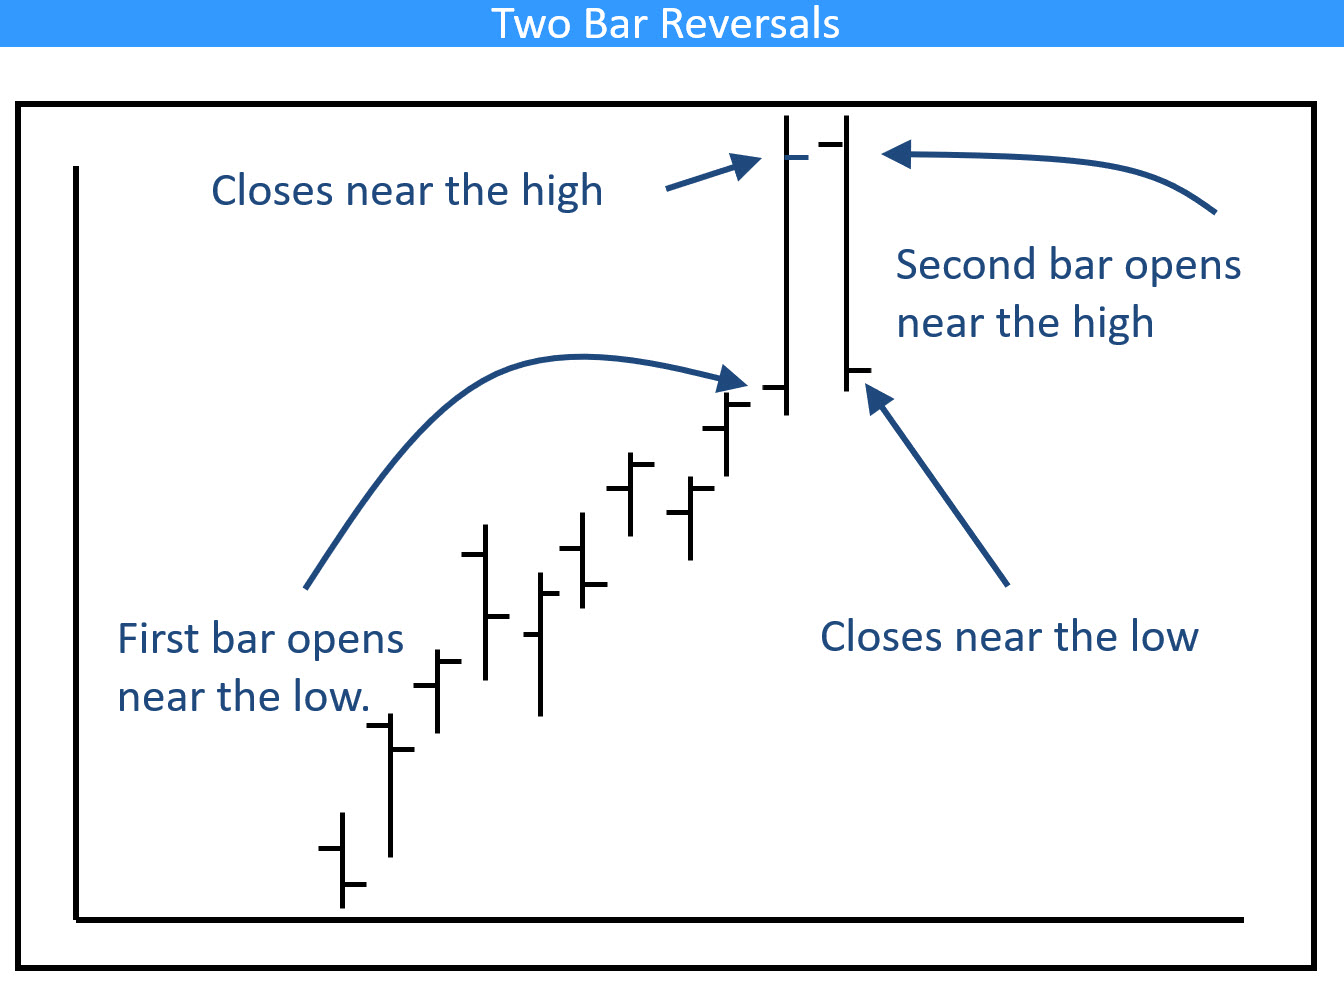
These Bars and Candles May Hold the Key for 2025

by Martin Pring,
President, Pring Research
Most of the time, when we study bars or candlesticks, our attention is focused on daily and intraday charts, since they give early warnings of a possible change in the short-term trend. Nonetheless, it occasionally makes sense to step back and take a look at monthly bars and candlesticks. Not...
READ MORE
MEMBERS ONLY

Trump's Policy Shift Reveals Potential Big Winner!
by Mary Ellen McGonagle,
President, MEM Investment Research
In this video, Mary Ellen highlights whether to buy last week's pullback. She discusses the rise in interest rates and why, as well as which areas are being most impacted. Last up, she reviews potential winners with new Trump policy, how to spot a downtrend reversal, and the...
READ MORE
MEMBERS ONLY

Quantum Computing Stocks: Why You Should Invest in Them Now

by Jayanthi Gopalakrishnan,
Director of Site Content, StockCharts.com
KEY TAKEAWAYS
* Quantum computing stocks have been rising since November.
* Four quantum computing stocks were in the "Small-Cap, Top 10" category in the StockCharts Technical Rank (SCTR) report.
* You can also gain exposure to quantum computing stocks by investing in the Defiance Quantum ETF.
Qubits, quantum advantage, gate...
READ MORE
MEMBERS ONLY

AI Boom Meets Tariff Doom: How to Time Semiconductor Stocks

by Karl Montevirgen,
The StockCharts Insider
KEY TAKEAWAYS
* Semiconductors are caught in a tug-of-war with AI demand on one side and tariff fears on the other.
* The industry's technical performance shows a narrow standstill that can break either way.
* Watch SMH and its top three holdings—NVDA, TSM, and AVGO—for insights into timing...
READ MORE
MEMBERS ONLY
Three Big Negatives Overshadow the Uptrends in SPY and QQQ

by Arthur Hill,
Chief Technical Strategist, TrendInvestorPro.com
KEY TAKEAWAYS
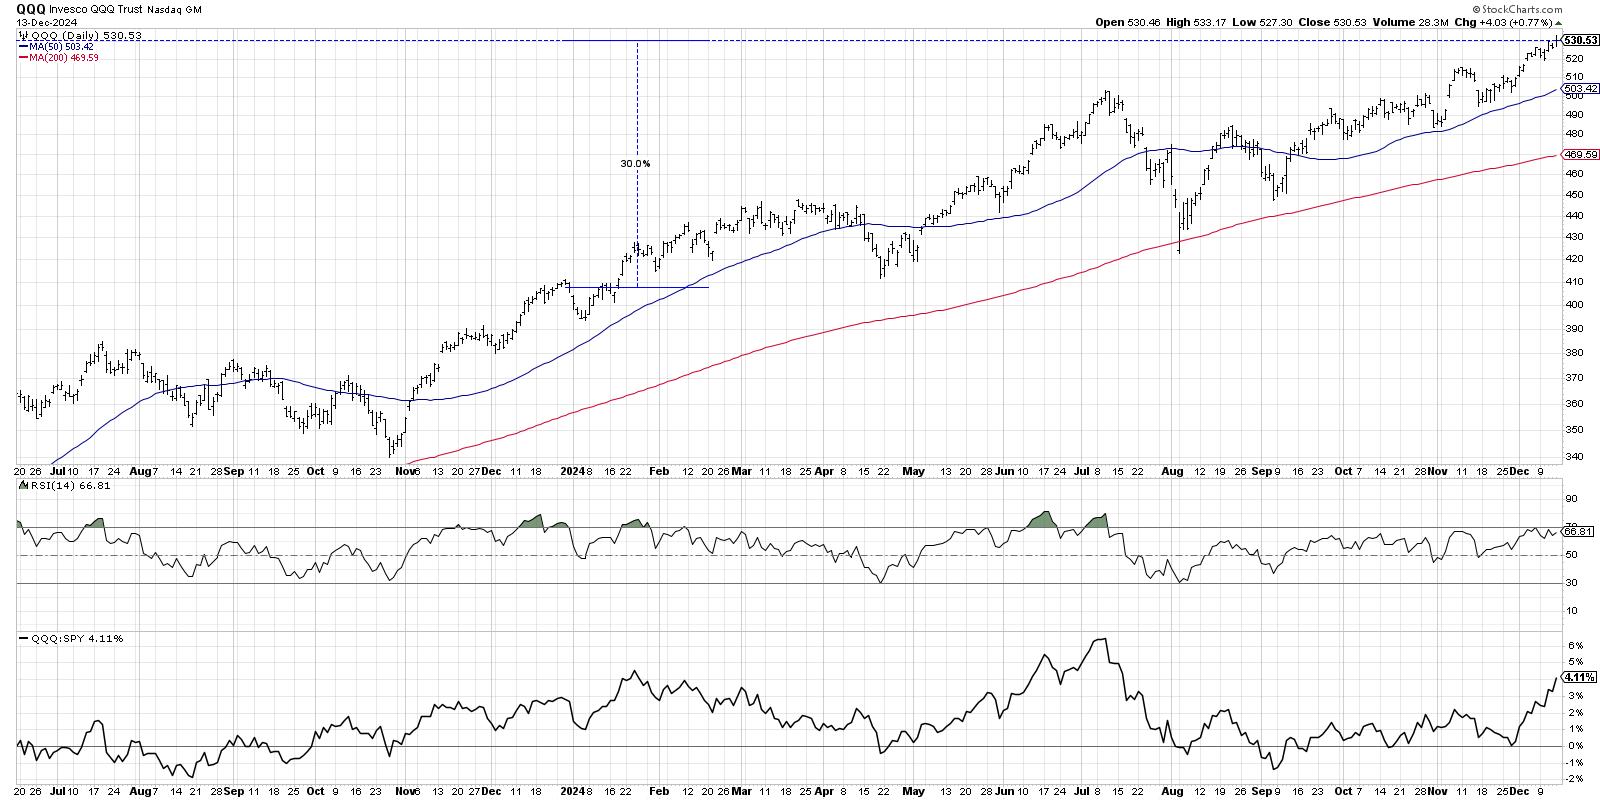
* SPY and QQQ are still in long-term uptrends, but the red flags are rising.
* Housing and semis, two key cyclical groups, are in downtrends.
* Interest rates are rising as the 10-yr Yield reversed a 13 month downtrend.
SPY and QQQ remain in long-term uptrends, but three big negatives...
READ MORE
MEMBERS ONLY

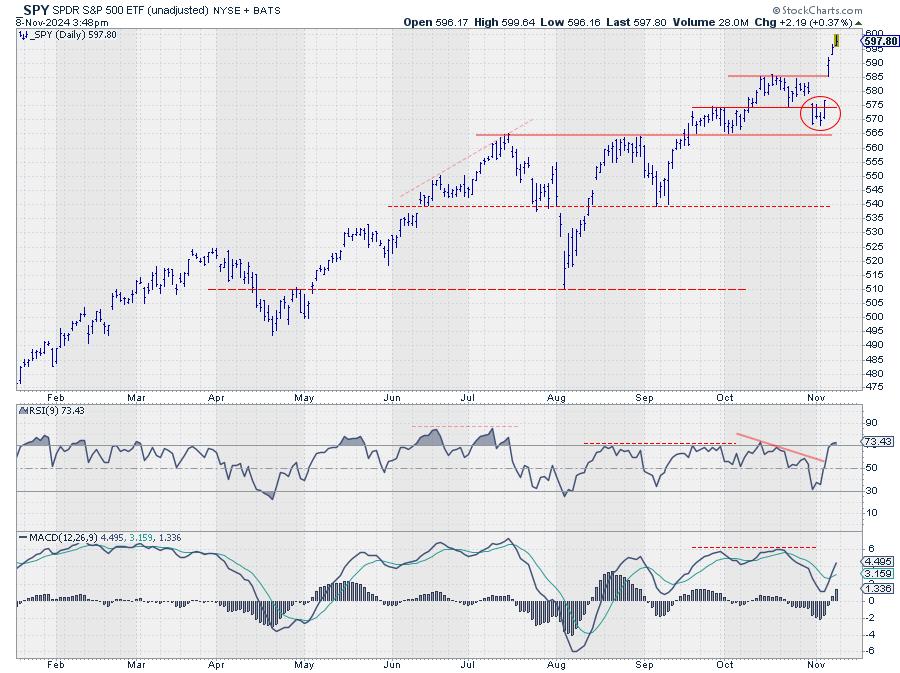
Navigating the Indecisive SPY: What Investors Should Know
by Jayanthi Gopalakrishnan,
Director of Site Content, StockCharts.com
KEY TAKEAWAYS
* The SPDR S&P 500 ETF (SPY) was flagged as a technically strong chart.
* An analysis of the SPY chart shows the ETF is being indecisive.
* Monitor the chart of SPY for indications of a decisive move in either direction.
When running my StockCharts Technical Rank (SCTR)...
READ MORE
MEMBERS ONLY
Will the QQQ Sell Off in January? Here's How It Could Happen

by David Keller,
President and Chief Strategist, Sierra Alpha Research
In recent interviews for my Market Misbehavior podcast, I've asked technical analysts including Frank Cappelleri, TG Watkins, and Tom Bowley what they see happening as we wrap a very successful 2024. With the Nasdaq 100 logging about a 30% gain for 2024, it's hard to imagine...
READ MORE
MEMBERS ONLY

Small Caps are Set to Skyrocket in 2025—Here's What You Need to Know
by Karl Montevirgen,
The StockCharts Insider
KEY TAKEAWAYS
* Small caps tend to outperform following an election year.
* In most annual cycles, small caps also have their seasonal tendencies.
* The chart of the iShares Russell 2000 ETF (IWM) is worth monitoring, especially as it approaches a buy point.
With an new administration inbound in Washington, D.C....
READ MORE
MEMBERS ONLY
Master the MACD Zero Line for a Trading Edge!

by Joe Rabil,
President, Rabil Stock Research
In this exclusive StockCharts video, Joe shows how to use the MACD zero line as a bias for a stock. As opposed to offering a buy signal, this Zero line level can provide insight into a market or stock's underlying condition; Joe shows how to refine that information...
READ MORE
MEMBERS ONLY

Are ARK's Innovation ETFs on to Something BIG?
by Mary Ellen McGonagle,
President, MEM Investment Research
After a broad market review, Mary Ellen shares strategies for trading pull backs and breakouts in stocks. Highlights include a deep dive into ARK's Innovation ETFs and their holdings, locating market strength in the process. Tune in for valuable insights and tips to help you make informed investment...
READ MORE
MEMBERS ONLY
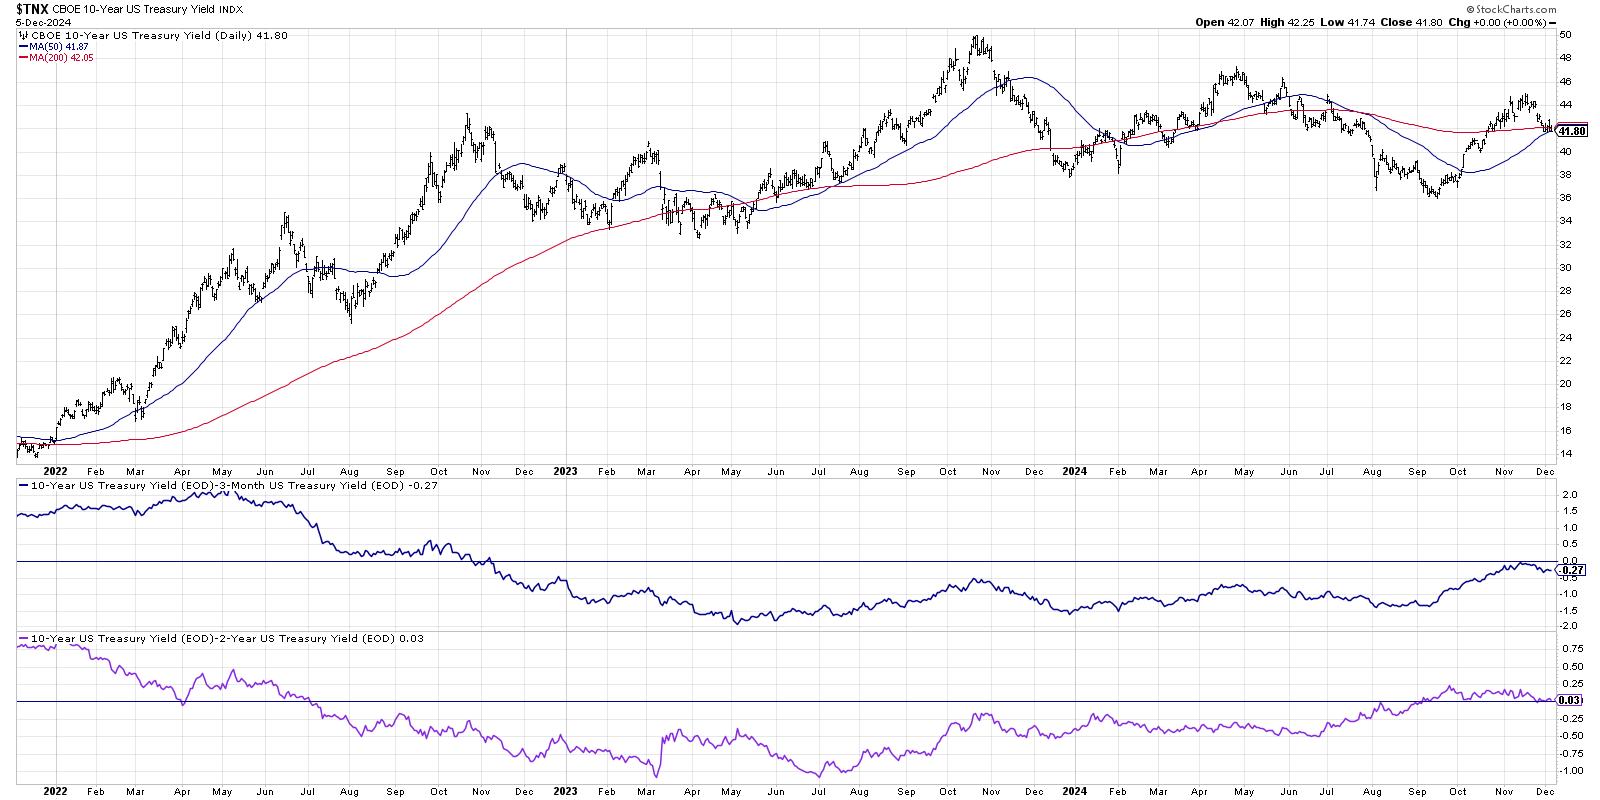
Two ETFs That Could Thrive Based on a Normal Yield Curve
by David Keller,
President and Chief Strategist, Sierra Alpha Research
My recent discussions on the Market Misbehavior podcasthave often included some comments on the interest rate environment, particularly the shape of the yield curve. We've had an inverted yield curve since late 2022, and so the yield curve taking on a more normal shape could mean a huge...
READ MORE
MEMBERS ONLY

Get Ahead of 2025 Stock Trends!
by Joe Rabil,
President, Rabil Stock Research
In this exclusive StockCharts video, Joe uses long-term views of the S&P 500 to explain how the market is positioned as we move into 2025. He uses Yearly and Quarterly Candles and describes why there is a risk of a pullback next year, and he also covers the...
READ MORE
MEMBERS ONLY
Can You Really Predict Stock Market Success Using the Yield Curve?
by David Keller,
President and Chief Strategist, Sierra Alpha Research
In this video, Dave reflects on the shape of the yield curve during previous bull and bear cycles with the help of StockCharts' Dynamic Yield Curve tool. He shares insights on interest rates as investors prepare for the final Fed meeting of 2024, and shares two additional charts he&...
READ MORE
MEMBERS ONLY
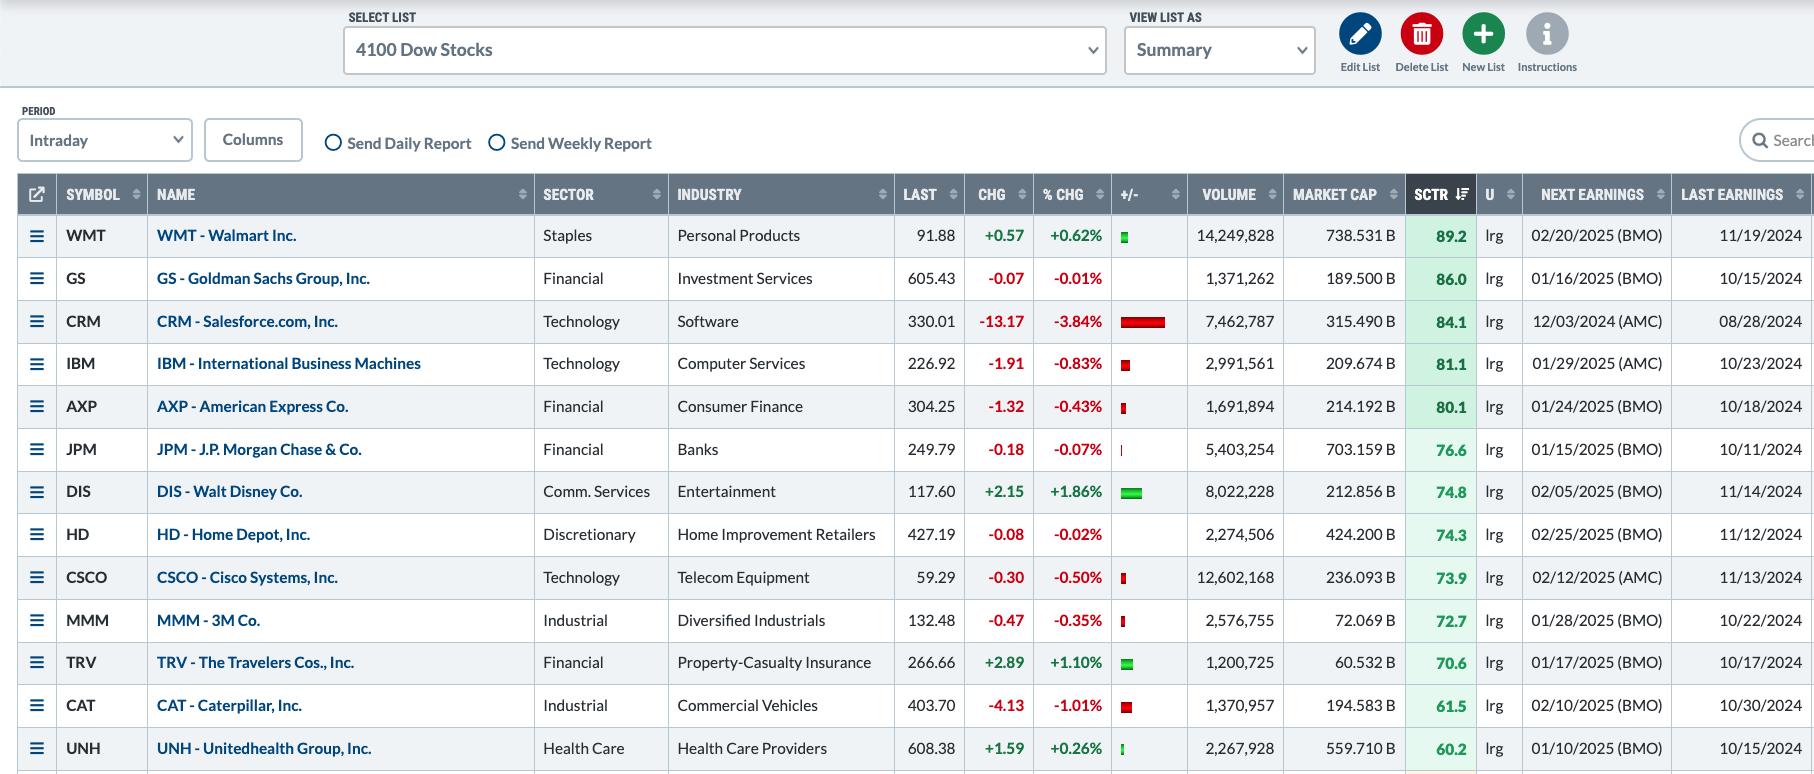
Five Ways You Should Use ChartLists Starting Today!
by David Keller,
President and Chief Strategist, Sierra Alpha Research
Having used many technical analysis platforms over my career as a technical analyst, I can tell you with a clear conscience that the ChartList feature on StockCharts provides exceptional capabilities to help you identify investment opportunities and manage risk in your portfolio. Once you get your portfolio or watch list...
READ MORE
MEMBERS ONLY

Can the S&P 500 Rally Without Tech?
by Julius de Kempenaer,
Senior Technical Analyst, StockCharts.com
In this video from StockCharts TV,Julius takes a deep dive into US sector rotation, breaking it down into offensive, defensive and cyclical sectors. He first looks at the relative rotations that are shaping up inside the group, assessing each sector's price chart in combination with the rotation...
READ MORE
MEMBERS ONLY

Plunge in Treasury Yields Triggers Gap-Surge in Home Builders
by Arthur Hill,
Chief Technical Strategist, TrendInvestorPro.com
KEY TAKEAWAYS
* The 10-yr Treasury Yield reversed its upswing with a sharp decline.
* The 7-10 Yr Treasury Bond ETF surged and reversed its downswing.
* Lower yields provided a big boost to the Home Construction ETF.
The 10-yr Treasury Yield reversed its upswing with a sharp decline and the Home Construction...
READ MORE
MEMBERS ONLY
These Old-School Stocks Have Joined The AI Rally!
by Mary Ellen McGonagle,
President, MEM Investment Research
In this StockCharts TV video, Mary Ellen reviews the broad-based rally that pushed the Equal-Weighted SPX to new highs. She also shared base breakouts and downtrend reversal candidates in the now hot Retail space, and takes a close look at 3 old school stocks that are seeing AI-related growth.
This...
READ MORE
MEMBERS ONLY

Financial Upswing: Understanding the Stock Market Rally and Yield Rise
by Jayanthi Gopalakrishnan,
Director of Site Content, StockCharts.com
KEY TAKEAWAYS
* Stock market indexes resumed their bullish trend.
* Small- and mid-cap stocks rose the most showing strong upside movement.
* Treasury yields rose higher on concerns of reinflation.
The afternoon turnaround seems to be more the norm than the exception. Thursday's stock market action followed the trend. What...
READ MORE
MEMBERS ONLY
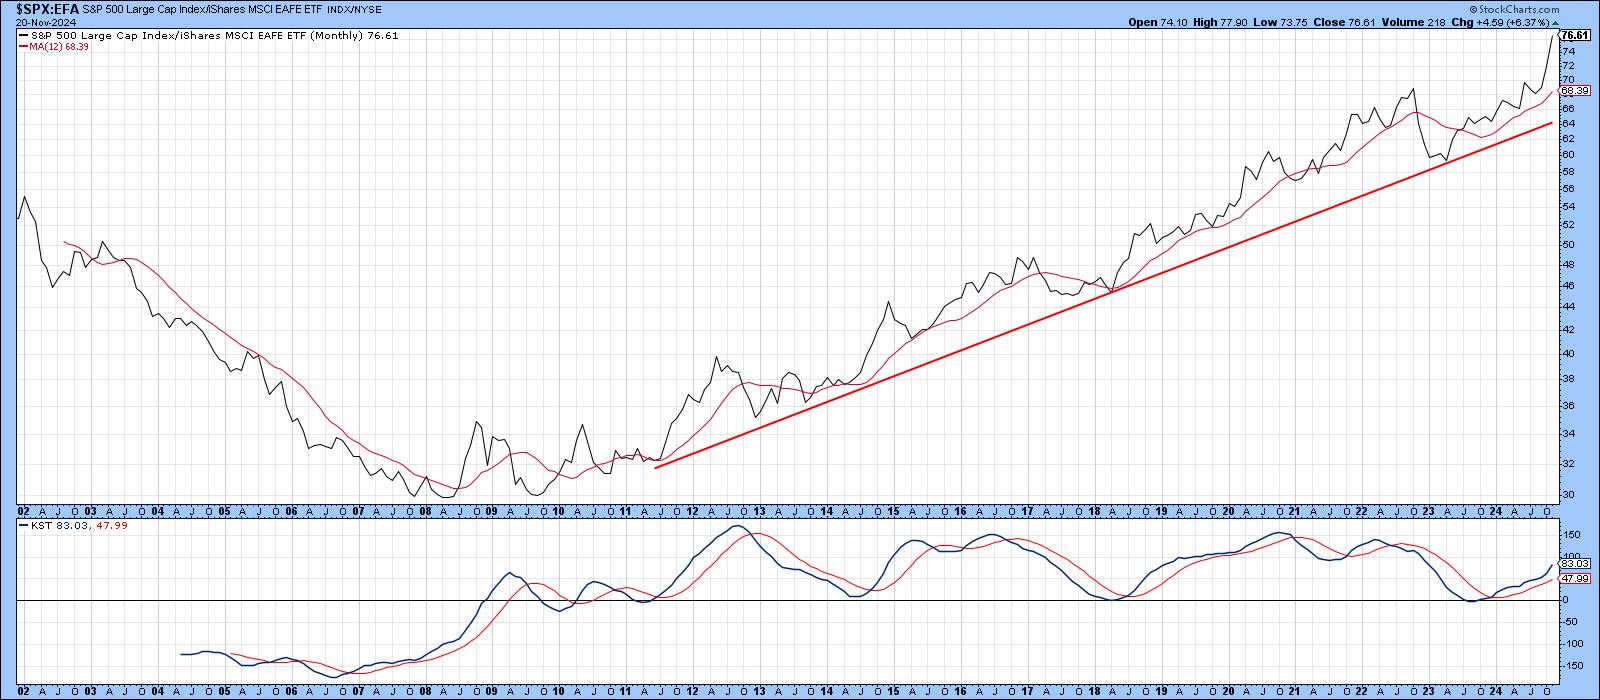
These Country ETFs are Looking Particularly Vulnerable
by Martin Pring,
President, Pring Research
Chart 1, below, compares the S&P Composite to the Europe Australia Far East ETF (EFA), which is effectively the rest of the world. It shows that US equities have been on a tear against its rivals since the financial crisis. More to the point, there are very few...
READ MORE
MEMBERS ONLY
Be ALERT for Warning Signs - S&P 500 Downturn
by Joe Rabil,
President, Rabil Stock Research
In this exclusive StockCharts video, Joe goes into detail on the S&P 500 ETF (SPY), sharing why using MACD and ADX together can be beneficial -- especially in the current environment. He touches on Sentiment, Volatility and Momentum, pointing to reasons why we need to be on alert...
READ MORE
MEMBERS ONLY
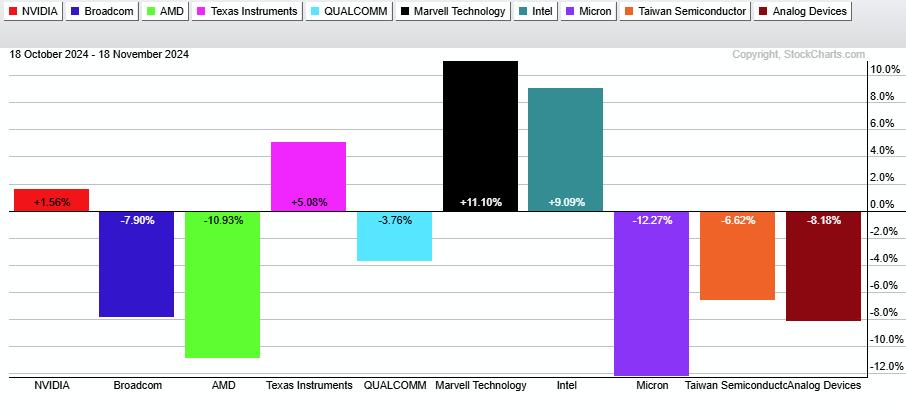
A Tale of Two Semiconductor ETFs - Why is SMH holding up better than SOXX?
by Arthur Hill,
Chief Technical Strategist, TrendInvestorPro.com
KEY TAKEAWAYS
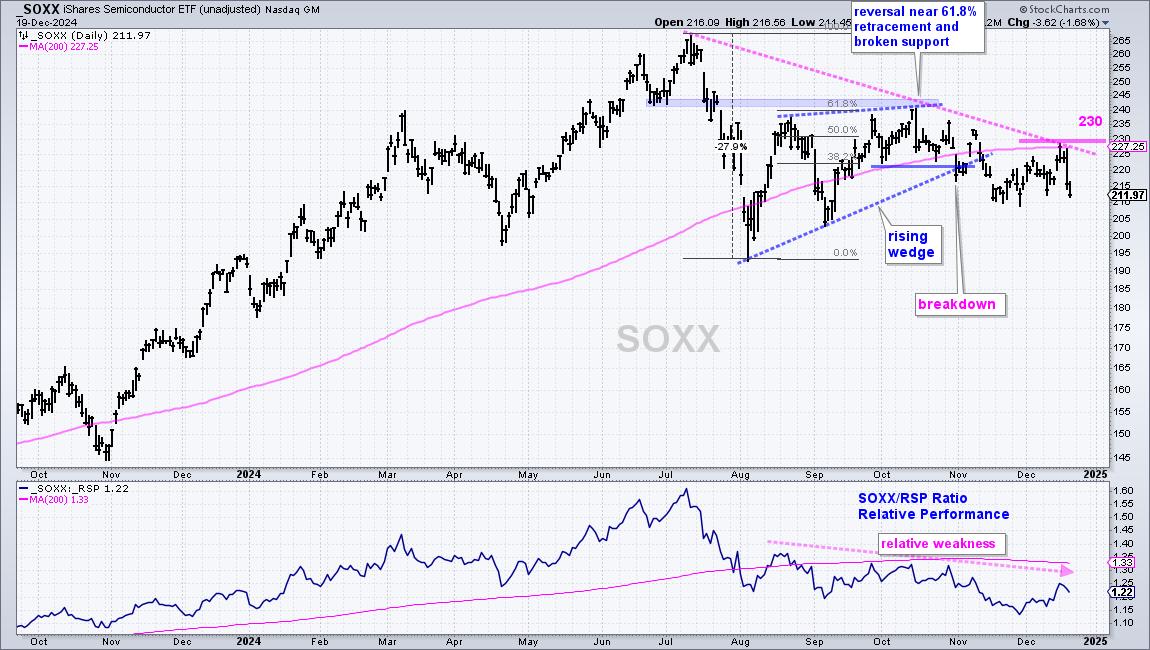
* SOXX is lagging SMH as it broke the 200-day SMA and confirmed a bearish pattern.
* SMH is holding up because its top component remains strong.
* Nevertheless SMH is at a moment of truth ahead of a big earnings report from Nvidia.
Even though the iShares Semiconductor ETF (SMH)...
READ MORE
MEMBERS ONLY

MarketCarpets Secrets: How to Spot Winning Stocks in Minutes!
by Karl Montevirgen,
The StockCharts Insider
KEY TAKEAWAYS
* StockCharts' MarketCarpets can be customized to find stocks to invest in using specific criteria.
* The MarketCarpets tool helps users drill down from a big-picture view to individual stocks.
* Getting an at-a-glance view of strong stocks poised to bounce can be done immediately and efficiently with MarketCarpets.
When...
READ MORE
MEMBERS ONLY

Simple Way to Find Confluence FAST Using Moving Averages
by Joe Rabil,
President, Rabil Stock Research
In this exclusive StockCharts video, Joe explains how to use an 18 simple moving average in multiple timeframes to identify when a stock has confluence amongst 2-3 timeframes. He shows how to start with the higher timeframes first, before working down to the lower ones. Joe then covers the shifts...
READ MORE
MEMBERS ONLY

Best Way to Capitalize on Election Rally!
by Mary Ellen McGonagle,
President, MEM Investment Research
In this StockCharts TV video, Mary Ellen presents a deep dive into last week's sharp rally in the markets. She highlights what areas could perform best under a Trump administration and how to spot a pullback. She takes a close look at the "New Economy" and...
READ MORE
MEMBERS ONLY
Three Sectors Leading SPY Back to Offense
by Julius de Kempenaer,
Senior Technical Analyst, StockCharts.com
KEY TAKEAWAYS
* The market came out of defensive mode after the election.
* Old resistance at 585 is now support for SPY.
* XLC, XLY, and XLF are all showing strength.
First of all, for those of you looking for a new video this week, I have intentionally skipped it because I...
READ MORE
MEMBERS ONLY

These S&P 500 Stocks Are Poised To Outperform!
by Mary Ellen McGonagle,
President, MEM Investment Research
In this StockCharts TV video, Mary Ellen reviews the negative price action in the broader markets while highlighting pockets of strength. She shares how the rise in interest rates is impacting the markets ahead of next week's FOMC meeting. Last up is a segment on how to use...
READ MORE
MEMBERS ONLY

Halloween Scare: The Stock Market Ends October on a Wicked Tone
by Jayanthi Gopalakrishnan,
Director of Site Content, StockCharts.com
KEY TAKEAWAYS
* Tepid earnings and negative news sends Tech stocks plunging.
* Economic data supports the narrative that the Fed will cut interest rates by 25 basis points in November.
* The long-term trend of the broader indexes are still bullish.
The Halloween effect caught up with the stock market! October 31...
READ MORE
MEMBERS ONLY

A Simple Candle With BIG Meaning
by Joe Rabil,
President, Rabil Stock Research
In this exclusive StockCharts video, Joe shows a specific candlestick pattern that, when it develops at the right time, can signal the start of a new upleg. He uses NVDA, MSFT and GLD to explain how this can setup at different times and can give a timely signal to look...
READ MORE
MEMBERS ONLY
Four Sectors That Have Just Experienced Bearish Weekly Action
by Martin Pring,
President, Pring Research
Most weekends, I flip through a chartlist featuring weekly bars and candles for sectors, country ETFs, currencies, bonds and some commodities. The idea is to see whether any of these entities are showing signs of bullish or bearish reversals. Most of the time, this fishing exercise does not uncover a...
READ MORE
MEMBERS ONLY
How to Trade Gaps Up (and Down) After Earnings
by Mary Ellen McGonagle,
President, MEM Investment Research
In this StockCharts TV video, Mary Ellen shares how the markets trade right before the elections, and also reviews the move in Tesla (TSLA) after reporting earnings. She shares examples of what to watch for if your stock is due to report earnings - and what to do if it...
READ MORE
MEMBERS ONLY
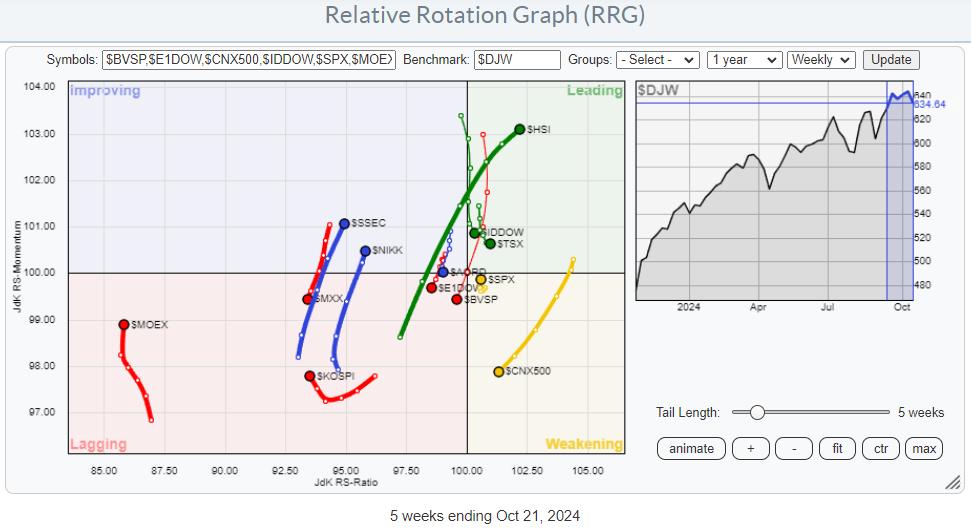
The US is Not the Only Stock Market in the World
by Julius de Kempenaer,
Senior Technical Analyst, StockCharts.com
KEY TAKEAWAYS
* Asian stock markets showing strong relative trends.
* Meanwhile, India, Mexico, and Brazil are nosediving.
* Overall, the US is stull beating Europe.
The global stock market is a big place, and it extends far beyond the borders of the United States. While the US market is undeniably the largest...
READ MORE
MEMBERS ONLY
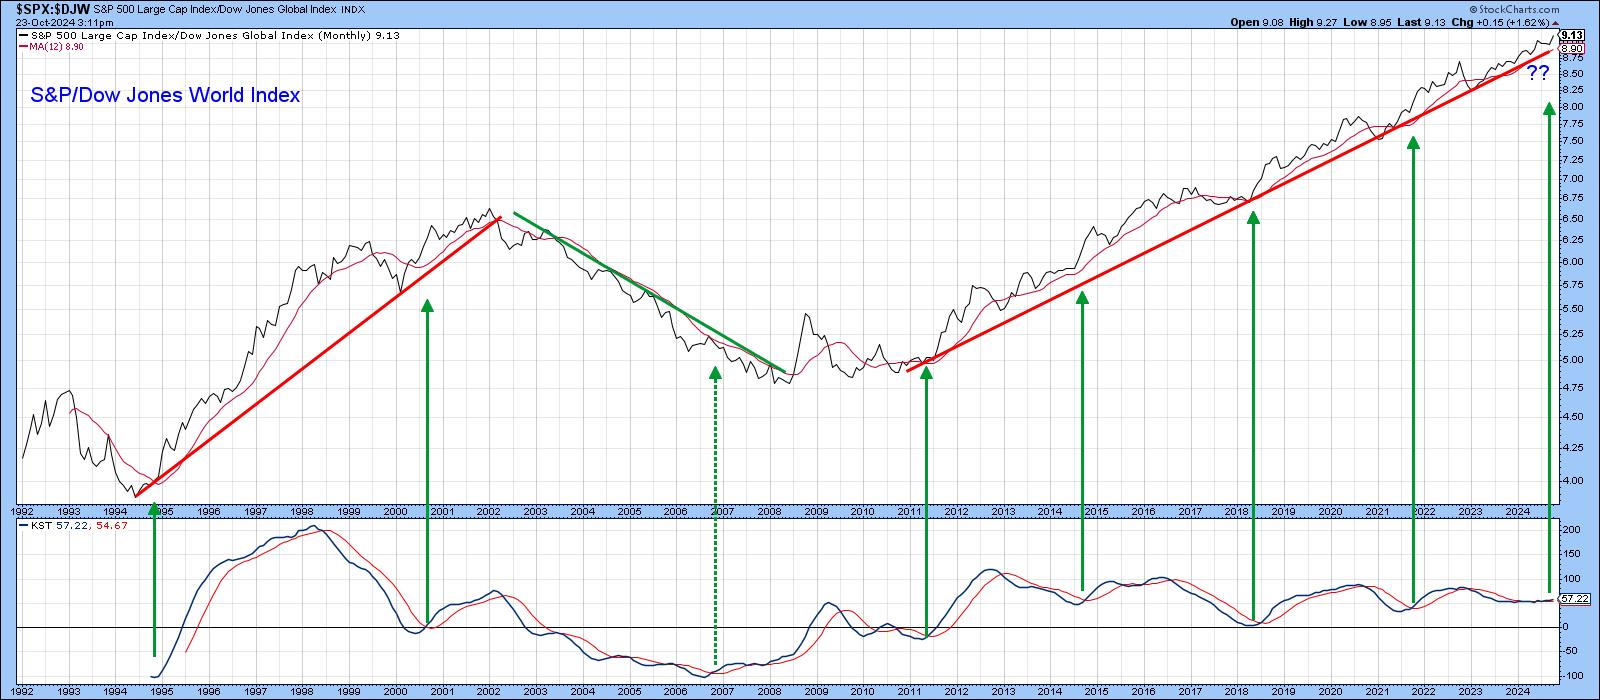
This Stock Market Will Likely Outperform the World Index, But Could Be Outshone by Something Completely Different
by Martin Pring,
President, Pring Research
Since 2011, the US stock market, represented by the S&P Composite, has outperformed the world. In the last couple of weeks or so, it has managed to break out from a trading range in its relationship with the rest of the world and looks headed even higher on...
READ MORE
MEMBERS ONLY

My Favorite RSI Signal
by Joe Rabil,
President, Rabil Stock Research
In this exclusive StockCharts video, Joe shows how he sets up the RSI 20 and 5 in ACP to save space and improve analysis. He explains how he uses RSI for both reading the trend and for fine-tuning entry in a strong trend. He gives examples using weekly, daily, and...
READ MORE
MEMBERS ONLY

Be On the Lookout for THIS During Earnings Season!
by Mary Ellen McGonagle,
President, MEM Investment Research
In this StockCharts TV video, Mary Ellen reviews what's driving the markets higher and how you can capitalize. Moves in TSLA, NVDA, and NFLX are highlighted. She also reviews price action greatly impacted by earnings, many driven by analyst upgrades and downgrades.
This video originally premiered October 18,...
READ MORE
MEMBERS ONLY

Why the MACD Crossover Signal is SO Important
by Joe Rabil,
President, Rabil Stock Research
In this exclusive StockCharts TV video, Joe shares the MACD downside crossover signal and explains the different ways it can play out when it takes place above the MACD zero line. These downside crossovers can lead to opportunities depending on other criteria, including the ADX action. He then shows how...
READ MORE
MEMBERS ONLY

The Next Big Move in Yields May Be Different Than You Think
by Martin Pring,
President, Pring Research
Below, Chart 1 shows a weekly plot for the 30-year yield, where we can see a perfectly formed top whose completion was followed by a negative 65-week EMA crossover. At the time of the breakdown, there were few grounds for suspecting a false break. However, in the last couple of...
READ MORE
MEMBERS ONLY
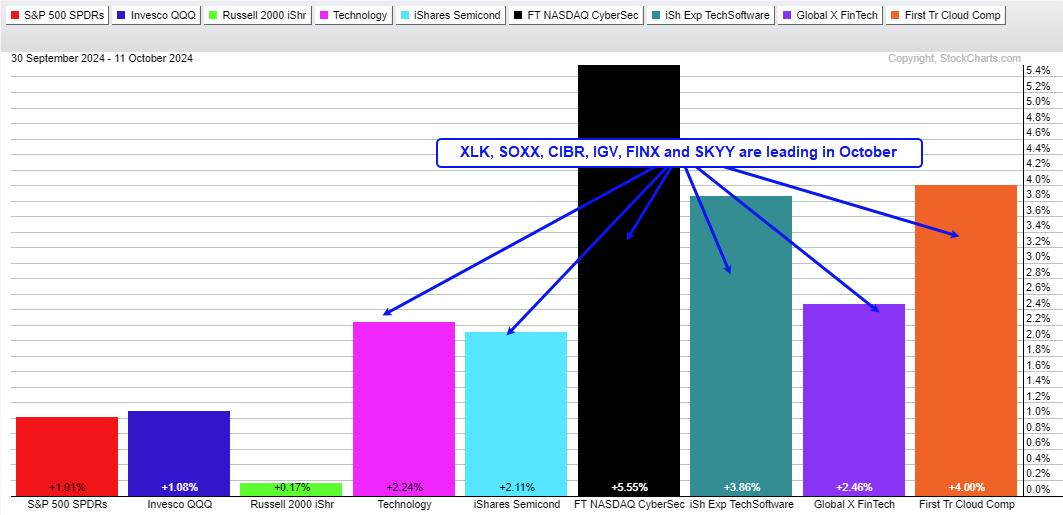
Cybersecurity ETF Comes to Life with New Trending Phase
by Arthur Hill,
Chief Technical Strategist, TrendInvestorPro.com
KEY TAKEAWAYS
* Stocks go through trending and non-trending phases.
* Non-trending phases often last longer than trending phases.
* CIBR recently broke out and started a new trending phase.
The Cybersecurity ETF (CIBR) is resuming the lead as it surged to new highs this past week. It is important to note that...
READ MORE