MEMBERS ONLY

Last Week's Pullback is a Buying Opportunity!

by Mary Ellen McGonagle,
President, MEM Investment Research
In this StockCharts TV video, Mary Ellen highlights what's driving these markets higher despite a rise in interest rates. She also focuses on the leadership area in Technology and shares several stocks from this group. Last up, she reviews how to quickly uncover top stock candidates when a...
READ MORE
MEMBERS ONLY
It's Large-Cap Growth Stocks (Mag 7) Once Again

by Julius de Kempenaer,
Senior Technical Analyst, StockCharts.com
KEY TAKEAWAYS
* SPY is starting to resolve its negative divergence with RSI.
* Large-cap growth is coming back into favor.
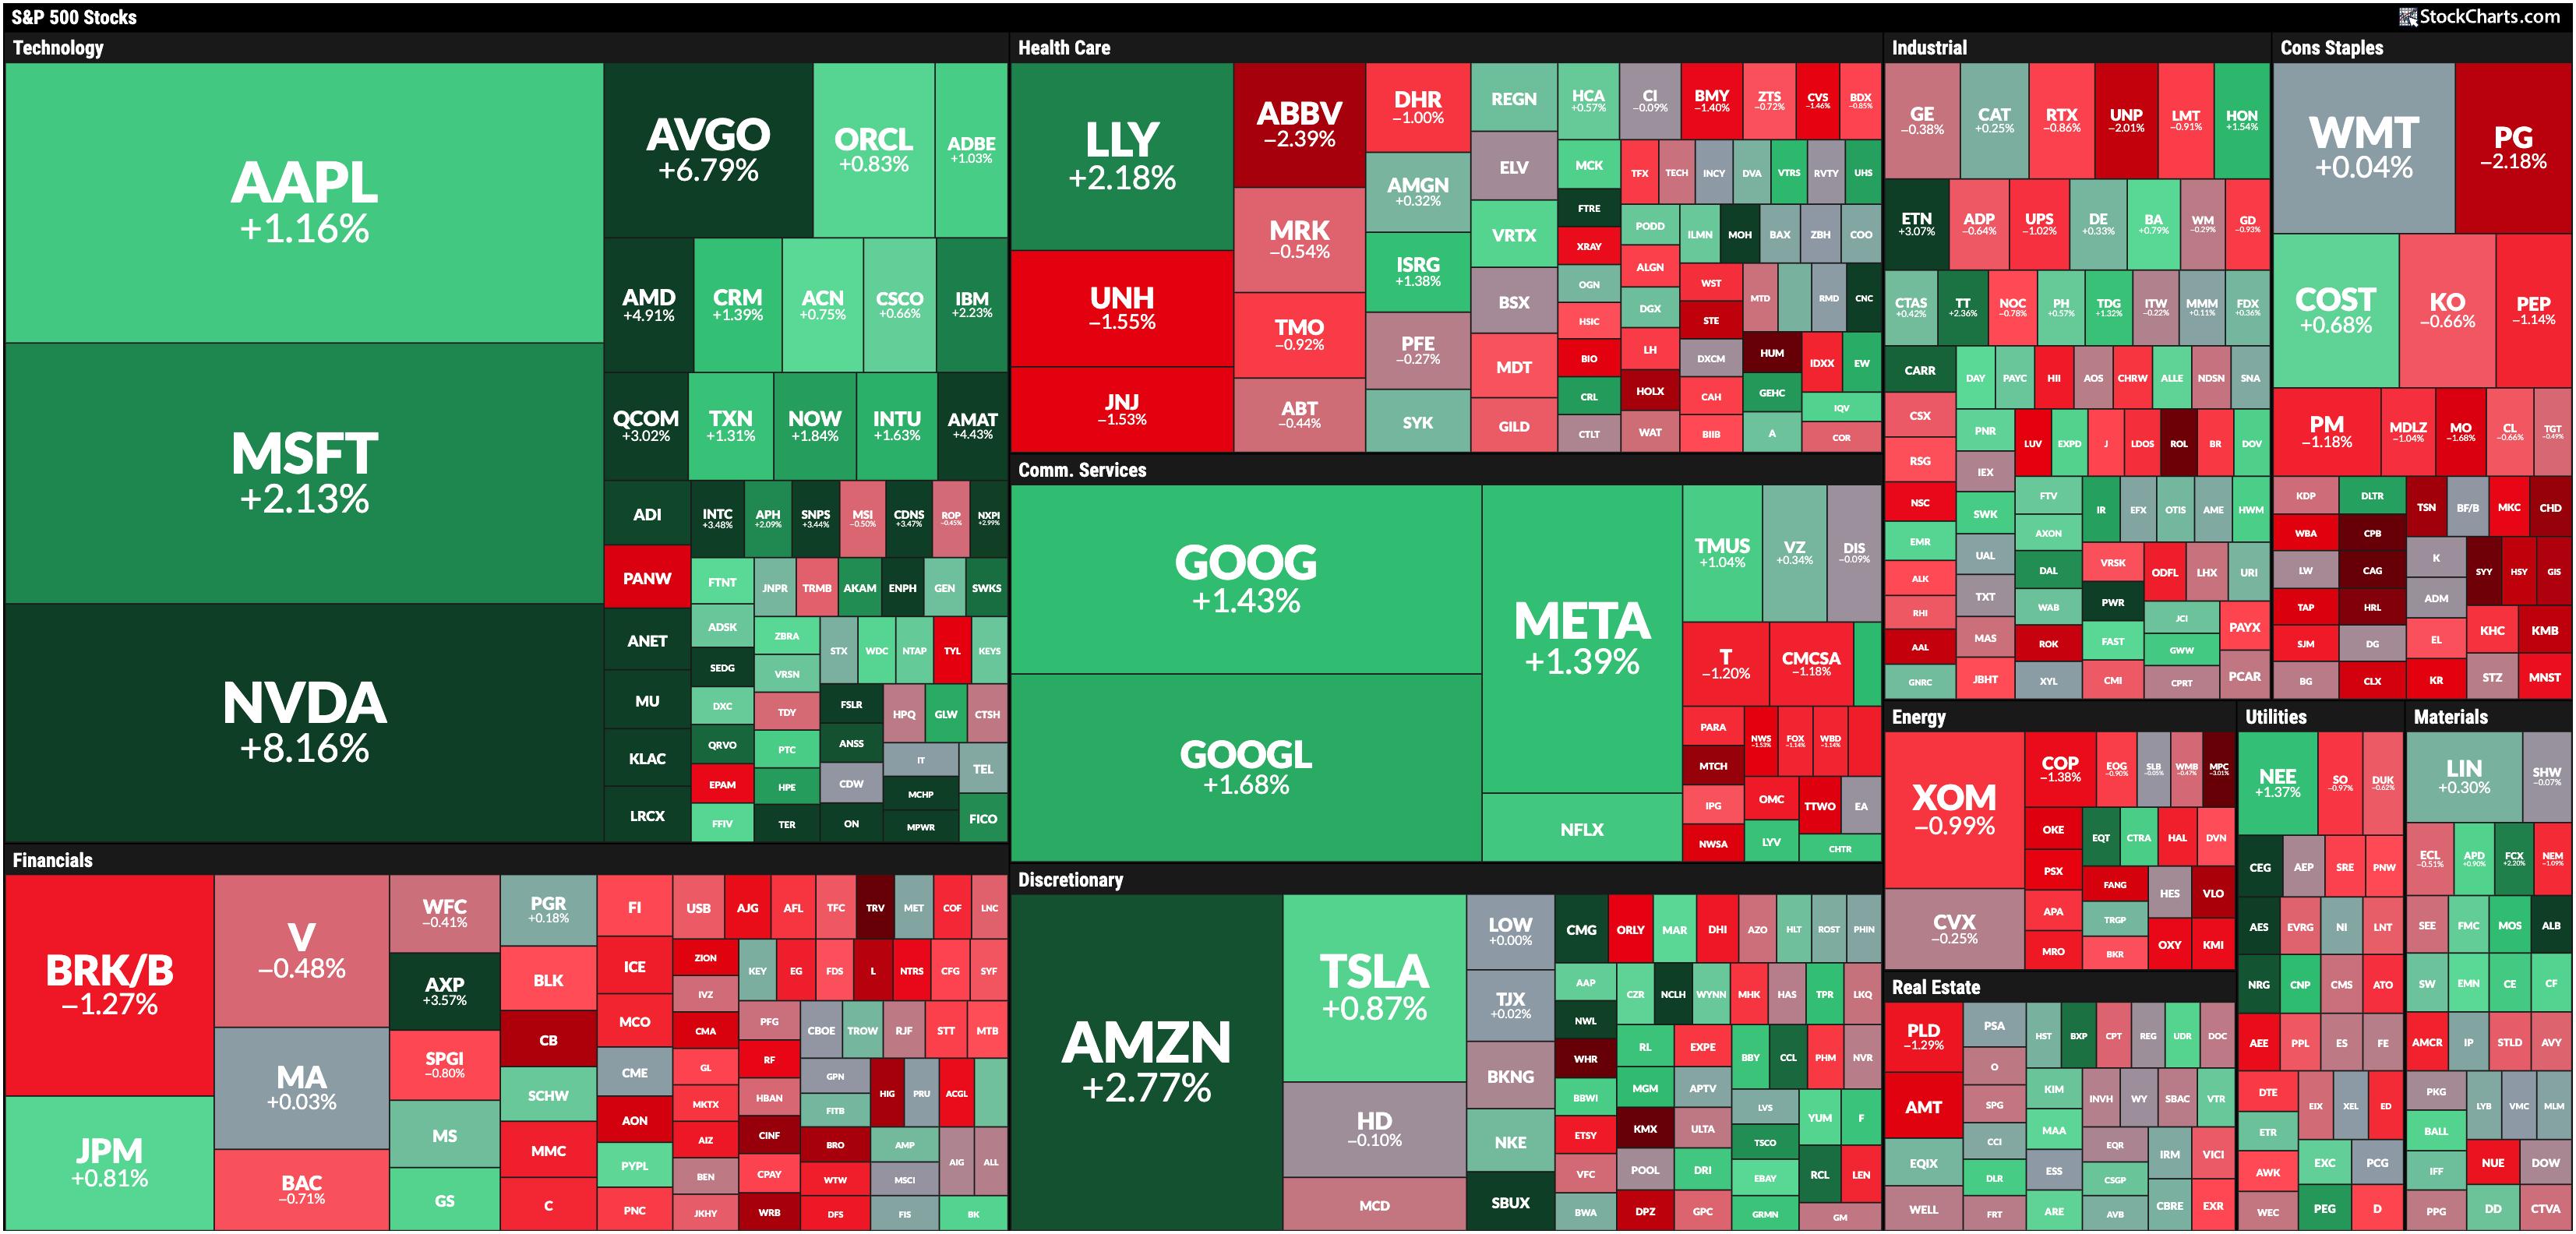
* Magnificent 7 stocks provided 2.9% of the S&P 50's 6.8% performance over the past five weeks.
Where is the Recent Performance in the S&...
READ MORE
MEMBERS ONLY
Tech vs Semiconductors: Which One Should You Be Trading?

by Karl Montevirgen,
The StockCharts Insider
KEY TAKEAWAYS
* Doing a top-down sector-to-industry analysis can be an effective way to find tradable opportunities.
* It makes sense to compare charts to see which ones are outperforming and which are underperforming.
* Get a bigger picture, drill down using relative performance indicators, and then examine specific key levels of each...
READ MORE
MEMBERS ONLY

What's Wrong With This SPX Breakout?

by Joe Rabil,
President, Rabil Stock Research
In this exclusive StockCharts TV video, Joe presents the price pattern to follow the recent breakout in the S&P 500. He discusses narrow range bars, wide range bars and when they are important. Joe then explains what needs to take place now to either confirm a breakout or...
READ MORE
MEMBERS ONLY

Oil Prices Soar Amid Middle East Tensions – What's Next for Gas Prices?
by Karl Montevirgen,
The StockCharts Insider
KEY TAKEAWAYS
* Crude oil prices spiked, largely due to tensions in the Middle East.
* Gasoline prices are following crude oil prices.
* An analysis of the charts of crude oil and gasoline prices show potential trading opportunities.
Monday saw something of a bloodbath on Wall Street, with the Dow ($INDU) plunging...
READ MORE
MEMBERS ONLY

Will Technology Drive S&P Higher in October?
by Julius de Kempenaer,
Senior Technical Analyst, StockCharts.com
In this video from StockCharts TV,Julius explores the October seasonal outlook for the S&P 500 and various sectors. Seasonality suggests a potential rise in the S&P 500, fueled by strength in technology, but there are still concerns about the ongoing negative divergence between price and...
READ MORE
MEMBERS ONLY

Gold Price Surge: What Goldman Sachs' $2,900 Forecast Means for Investors
by Karl Montevirgen,
The StockCharts Insider
KEY TAKEAWAYS
* Goldman Sachs just raised their price target for gold to $2,900 an ounce.
* Goldman Sachs' price target roughly equals $280 in SPDR Gold Shares ETF (GLD).
* GLD could have more room to run.
Here's the issue with gold: it's difficult to find...
READ MORE
MEMBERS ONLY

Traders are Eyeing These Metals After China's Big Economic Shift: Here's What You Need to Know
by Karl Montevirgen,
The StockCharts Insider
KEY TAKEAWAYS
* Metals appear to be reacting bullishly after China injected more stimulus into its economy.
* Gold, silver, and copper are displaying unique patterns and structures.
* Keep an eye on momentum for clues as to each metal's likely move within the context of its current pattern.
China'...
READ MORE
MEMBERS ONLY

Are Lower Interest Rates Bad For Workers? | Focus on Stocks: October 2024

by Larry Williams,
Veteran Investor and Author
The common economic perception is that lower interest rates are good for business, which, in turn, means good for job growth. The following charts will turn that idea upside down and inside out. Keep in mind there is no chart fancy-dancing going on here; I am just presenting the last...
READ MORE
MEMBERS ONLY
Stock Market's Spectacular Q3: Highest Sector Performer is Utilities

by Jayanthi Gopalakrishnan,
Director of Site Content, StockCharts.com
KEY TAKEAWAYS
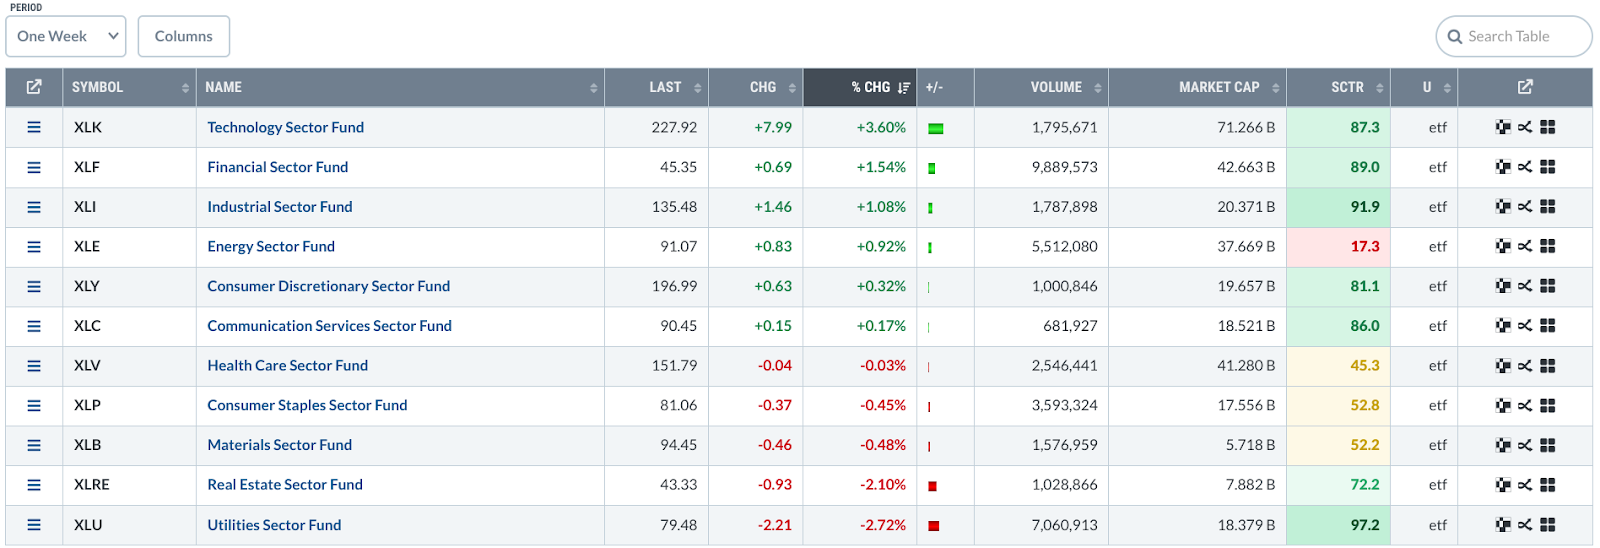
* The leading sector performer in Q3 was Utilities, up by 19.35%.
* Utility stocks are gaining attention because of their ability to power up AI companies.
* Many utility stocks provide dividends, which could add some extra cash to your portfolio.
September, typically considered to be the weakest month...
READ MORE
MEMBERS ONLY

Why Were Chinese Stocks Up 20% Last Week?!
by Mary Ellen McGonagle,
President, MEM Investment Research
In this StockCharts TV video, Mary Ellen reviews the broader markets, including sector and industry group rotation, before highlighting the sharp move into Chinese stocks. She shares her thoughts on whether it's too late to participate. In addition, she looks at the key traits that signal your stock...
READ MORE
MEMBERS ONLY

Unlocking GDX's Short-Term Potential: How to Nail the Measured Move Strategy
by Karl Montevirgen,
The StockCharts Insider
KEY TAKEAWAYS
* VanEck Vectors Gold Miners ETF (GDX) broke above its recent highs, confirming a continued uptrend.
* GDX displayed a short-term trading setup that was apparent in its price chart.
* The "measured move" rule can exploit an obvious short-term trading opportunity in GDX.
A few weeks back, two...
READ MORE
MEMBERS ONLY

SCTR Report: China Adds More Stimulus, FXI in Second Position
by Jayanthi Gopalakrishnan,
Director of Site Content, StockCharts.com
KEY TAKEAWAYS
* iShares China Large-Cap ETF (FXI) gains technical strength and has made it to second position in the StockCharts Technical Rank (SCTR).
* FXI could be in the early stages of a bull rally, so keep an eye on this ETF.
* Set your price target levels for entry and exit...
READ MORE
MEMBERS ONLY

Strategy After Rate Cuts: Best Areas to BUY!
by Mary Ellen McGonagle,
President, MEM Investment Research
In this StockCharts TV video, Mary Ellen reviews the broader markets after last week's rate-cut induced rally. She also shares stocks that are breaking out of bases and poised to trade higher. The "nuclear renaissance" is also discussed, as well as stocks that will benefit the...
READ MORE
MEMBERS ONLY

A Sector Rotation Dilemma ...
by Julius de Kempenaer,
Senior Technical Analyst, StockCharts.com
KEY TAKEAWAYS
* Sector Rotation remains defensive
* S&P chart showing resemblence to late 2021
* Negative divergences still in play
First of all, I apologize for my absence this week. I caught something that looked like Covid, and felt like Covid, but it did not identify (pun intended) as Covid....
READ MORE
MEMBERS ONLY

Analyzing Investor Sentiment for Gold

by Carl Swenlin,
President and Founder, DecisionPoint.com
Sentiment indicators are contrarian, meaning that when the majority of investors are bullish on a market, it is bearish for that market. Most investors are aware of several sentiment indicators that relate to the stock market, but they may not be aware that there is a sentiment indicator for gold...
READ MORE
MEMBERS ONLY

The Secret to Perfecting SPY Entry Points? RSI!
by Joe Rabil,
President, Rabil Stock Research
In this exclusive StockCharts TV video, Joe shows how to use RSI in multiple timeframes to identify the next buying opportunity in the SPY. Joe thinks this rally is important; he uses the ADX to distinguish between the strength in different indices. Joe demonstrates how he moves quickly around ACP,...
READ MORE
MEMBERS ONLY

Investors Hesitant Ahead of Fed Meeting: How to Prepare
by Jayanthi Gopalakrishnan,
Director of Site Content, StockCharts.com
KEY TAKEAWAYS
* Broader stock market indexes went above resistance levels, but retreated by the close.
* Small-cap stocks took the lead in Tuesday's trading.
* The Fed's decision on interest rates could make for a volatile trading day.
The broader stock market indexes are still in a holding...
READ MORE
MEMBERS ONLY

How High Can Gold Prices Go? The Tools You Need to Spot the Next Big Breakout!
by Karl Montevirgen,
The StockCharts Insider
KEY TAKEAWAYS
* Gold prices are soaring and are at an all-time high.
* Anticipated Fed rate cuts can send gold prices higher.
* There are two tools you can use to project gold price action in bullish and bearish scenarios.
As of Tuesday, the CME's FedWatch Tool gave a 67%...
READ MORE
MEMBERS ONLY

An Indicator to Reduce Whipsaws and Ride Trends

by Arthur Hill,
Chief Technical Strategist, TrendInvestorPro.com
KEY TAKEAWAYS
* Whipsaws and losing trades are part of the process for trend-following strategies.
* These strategies are profitable because average profits far exceed average losses.
* Chartists can reduce whipsaws by adding signal thresholds to the 5/200 day SMA cross.
Whipsaws and losing trades are part of the process for...
READ MORE
MEMBERS ONLY

These Stocks are Just Beginning Their Move Higher!
by Mary Ellen McGonagle,
President, MEM Investment Research
In this StockCharts TV video, Mary Ellen reviews the broader markets and highlights pockets of strength that are starting to trend higher. She also shares add-on plays to the move into home construction stocks, and shows key characteristics needed to confirm a downtrend reversal in select stocks.
This video originally...
READ MORE
MEMBERS ONLY

A Half Point Fed Rate Cut? The Stock Market Thinks So
by Jayanthi Gopalakrishnan,
Director of Site Content, StockCharts.com
KEY TAKEAWAYS
* Stocks make a strong recovery after last week's selloff.
* Large-, mid-, and small-cap stocks closed higher, with small caps the clear leader.
* Gold and silver prices surged on interest rate cut expectations.
This week's stock market action may have caught many investors by surprise....
READ MORE
MEMBERS ONLY

A Déjà Vu in The Consumer Staples Sector Sends a Strong Warning Signal
by Julius de Kempenaer,
Senior Technical Analyst, StockCharts.com
KEY TAKEAWAYS
* Tech bounce is judged as recovery within downtrend.
* XLP, XLF, and XLV are positioned for outperformance in coming weeks.
* The XLP chart is showing interesting characteristics which we have seen before
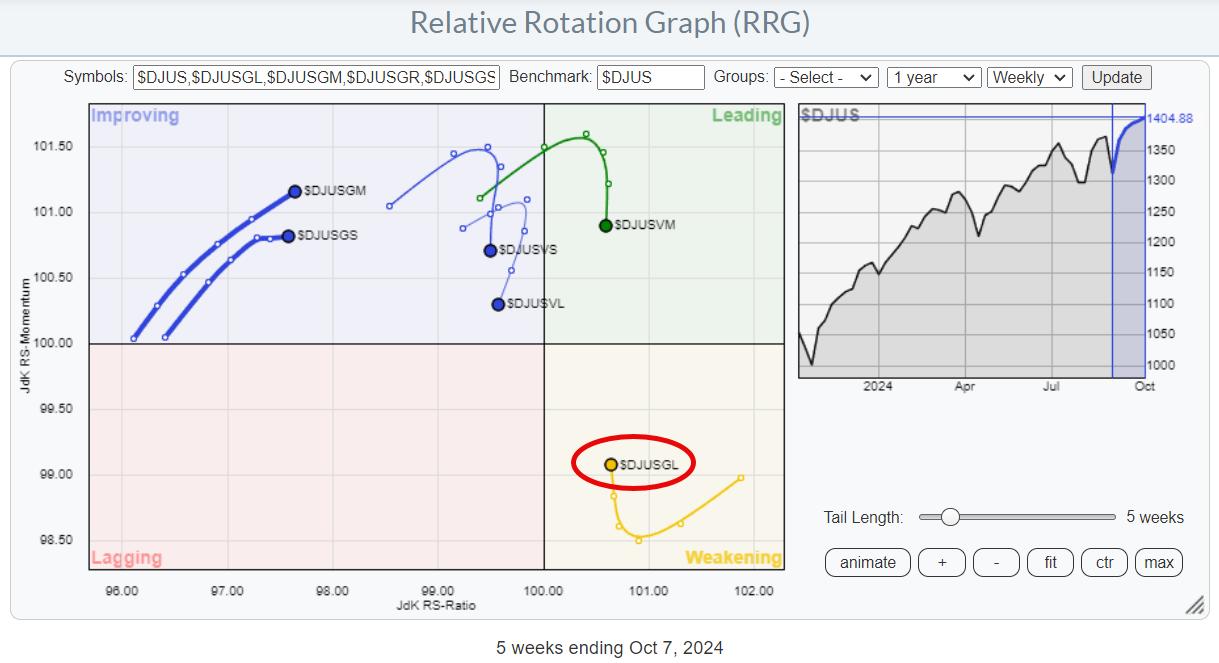
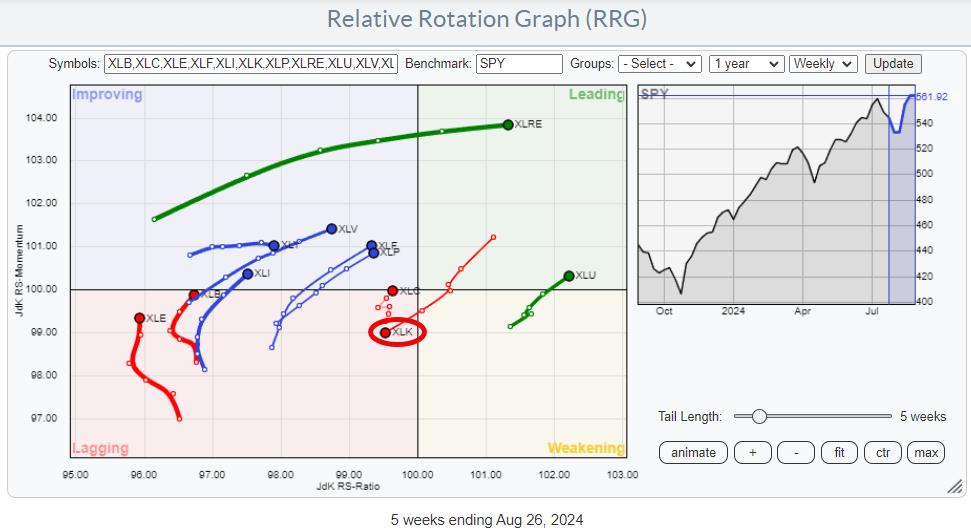
Tech Rallies, But Remains Inside the Lagging Quadrant
A quick look at the Relative Rotation Graph for...
READ MORE
MEMBERS ONLY
Stock Market Today: Are Big Tech Growth Stocks Back in the Spotlight?
by Jayanthi Gopalakrishnan,
Director of Site Content, StockCharts.com
KEY TAKEAWAYS
* Stocks rebounded on Wednesday with wide trading ranges.
* Investors are rotating back into large-cap growth and momentum stocks.
* The Financial sector was hit hard by negative news from banks but made some recovery.
It was a massive turnaround day in the market on Wednesday—stocks sold off after...
READ MORE
MEMBERS ONLY

Pinpoint Strong Sectors BEFORE The Masses Notice
by Joe Rabil,
President, Rabil Stock Research
In this exclusive StockCharts TV video, Joe discusses why he is a bottom-up technical analyst. He explains the difference between top-down and bottom-up analysis and uses this to show the strongest sectors rotating to the upside right now; this approach will help give advance notice of which areas to focus...
READ MORE
MEMBERS ONLY
Stock Market Today: Real Estate and Tech Lead, Energy Down
by Jayanthi Gopalakrishnan,
Director of Site Content, StockCharts.com
KEY TAKEAWAYS
* The real estate sector gains ground as interest rate cuts loom.
* Technology stocks are showing slight gains, but not enough to shift momentum.
* Energy prices slide lower on weakened demand.
The Real Estate sector took the lead in Tuesday's trading, probably because interest rate cuts are...
READ MORE
MEMBERS ONLY

Biotech's Big Comeback: Why Investors are Eyeing This Beaten-Down Sector
by Karl Montevirgen,
The StockCharts Insider
KEY TAKEAWAYS
* With Fed rate cuts now widely anticipated, investors are looking to the biotech industry for potential investment opportunities.
* Biotech, a highly-speculative industry, has declined sharply since 2020 as inflation, along with higher interest rates, set in.
* You can spot green shoots of capital flowing into biotech; watch the...
READ MORE
MEMBERS ONLY
Broad-Based Stock Market Selloff: How to Position Your Portfolio?
by Jayanthi Gopalakrishnan,
Director of Site Content, StockCharts.com
KEY TAKEAWAYS
* Broader stock market indexes sell off as investors fear rate cuts may be too late.
* Treasury yields fell to their lowest yearly levels.
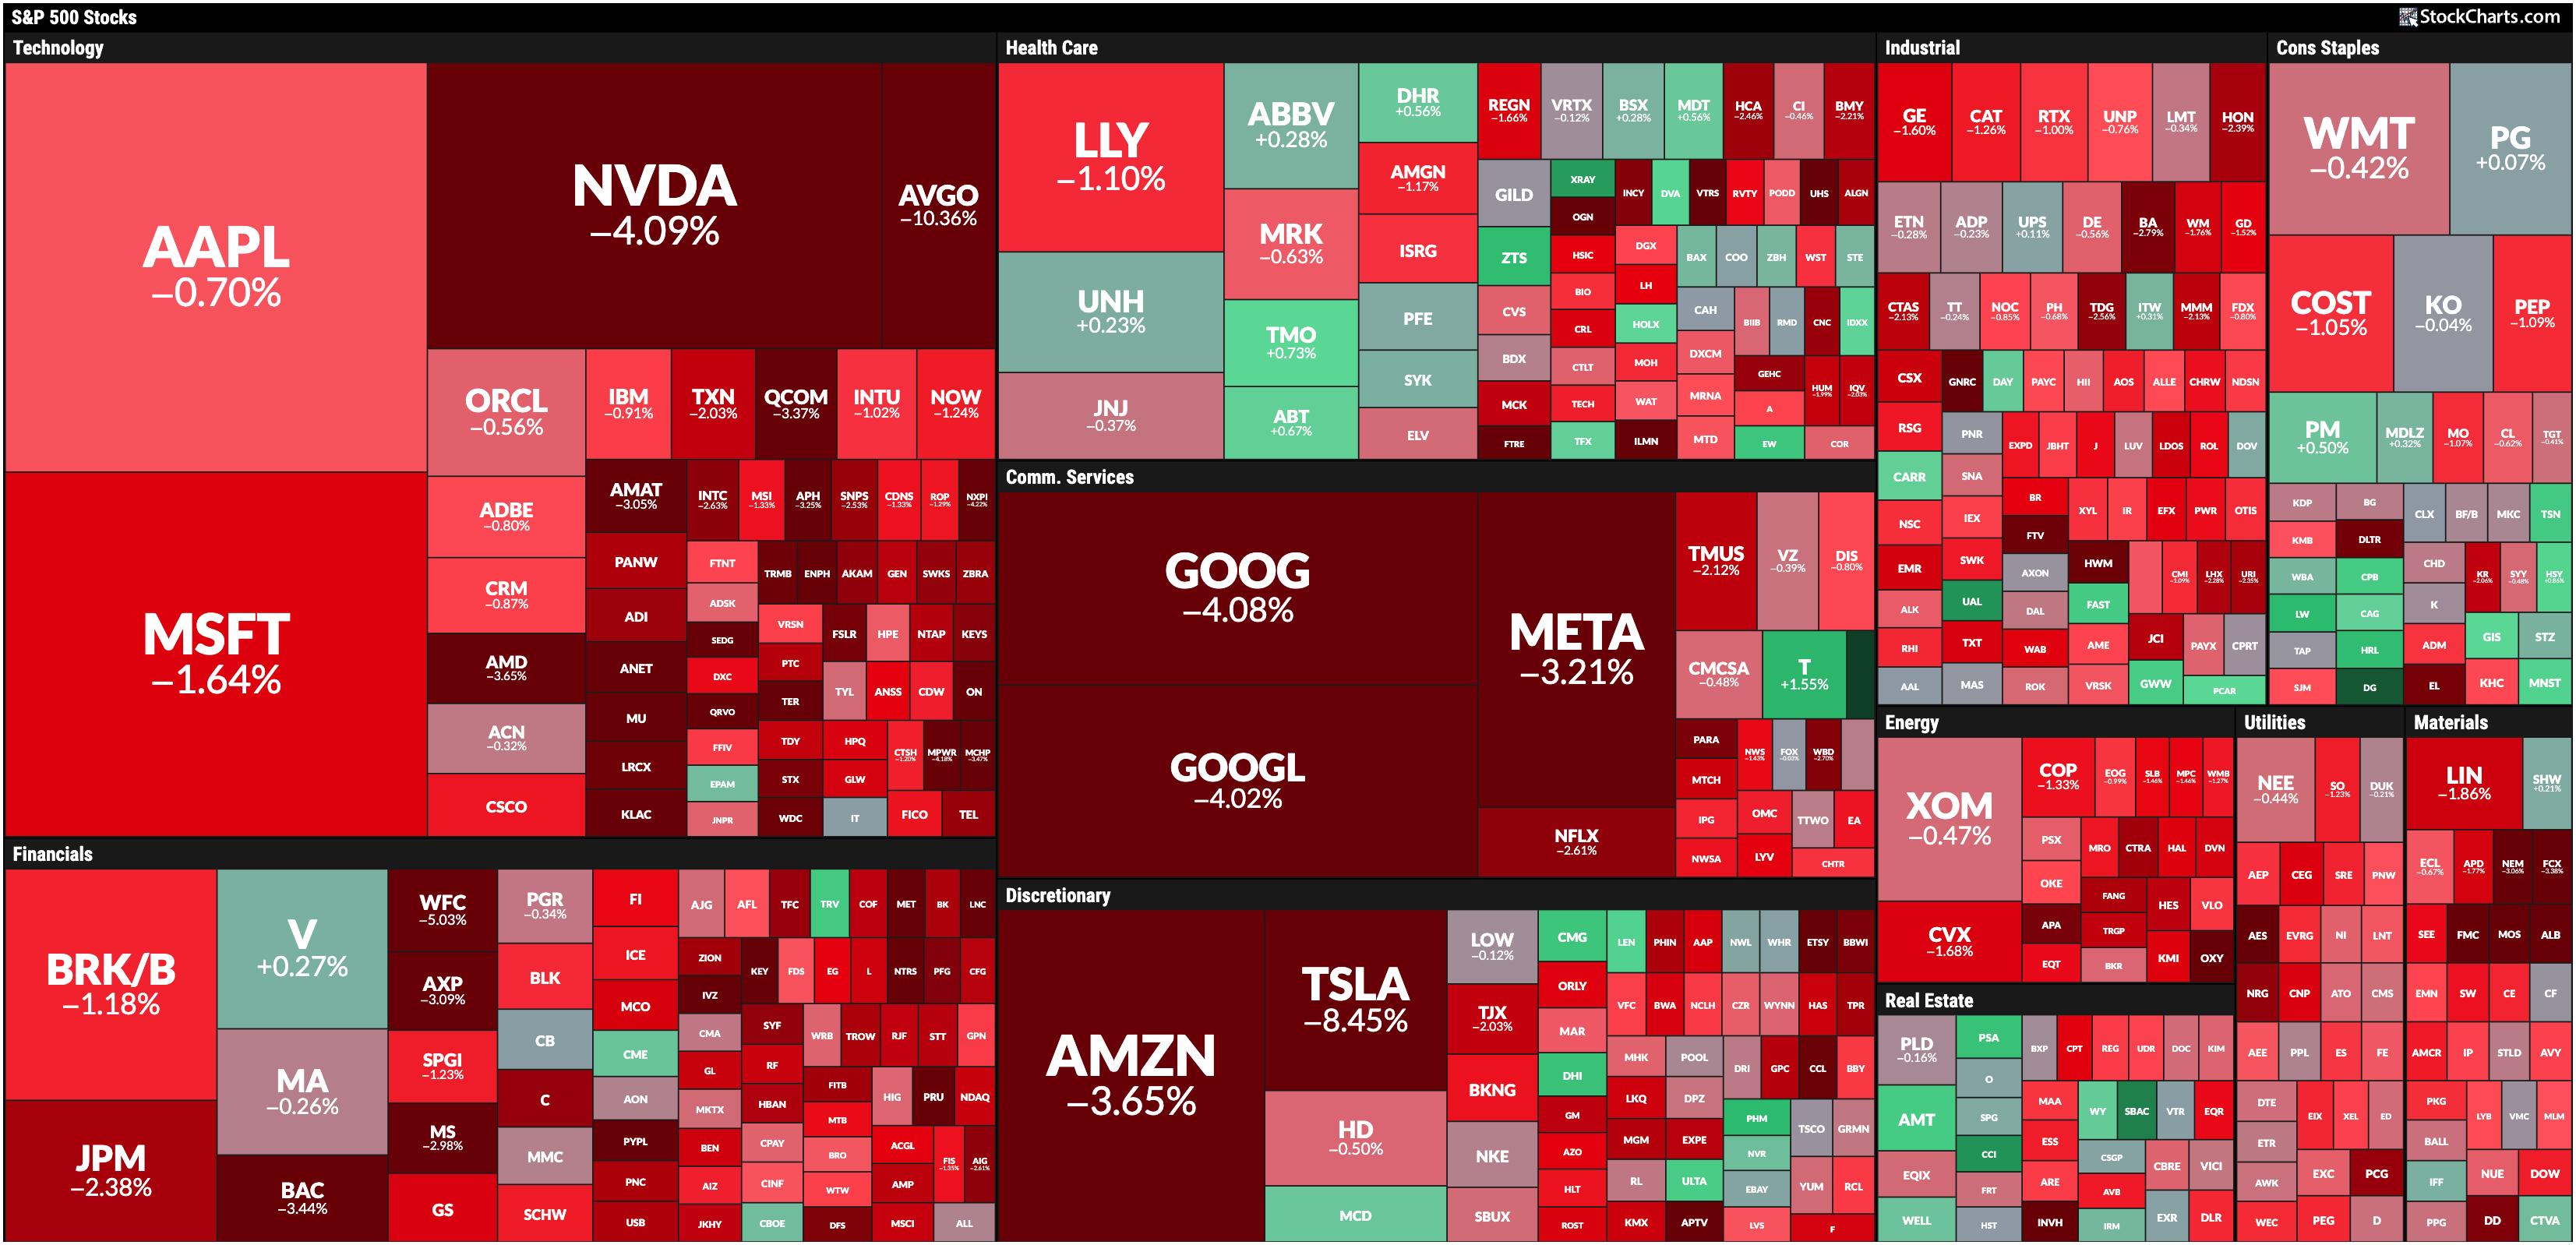
* Big Tech stocks got hammered, with semiconductor stocks getting hit the hardest.
After a week of wavering action, the stock market made a directional move—...
READ MORE
MEMBERS ONLY
How to Spot a Golden Mining Opportunity Using SCTR Reports
by Karl Montevirgen,
The StockCharts Insider
KEY TAKEAWAYS
* The SCTR Report highlighted two gold miner ETFs, indicating that the industry is seeing positive movement.
* A deeper dive into gold miner ETFs uncovers problems and opportunities.
* The ZigZag line applied to the chart of GDX helps identify entry and exit levels.
On Thursday afternoon, I dove into...
READ MORE
MEMBERS ONLY

It all Started with a Big Bang!
by Arthur Hill,
Chief Technical Strategist, TrendInvestorPro.com
KEY TAKEAWAYS
* Extended uptrends often start with a bang, a big bang.
* Chartists can find big bangs by measuring price moves in ATR terms.
* Paypal broke a major resistance level with a 5+ ATR advance in August.
Extended trends often start with big bangs and major breakouts. Chartists can identify...
READ MORE
MEMBERS ONLY

Should You Buy the Dip in NVDA?
by Mary Ellen McGonagle,
President, MEM Investment Research
In this StockCharts TV video, Mary Ellen reviews the broader markets, including NASDAQ weakness, and the outperformance in the equal-weighted S&P 500. She examines NVDA and shares how you should trade the stock depending on your investment horizon. Last up, Mary Ellen reveals top stocks in leadership areas....
READ MORE
MEMBERS ONLY
What Would a Top in Semiconductors Mean for the S&P 500?

by David Keller,
President and Chief Strategist, Sierra Alpha Research
KEY TAKEAWAYS
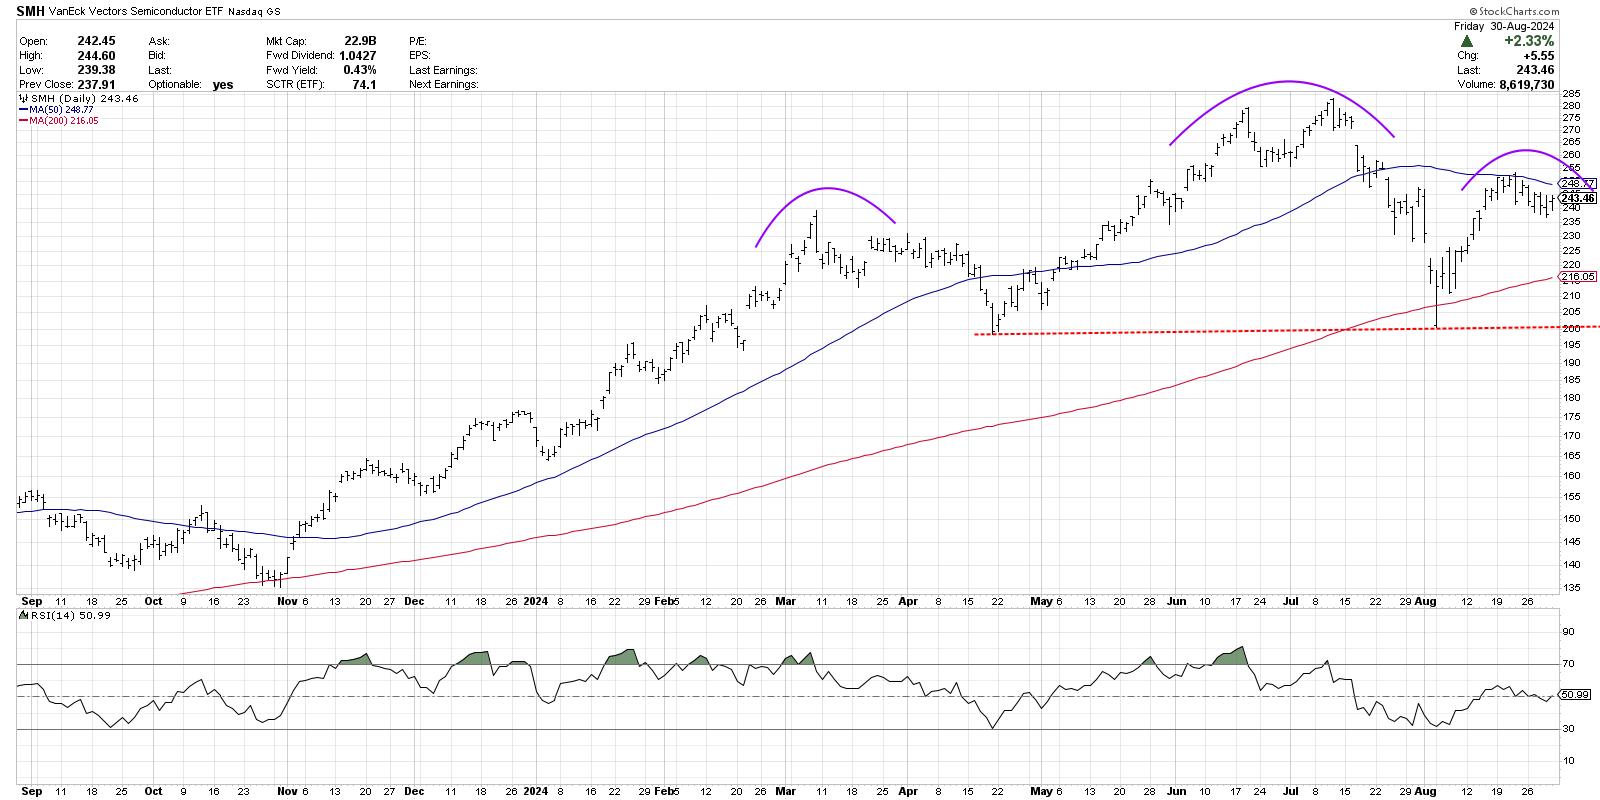
* A head-and-shoulders top pattern has to complete three phases before it can be considered valid.
* Even if semiconductors would complete this bearish price pattern, strength in other sectors suggests limited impact on the broader equity space.
After Nvidia (NVDA) dropped after earnings this week, investors are once again...
READ MORE
MEMBERS ONLY
Charting Forward: Opportunities You Can Seize in September
by Jayanthi Gopalakrishnan,
Director of Site Content, StockCharts.com
KEY TAKEAWAYS
* Stocks close higher on Friday with volatility remaining low.
* September is typically a weak month for equities.
* Energy and Utilities tend to perform better in September.
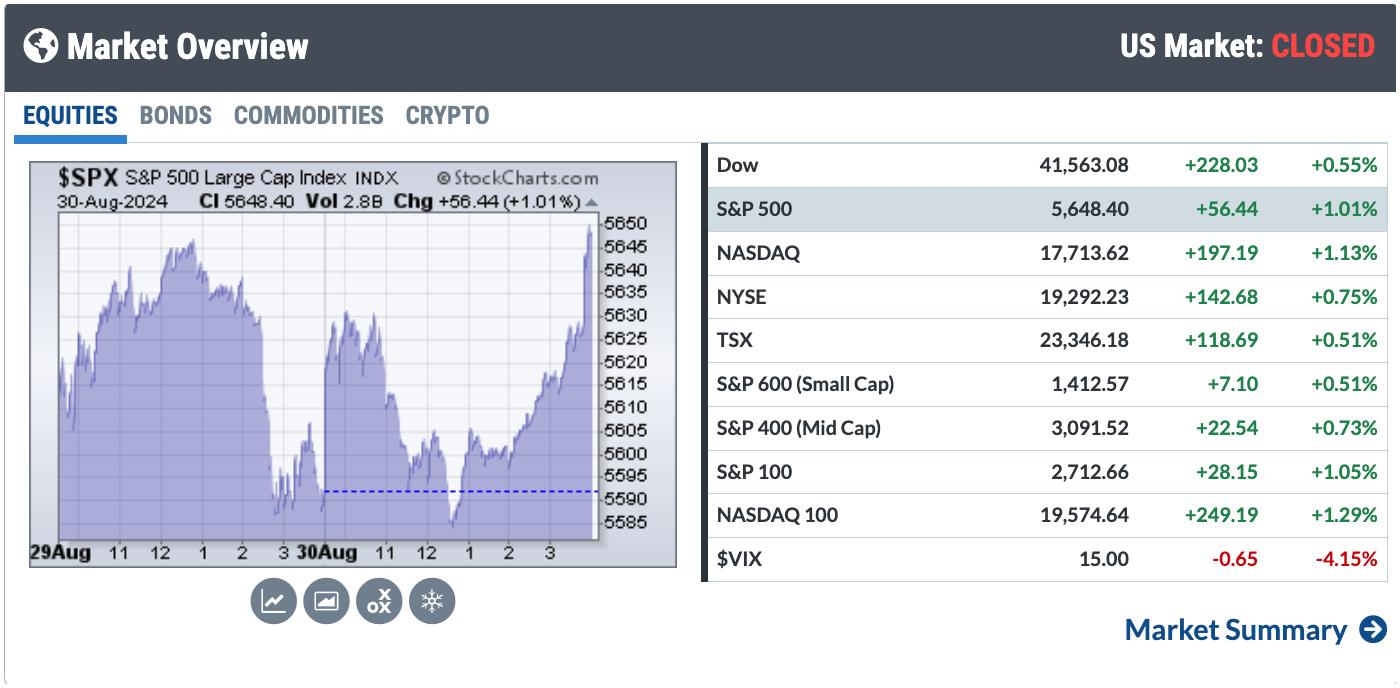
It's a quiet end to August, with the broader stock market indexes wavering higher and lower. The Market Overview panel...
READ MORE
MEMBERS ONLY

New Highs, But Danger Looms—Is XLF Heading for a Big Fall?
by Karl Montevirgen,
The StockCharts Insider
KEY TAKEAWAYS
* Financials typically struggle in September, but tend to rally in Q4.
* XLF has broken into all-time high territory, but its momentum is fading.
* If XLF dips in September, it could present a buying opportunity.
Financial sector stocks are at an all-time high, fueled partly by earnings beats, a...
READ MORE
MEMBERS ONLY
NVDA is Not the Only Semiconductor Stock Out There
by Julius de Kempenaer,
Senior Technical Analyst, StockCharts.com
KEY TAKEAWAYS
* SPY is pushing against resistance.
* The technology sector is out of favor, and semiconductors are a drag for it.
* NVDA is big, but it is not the only semiconductor stock.
It's All Still Relative
The weekly Relative Rotation Graph, as it looks toward the close of...
READ MORE
MEMBERS ONLY
NVDA Earnings Miss, Yet Dow Powers Higher
by David Keller,
President and Chief Strategist, Sierra Alpha Research
In this edition of StockCharts TV'sThe Final Bar, Dave breaks down key sector leadership themes and why growth stocks like Nvidia continue to take a back seat to value-oriented sectors. He speaks to the inverted yield curve, performance of the equal-weighted S&P 500 vs. the Magnificent...
READ MORE
MEMBERS ONLY
Stock Market Today: NVDA Reports, Tech Lags, Financials Take the Lead
by Jayanthi Gopalakrishnan,
Director of Site Content, StockCharts.com
KEY TAKEAWAYS
* The leading sector today was the Financials, followed by Health Care and Utilities.
* Technology stocks sold off significantly and was the worst sector performer.
* With interest rate cuts expected in the next FOMC meeting, financial stocks have the potential to rise further.
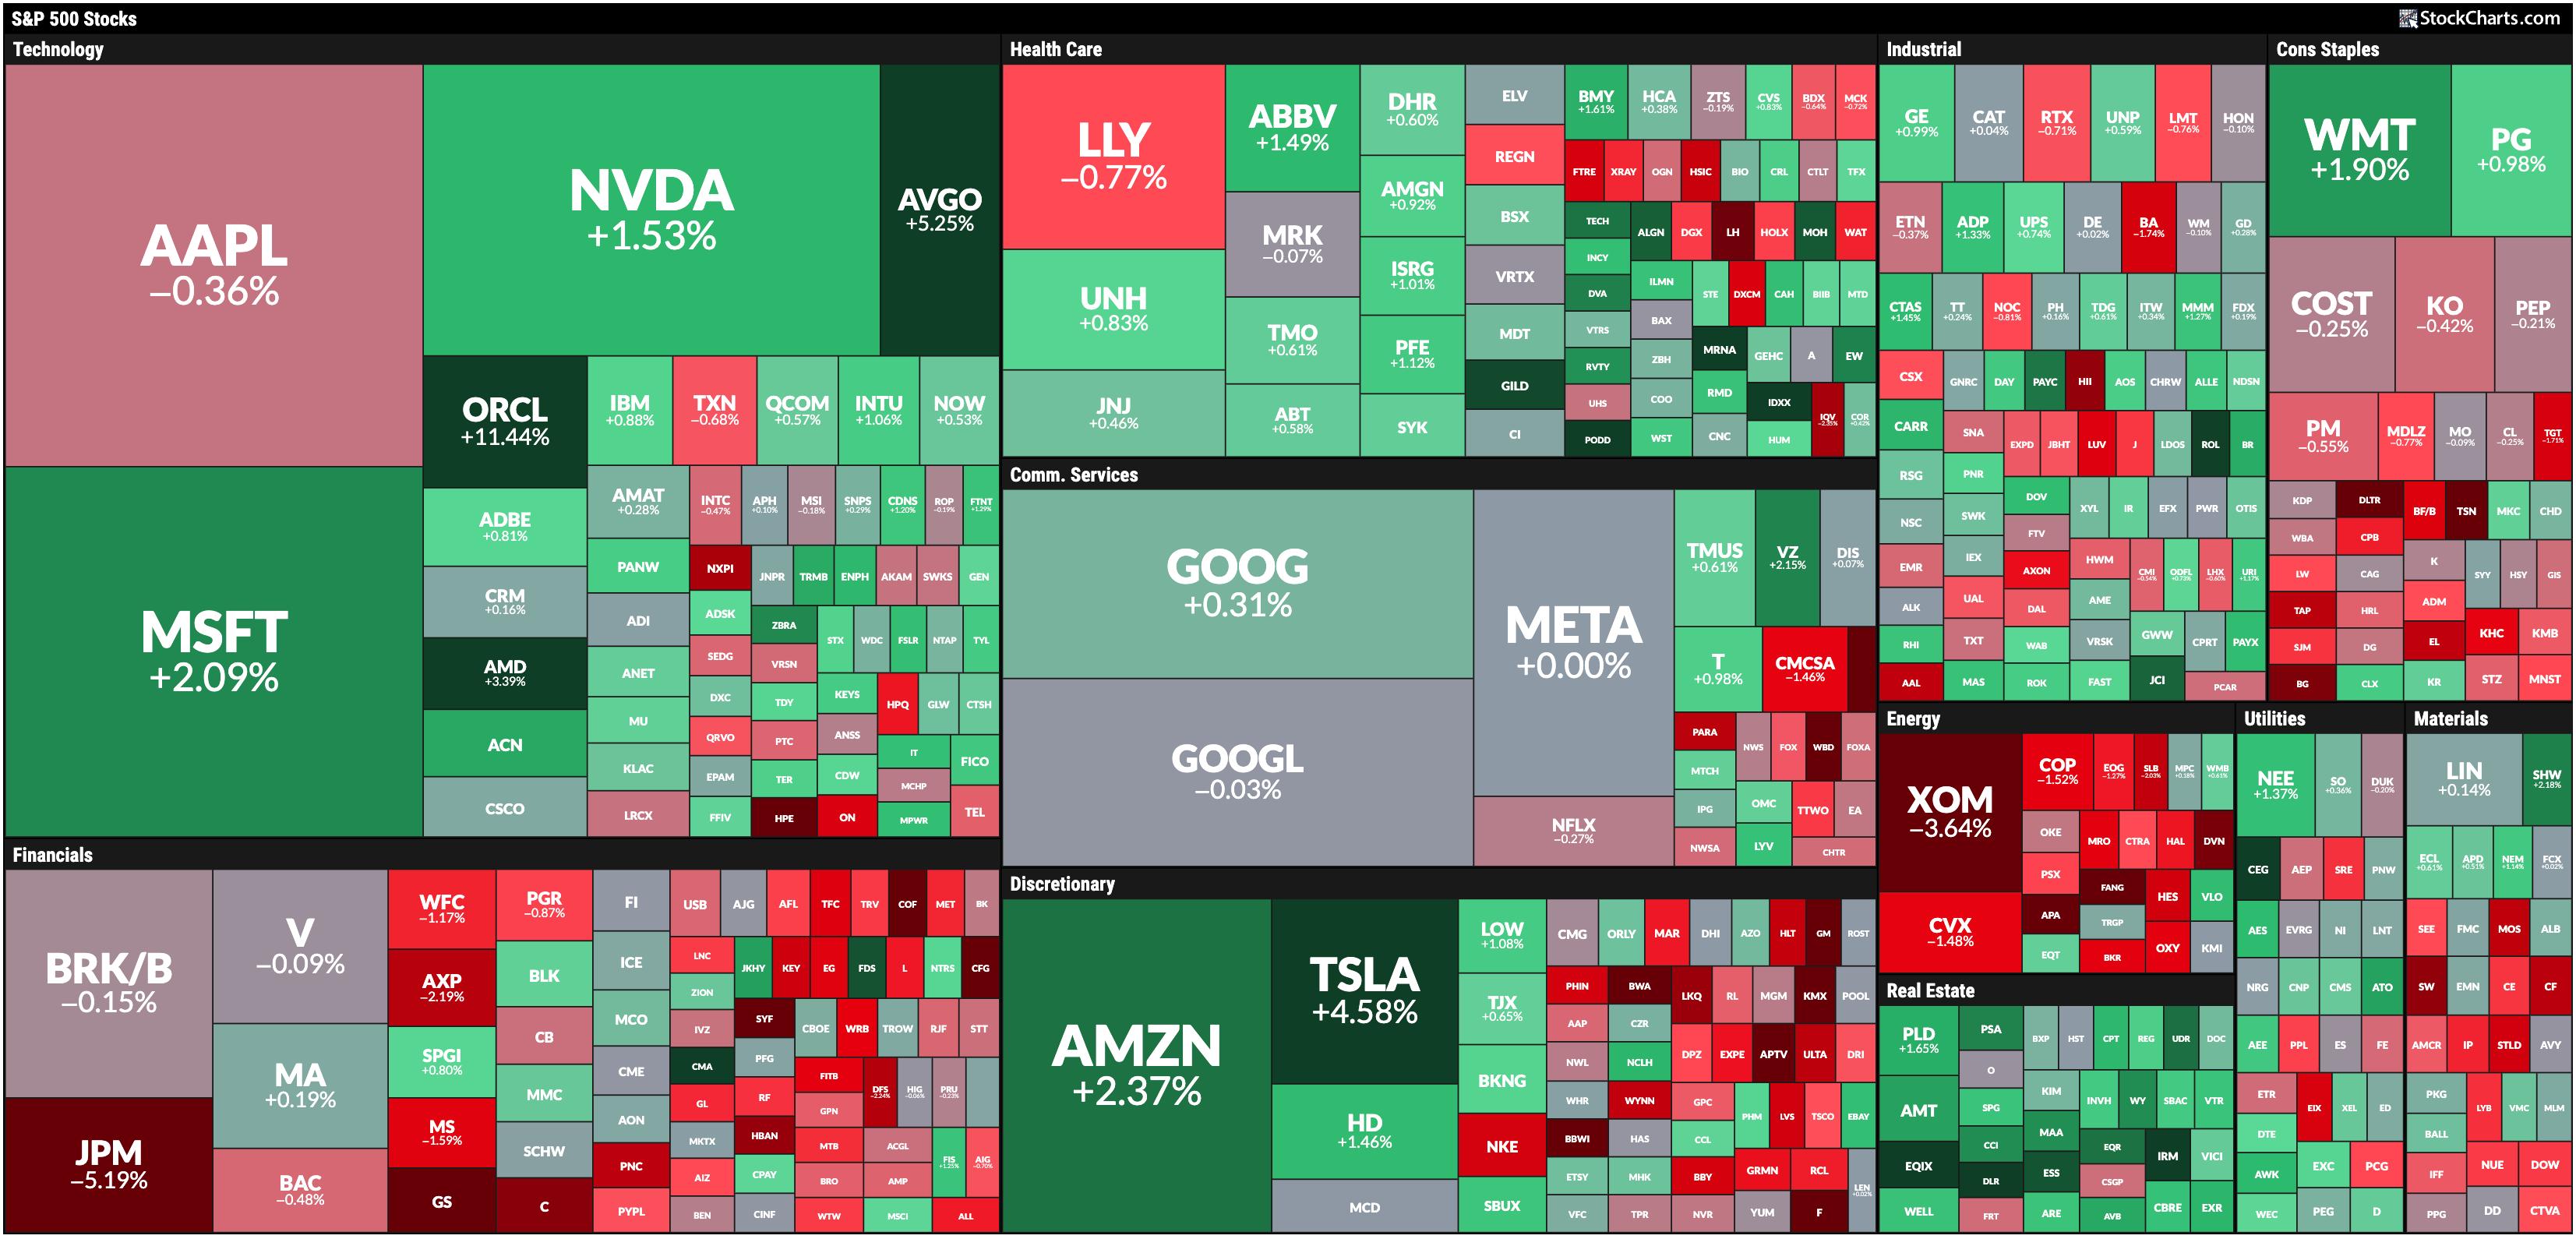
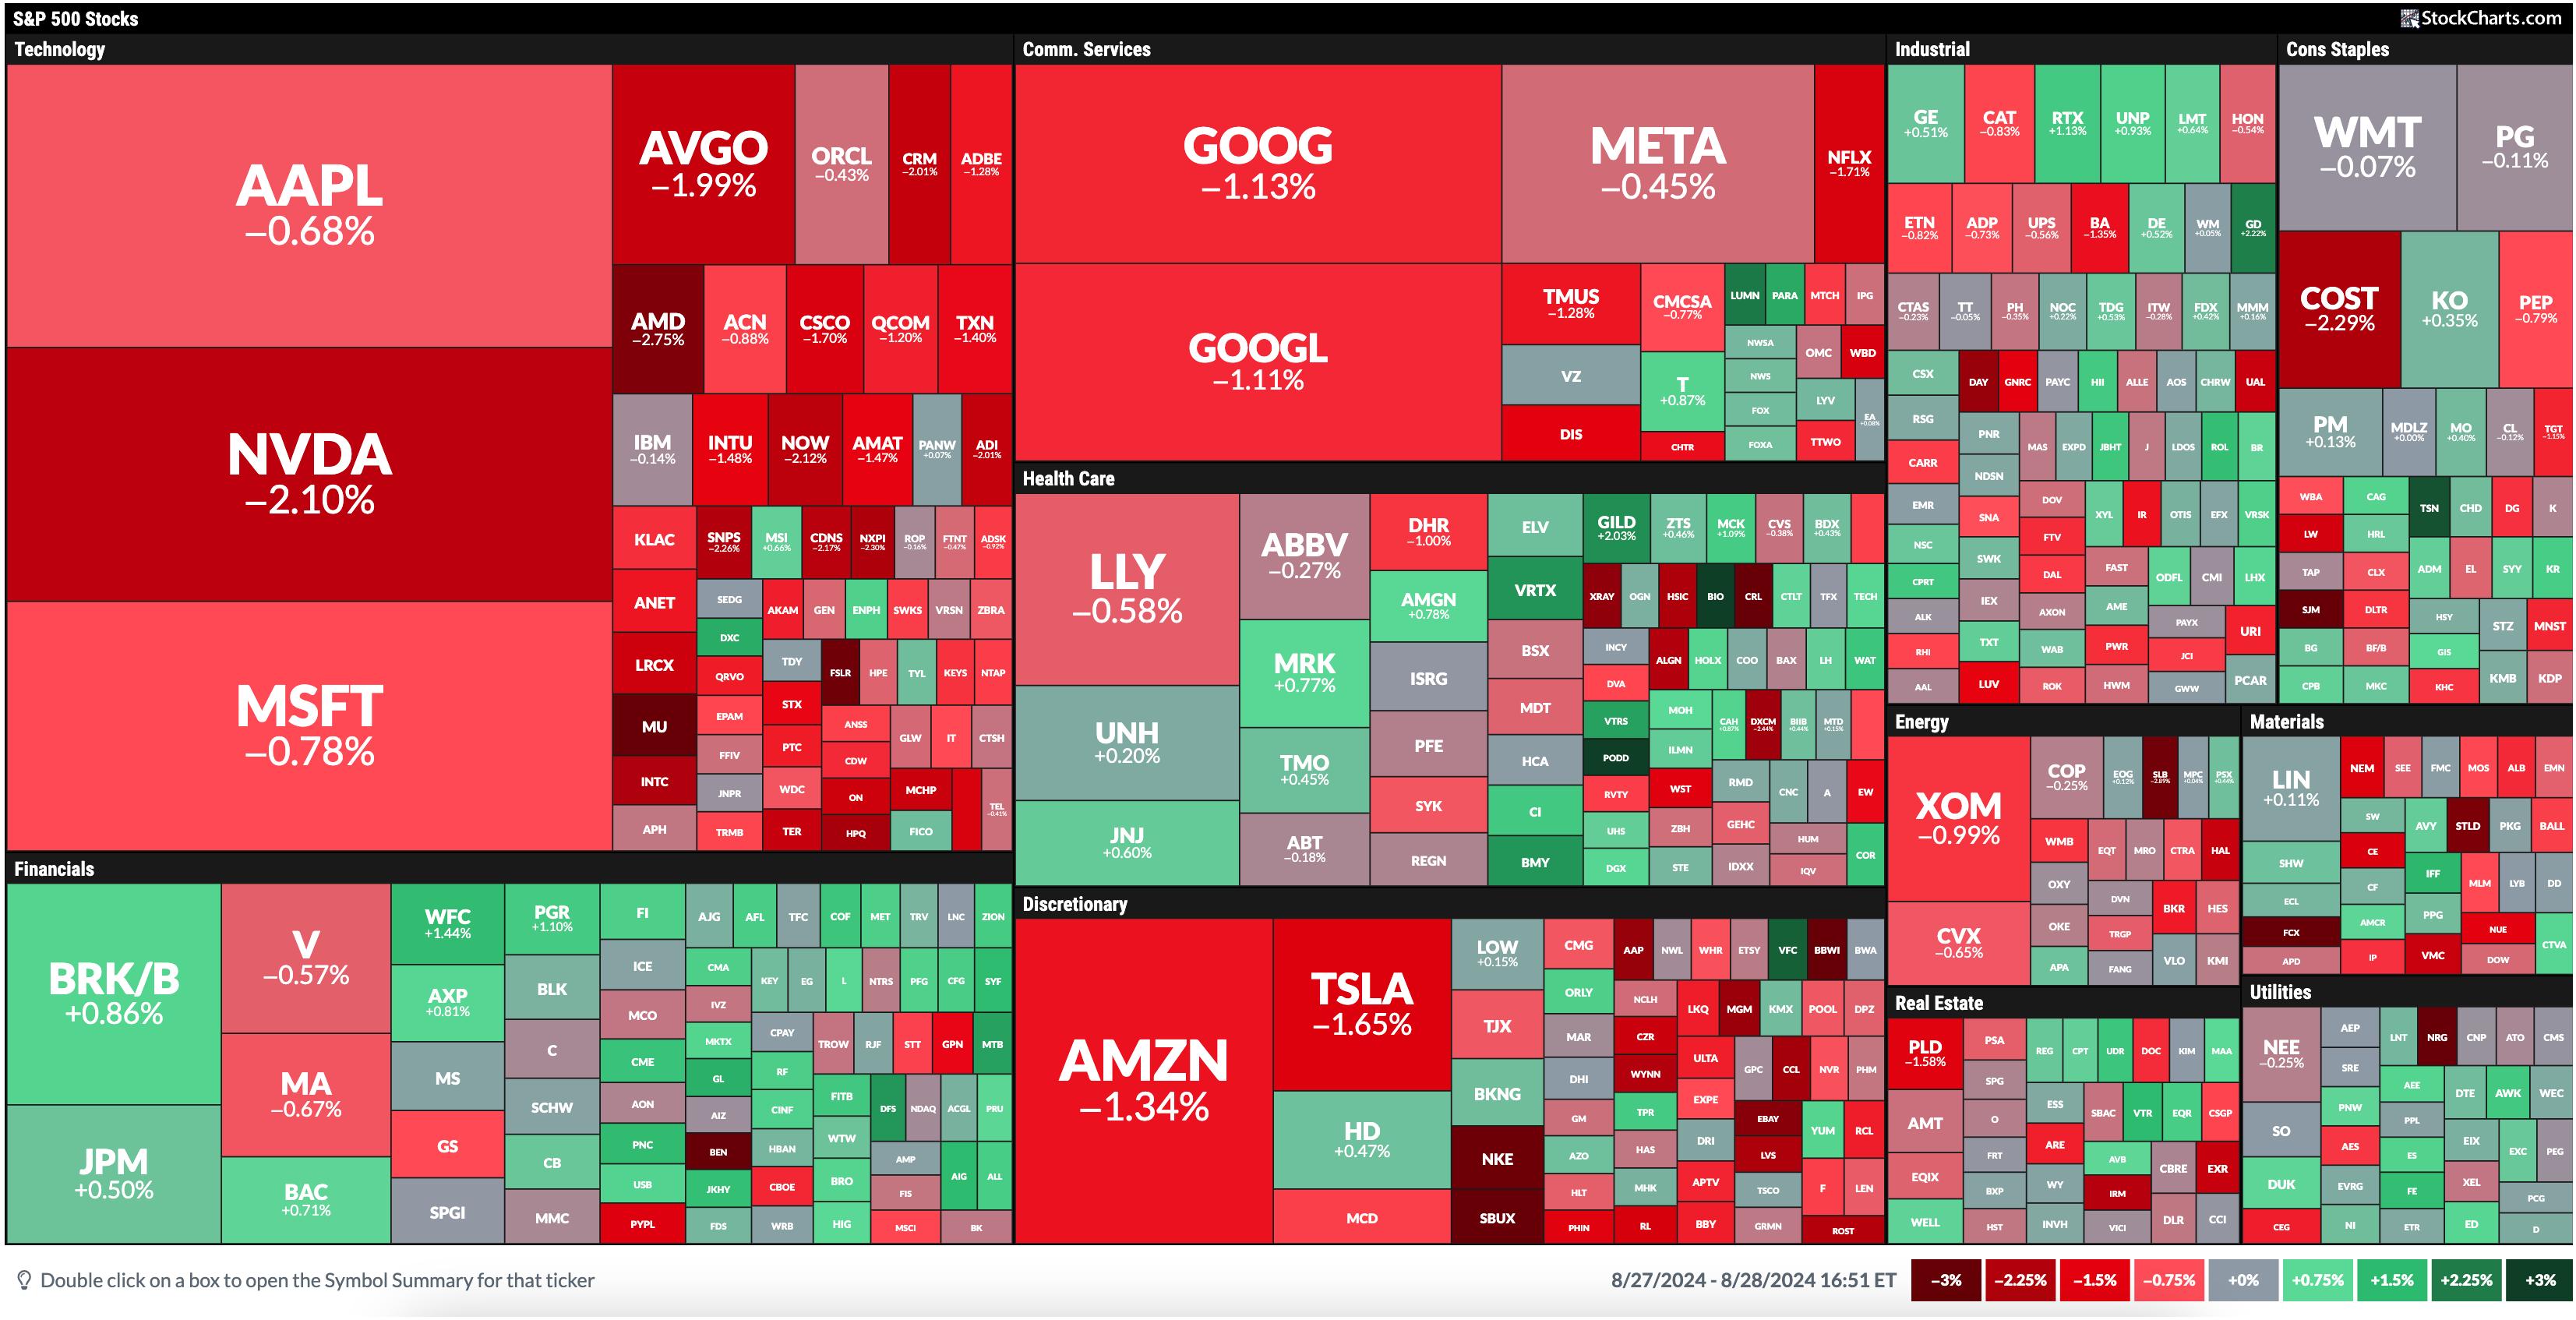
Today's MarketCarpet was a...
READ MORE
MEMBERS ONLY

Earnings Provide Another Nail in the Retail Coffin
by David Keller,
President and Chief Strategist, Sierra Alpha Research
In this edition of StockCharts TV'sThe Final Bar, Dave recaps a brutal day for retailers as ANF, FL, and BBWI drop on earnings misses. He also highlights the bullish primary trend for hold, shares two breakout names in the consumer staples sector, and breaks down key names in...
READ MORE
MEMBERS ONLY

Three Technology Stocks in Make or Break Scenarios
by David Keller,
President and Chief Strategist, Sierra Alpha Research
In this edition of StockCharts TV'sThe Final Bar, Dave focuses in on three key charts to watch in the technology sector as investors anxiously await NVDA earnings and Friday's inflation data. He also shares two important charts for tracking improving market breadth conditions and highlights the...
READ MORE
MEMBERS ONLY
Stock Market Today: Two Sectors That Can Make Sizable Moves
by Jayanthi Gopalakrishnan,
Director of Site Content, StockCharts.com
KEY TAKEAWAYS
* Financial and Technology sectors were the leaders.
* With NVDA reporting earnings, tech stocks, especially semiconductors, could steal the spotlight again.
* With interest rate cuts on the horizon, financial stocks could see increased momentum.
Have you ever been in a plane that keeps circling around, waiting to land? That&...
READ MORE