MEMBERS ONLY

Is Aflac Set to Surpass Analysts' Targets? Find Out Now!

by Karl Montevirgen,
The StockCharts Insider
KEY TAKEAWAYS
* Aflac stock soars, hitting a new all-time high
* Indicators suggest the stock is strong and could continue rising
* Aflac has the potential to outperform the S&P 500, the Financial sector, and the insurance industry
Boring and captivating rarely coexist, except for contrarians who can uncover the...
READ MORE
MEMBERS ONLY

Textbook Double Top on Silver (SLV)

by Erin Swenlin,
Vice President, DecisionPoint.com
Gold is struggling, moving mostly sideways. Silver has technically been moving sideways as well, only it has formed a textbook double top chart pattern. Textbook double tops show even tops and a clear confirmation line delineated at the middle of the "M" formation. What is good about these...
READ MORE
MEMBERS ONLY

S&P 500 Sinks on Software and Semiconductor SELLOFF

by David Keller,
President and Chief Strategist, Sierra Alpha Research
In this edition of StockCharts TV'sThe Final Bar, Dave welcomes Jonathan Krinsky, CMT of BTIG. Jonathan speaks to the weakness in market breadth conditions and the software group as a key space to watch for relative strength weakness. David breaks down the relationship between the S&P...
READ MORE
MEMBERS ONLY

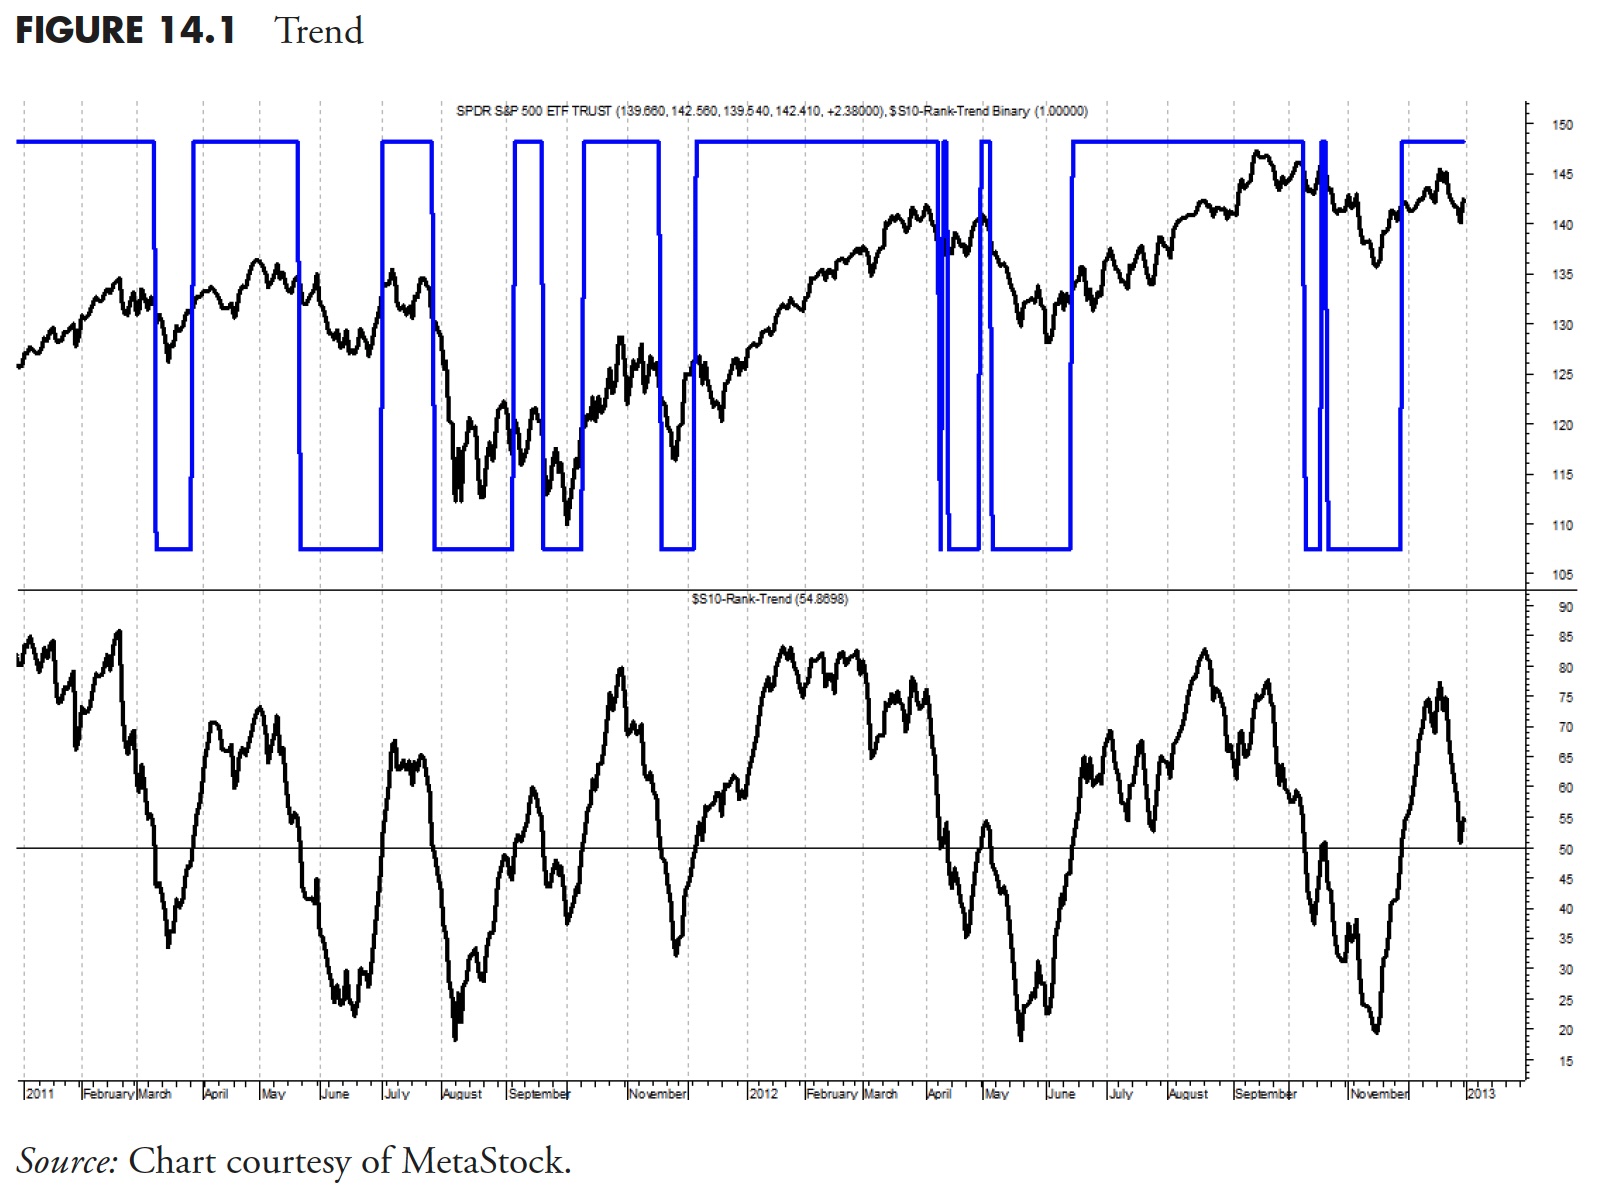
Rules-Based Money Management - Part 7: The "Dancing with the Trend" Model

by Greg Morris,
Veteran Technical Analyst, Investor, and Author
Note to the reader: This is the twenty-third in a series of articles I'm publishing here taken from my book, "Investing with the Trend." Hopefully, you will find this content useful. Market myths are generally perpetuated by repetition, misleading symbolic connections, and the complete ignorance of...
READ MORE
MEMBERS ONLY

Failed Bearish Patterns are Bullish for S&P 500!
by David Keller,
President and Chief Strategist, Sierra Alpha Research
In this edition of StockCharts TV'sThe Final Bar, Dave welcomes Frank Cappelleri, CMT CFA of CappThesis. Frank shares how the bull market phase has been marked by confirmed and completed bullish patterns and failed breakdowns after bearish patterns. Meanwhile, Dave discusses the rising interest rate environment, what it...
READ MORE
MEMBERS ONLY

This MUST SEE MACD Pattern is a Game Changer

by Joe Rabil,
President, Rabil Stock Research
On this week's edition of Stock Talk with Joe Rabil, Joe shows a specific MACD pattern that, when it develops on the monthly chart, can give a great early warning sign. Joe gives several examples of this pattern during the lesson. He also shows two Scans that he...
READ MORE
MEMBERS ONLY

Market Analysis: Top Stock Picks and Sector Insights

by Milan Vaishnav,
Founder and Technical Analyst, EquityResearch.asia and ChartWizard.ae
As we approach the highly anticipated results of India's general elections on Tuesday, June 4, market volatility is expected to be at its peak. Exit polls, scheduled for Saturday, June 1, will likely add to the market's uncertainty, causing significant fluctuations in the Nifty and BankNifty...
READ MORE
MEMBERS ONLY
What Happens to GOOGL When This Negative Divergence Executes

by Julius de Kempenaer,
Senior Technical Analyst, StockCharts.com
In this video from StockCharts TV,Julius takes a look at the differences in rotation between cap-weighted and equal-weighted sectors and sees a warning signal for GOOGL. He also examines the Communications Sector vs. the Equal-Weighted ETF.
This video was originally broadcast on May 28, 2024. Click anywhere on the...
READ MORE
MEMBERS ONLY

This Simple Little Option Is A HUGE Productivity Booster

by Grayson Roze,
Chief Strategist, StockCharts.com
On this week's edition of StockCharts TV'sStockCharts in Focus, Grayson shows you how to boost your charting workflow with the "Inspect" tool. These powerful little crosshairs pack a punch, with hidden features that let you measure in multiple directions, track price and percent changes...
READ MORE
MEMBERS ONLY

Technical Indicator Showdown: MACD vs. PPO vs. PMO
by David Keller,
President and Chief Strategist, Sierra Alpha Research
In this edition of StockCharts TV'sThe Final Bar, Dave answers viewer questions from The Final Bar Mailbag. He outlines the differences between the MACD, PPO, and PMO indicators, covers the mechanics of corporate buybacks, examines the basics of candlestick analysis, and discusses whether applying trendline analysis to the...
READ MORE
MEMBERS ONLY

Stock Market Ends Week on Optimistic Note, With a Few Surprises

by Jayanthi Gopalakrishnan,
Director of Site Content, StockCharts.com
KEY TAKEAWAYS
* The stock market started out slow, sold off, and then recovered some of those losses to end the week on an optimistic note.
* Market internals continue to be strong indicating that the stock market has a bullish bias.
* Several stocks made new highs including NVDA, FSLR, and DELL....
READ MORE
MEMBERS ONLY

Surprise! These Grocery Stocks are Crushing 2024 Targets
by Karl Montevirgen,
The StockCharts Insider
KEY TAKEAWAYS
* Consumer Staples stocks offer stability and growth in a high inflation environment.
* Many consumer staples stocks have exceeded analyst price targets, revealing Wall Street's underestimation of their growth potential.
* Sometimes the next big stock is often found in a seemingly boring name, as Sprouts Farmers Market...
READ MORE
MEMBERS ONLY

Dow Theory Flashes Bear Signal
by David Keller,
President and Chief Strategist, Sierra Alpha Research
Dow Theory is based on the foundational work of Charles Dow, considered the "Father of Technical Analysis." Many of the tools we employ to better analyze market structure and investor sentiment, from trend analysis to index construction, are derived from Dow's original essays from the early...
READ MORE
MEMBERS ONLY

What Does Today's Outside Bars in the S&P and NASDAQ Mean Going Forward

by Martin Pring,
President, Pring Research
A couple of weeks ago, I wrote an upbeat article on the US stock market opining that the correction was over. I still think that's the case, but I do have to note that a bearish outside bar formed on both the S&P and NASDAQ on...
READ MORE
MEMBERS ONLY

S&P 500 Downside Target 4800?!
by David Keller,
President and Chief Strategist, Sierra Alpha Research
In this edition of StockCharts TV'sThe Final Bar, Dave welcomes Jeff Huge, CMT of JWH Investment Partners. David reflects on NVDA's gap higher, quick deterioration in market breadth indicators, and bearish candle patterns for ON and HOOD. Jeff shares his downside target for the S&...
READ MORE
MEMBERS ONLY

These Commodities are On Track for Mega Breakouts in May
by Martin Pring,
President, Pring Research
It's rare when you see a multi-year breakout take place, but, when several materialize more or less at the same time, that should really get our attention. That's not simply because of the opportunities being presented, but also because several simultaneous breakouts indicate a broader participation...
READ MORE
MEMBERS ONLY

Rules-Based Money Management - Part 6: Putting It All Together
by Greg Morris,
Veteran Technical Analyst, Investor, and Author
Note to the reader: This is the twenty-second in a series of articles I'm publishing here taken from my book, "Investing with the Trend." Hopefully, you will find this content useful. Market myths are generally perpetuated by repetition, misleading symbolic connections, and the complete ignorance of...
READ MORE
MEMBERS ONLY

Growth is Alive and Kicking for S&P 500
by David Keller,
President and Chief Strategist, Sierra Alpha Research
In this edition of StockCharts TV'sThe Final Bar, Dave welcomes Mike Singleton of Invictus Research. David highlights a bearish momentum divergence for gold, and also illustrates how mid-cap and small-cap stocks have yet to make new highs in Q2. Mike paints a bullish picture for stocks based on...
READ MORE
MEMBERS ONLY

These Sectors are Showing Strength as S&P 500 Soars!
by David Keller,
President and Chief Strategist, Sierra Alpha Research
In this edition of StockCharts TV'sThe Final Bar, Dave is joined by special guest Julius de Kempenaer of RRG Research. Dave hits on the out-performance of traditionally defensive sectors and breaks down the charts of FSLR, NVDA, and more. Julius, meanwhile, is cautiously optimistic as the equity indexes...
READ MORE
MEMBERS ONLY

Capitalizing on Riot Platforms' Potential: A Sleeper Stock Ready to Soar?
by Karl Montevirgen,
The StockCharts Insider
KEY TAKEAWAYS
* RIOT may be a beaten-down stock, but it has potential to rise higher
* A breakout above key the $12.65 price range on momentum could mean the stock price would move higher
* A potential resistance level is the $18.30 level
If you're not familiar, Riot...
READ MORE
MEMBERS ONLY

DP Trading Room: What's Up With Semiconductors?
by Erin Swenlin,
Vice President, DecisionPoint.com
Today Erin takes a deep dive into the Semiconductors (SMH). She goes over the "under the hood" health of the industry group and then takes us within the industry group to find the leadership stocks in that area.
Carl shares his wisdom on the current conditions of the...
READ MORE
MEMBERS ONLY
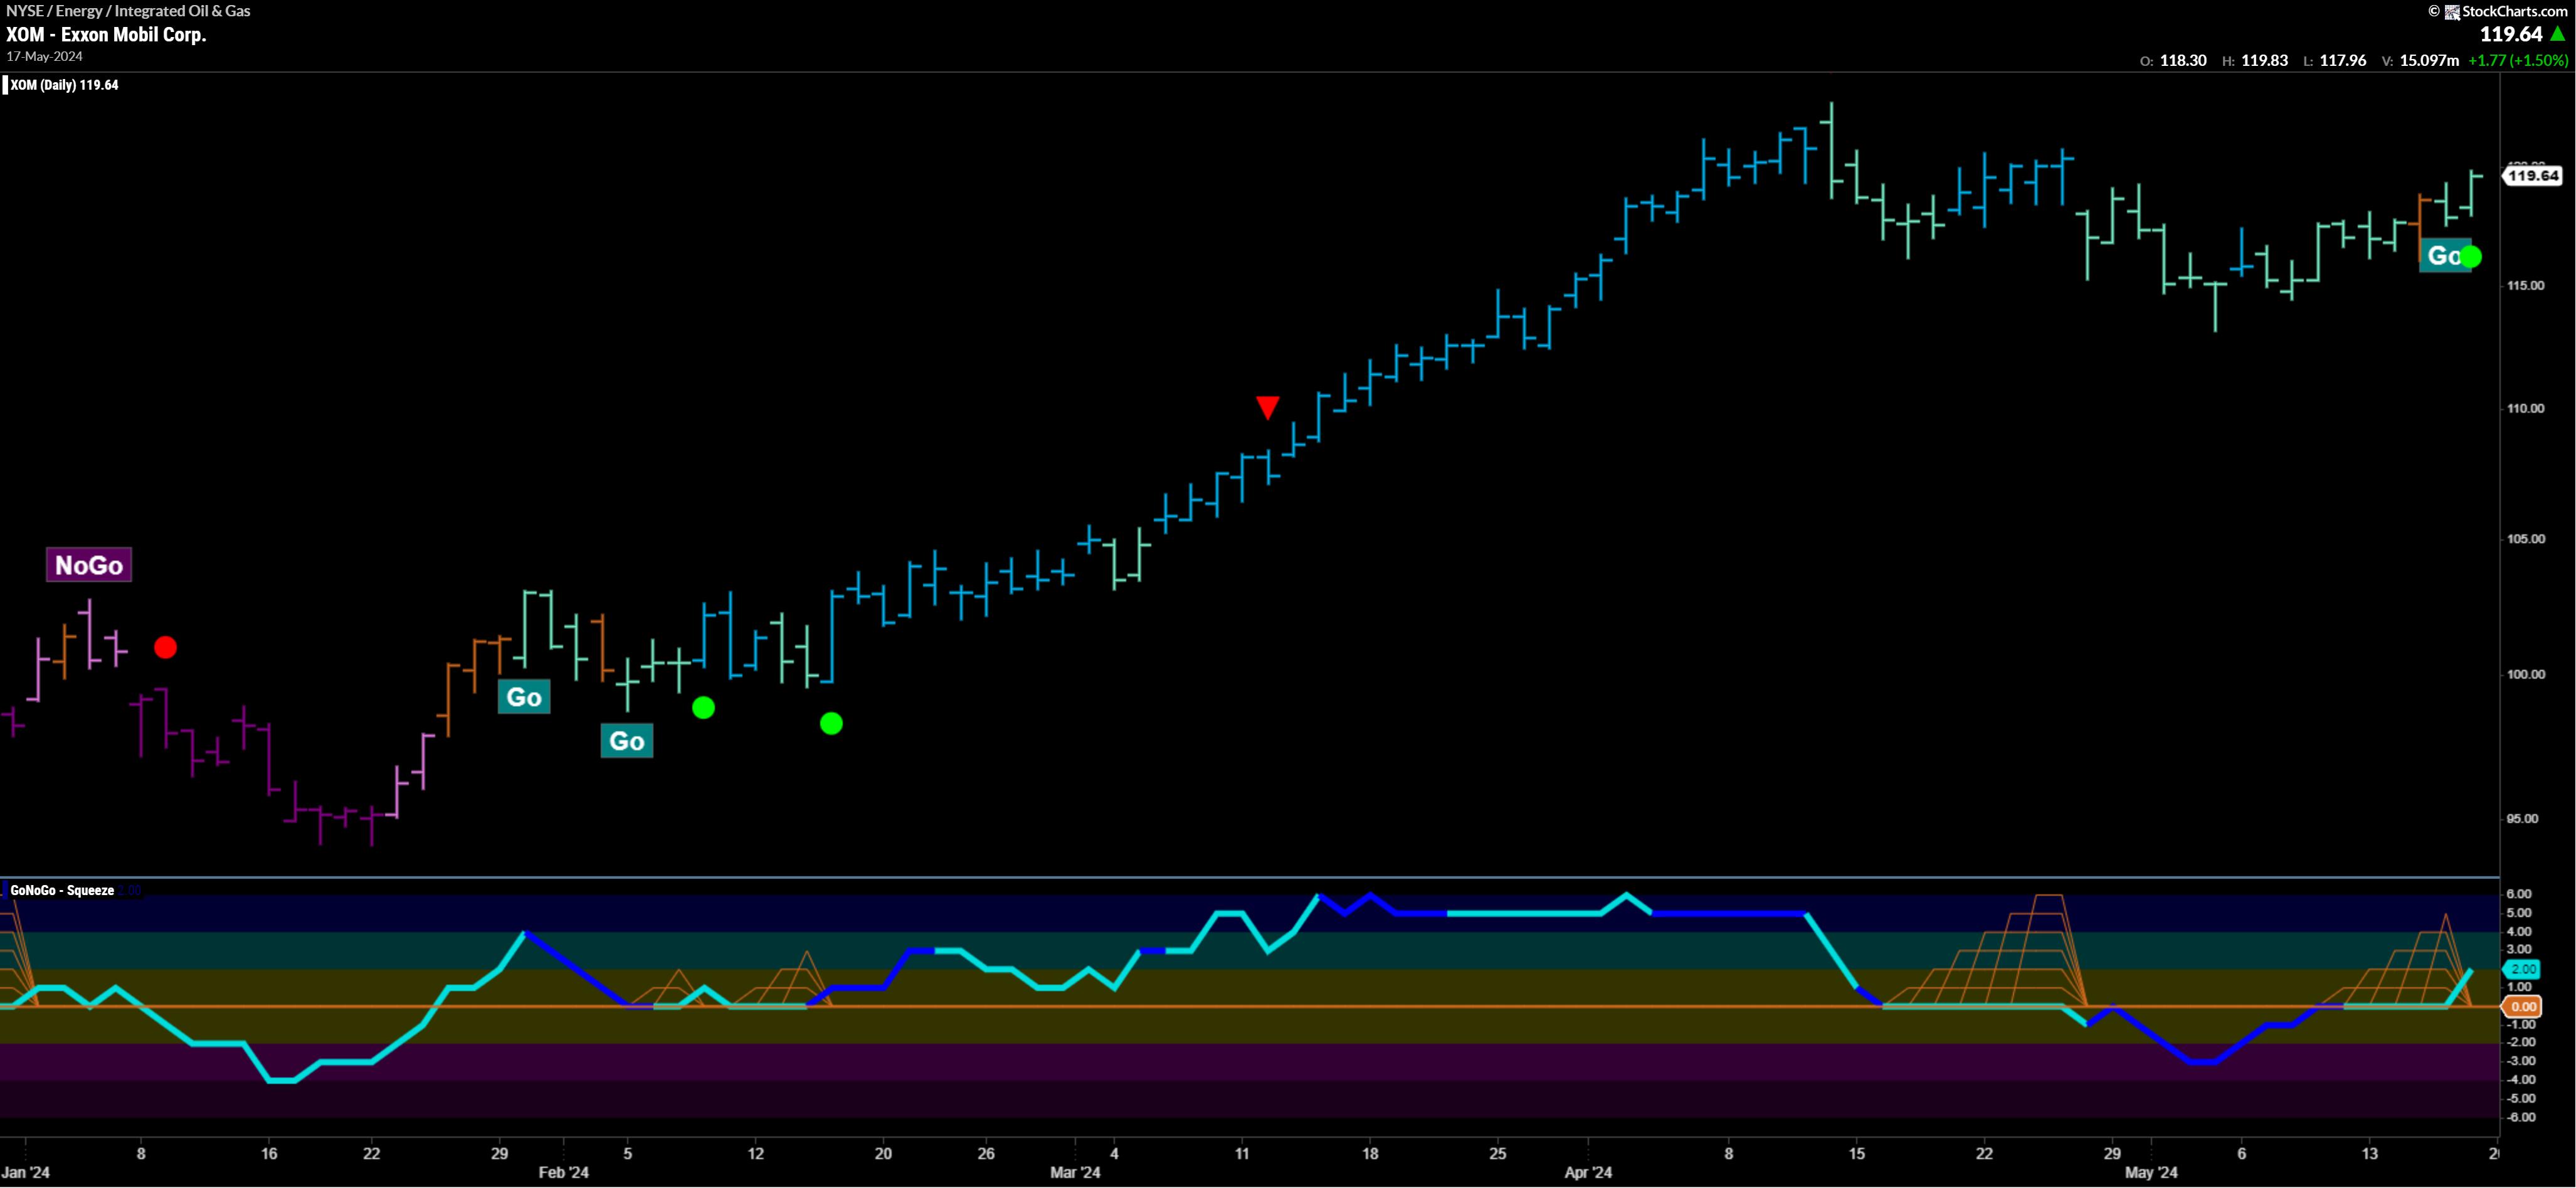
Top 5 Stocks in "Go" Trends | Fri May 17, 2024

by Tyler Wood,
Co-founder, GoNoGo Charts®
KEY TAKEAWAYS
* trend continuation
* breakouts
* Momentum Confirmation
* Bull Flags
Top 5 Stocks in "Go" Trends
Trend Continuation on Rising Momentum
GoNoGo Charts® highlight low-risk opportunities for trend participation with intuitive icons directly in the price action. The resurgence of momentum in the direction of the underlying price trend...
READ MORE
MEMBERS ONLY

The One Chart to Watch as S&P 500 Makes New All-Time Highs
by David Keller,
President and Chief Strategist, Sierra Alpha Research
As the S&P 500 and Nasdaq 100 have once again made new all-time highs, and the Dow Jones Industrial Average has briefly broken above the 40,000 level for the first time, how should we think about further upside for our equity benchmarks?
There are two general ways...
READ MORE
MEMBERS ONLY

TOP 10 Stock Picks for May 2024
by David Keller,
President and Chief Strategist, Sierra Alpha Research
In this edition of StockCharts TV'sThe Final Bar, join Dave and Grayson as they run through the top 10 charts to watch in May 2024! They'll cover breakout strategies, moving average techniques, relative strength, and much more. You don't want to miss these insights...
READ MORE
MEMBERS ONLY

Gold and Silver Set to Smash Records: Could 2024 Be Their Biggest Year Yet?
by Karl Montevirgen,
The StockCharts Insider
KEY TAKEAWAYS
* Gold and silver are on the verge of breaking out toward record highs
* Gold and silver have reached most analyst price targets, but they could rise further
* From a technical perspective, gold and silver prices could smash above resistance levels
Gold is on the verge of breaking into...
READ MORE
MEMBERS ONLY
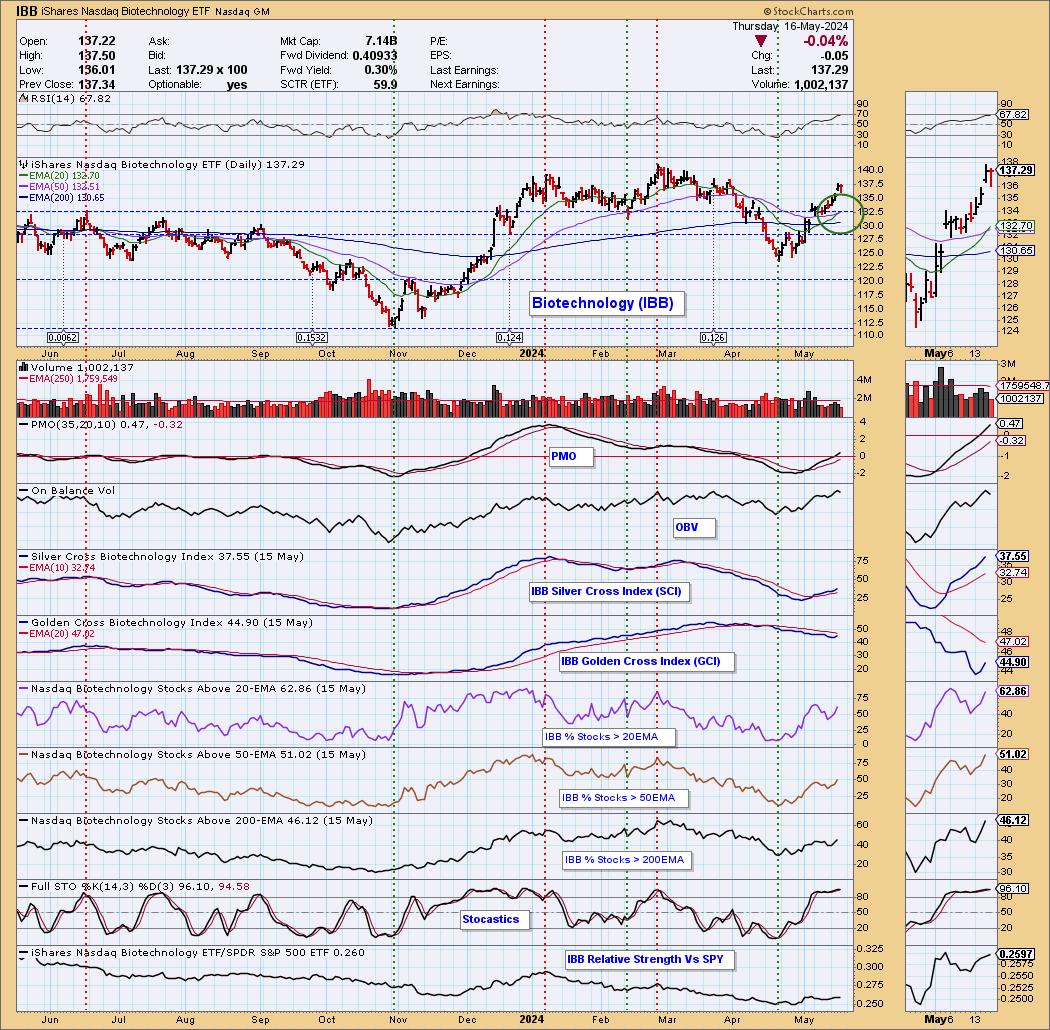
Biotechnology (IBB) Gets Silver Cross BUY Signal
by Erin Swenlin,
Vice President, DecisionPoint.com
Today, the Biotechnology ETF (IBB) 20-day EMA crossed up through the 50-day EMA (Silver Cross), generating an IT Trend Model BUY Signal. If we look "under the hood," we can see that participation continues to expand. The Silver Cross Index tells us how many stocks within this group...
READ MORE
MEMBERS ONLY

Larry's "Family Gathering" May 16, 2024 Recording

by Larry Williams,
Veteran Investor and Author
Certainty is needed for a trader's actions. Good judgment comes from experience, and experience is gained from poor judgment. The key to improving your trading is to really, truly study the losing trades.
In this month's Family Gathering video, Larry presents PPI numbers for historical buy...
READ MORE
MEMBERS ONLY

Rules-Based Money Management - Part 5: Security Selection, Rules, and Guidelines
by Greg Morris,
Veteran Technical Analyst, Investor, and Author
Note to the reader: This is the twenty-first in a series of articles I'm publishing here taken from my book, "Investing with the Trend." Hopefully, you will find this content useful. Market myths are generally perpetuated by repetition, misleading symbolic connections, and the complete ignorance of...
READ MORE
MEMBERS ONLY

Meme Stock Frenzy Back In the Spotlight: Are Traders Losing Patience?
by Jayanthi Gopalakrishnan,
Director of Site Content, StockCharts.com
KEY TAKEAWAYS
* Investors look like they're keeping their powder dry until key economic data is released this week
* The S&P 500, Dow Jones Industrial Average, and Nasdaq Composite are trading close to their highs, but are hesitant to reach it
* Meme stocks showed their might today,...
READ MORE
MEMBERS ONLY

Four Reasons Why Emerging Markets are Headed Higher
by Martin Pring,
President, Pring Research
Last February, I wrote an article on emerging markets, using the iShares MSCI Emerging Markets ETF (EEM) as my benchmark. I pointed out that this sector was close, but had not quite broken out to the upside. Now it has, and the outlook is favorable for at least a 4-6-month...
READ MORE
MEMBERS ONLY
Top 5 Stocks in "Go" Trends
by Tyler Wood,
Co-founder, GoNoGo Charts®
KEY TAKEAWAYS
* Trend Continuation
* Breakouts
* Bullish Flags
* Momentum Confirmation
Top 5 Stocks in "Go" Trends
Trend Continuation on Rising Momentum
GoNoGo Charts® highlight low-risk opportunities for trend participation with intuitive icons directly in the price action. The resurgence of momentum in the direction of the underlying price trend...
READ MORE
MEMBERS ONLY
Three Breadth Indicators to Confirm a Bullish Market Trend
by David Keller,
President and Chief Strategist, Sierra Alpha Research
There's no denying the strength the major averages have displayed off their April lows. The S&P 500 finished the week within a rounding error of the previous all-time high around 5250. What would it take for the SPX and NDX to power to new all-time highs...
READ MORE
MEMBERS ONLY

Relative Strength Screams Bullish for This Tech Stock
by David Keller,
President and Chief Strategist, Sierra Alpha Research
In this edition of StockCharts TV'sThe Final Bar, Dave uncovers strength in SQSP using the Stochastics Oscillator and the StochRSI indicator. He shares his favorite chart for analyzing relative strength ratios for leading stocks, and also answers viewer questions on price patterns for XLB and PYPL, plus best...
READ MORE
MEMBERS ONLY

Six Leaders, but One Is Getting Real Frothy

by Arthur Hill,
Chief Technical Strategist, TrendInvestorPro.com
KEY TAKEAWAYS
* Chartists can measure performance by comparing highs and lows
* Defense groups are leading SPY because they hit new highs already.
* XLU is looking frothy because it is over 13% above its 200-day SMA.
After sharp declines into mid April, stocks rebounded over the last three weeks and the...
READ MORE
MEMBERS ONLY
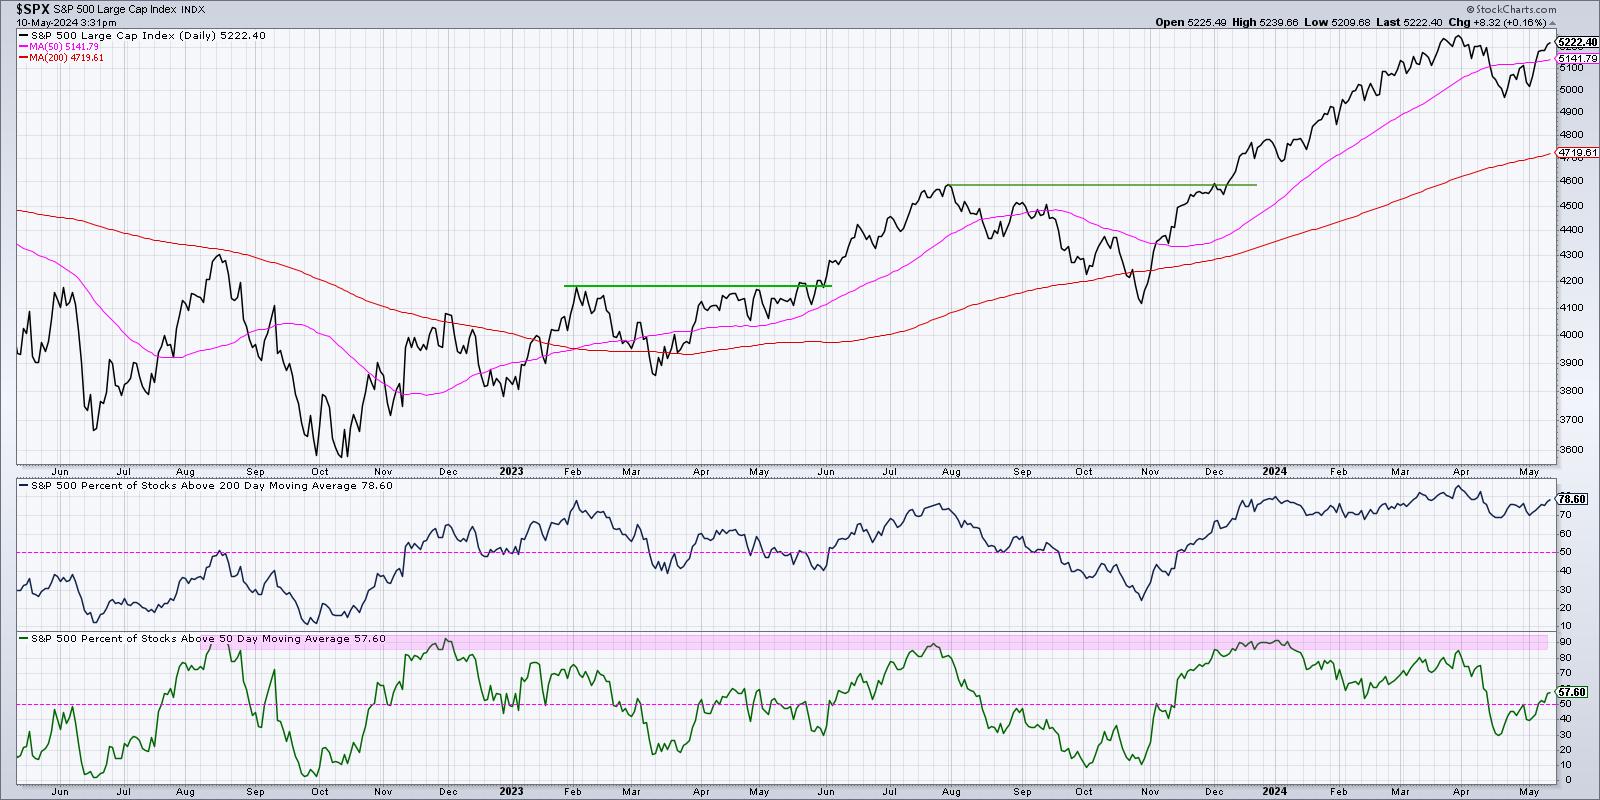
Stocks Pop Higher as Defensive Sectors Thrive
by David Keller,
President and Chief Strategist, Sierra Alpha Research
In this edition of StockCharts TV'sThe Final Bar, Dave breaks down an unusual day for stocks. The S&P 500 and Nasdaq closed higher, but the top sectors were defensive - real estate and utilities! He shares key levels to watch for NVDA, AAPL, TSLA, and more,...
READ MORE
MEMBERS ONLY
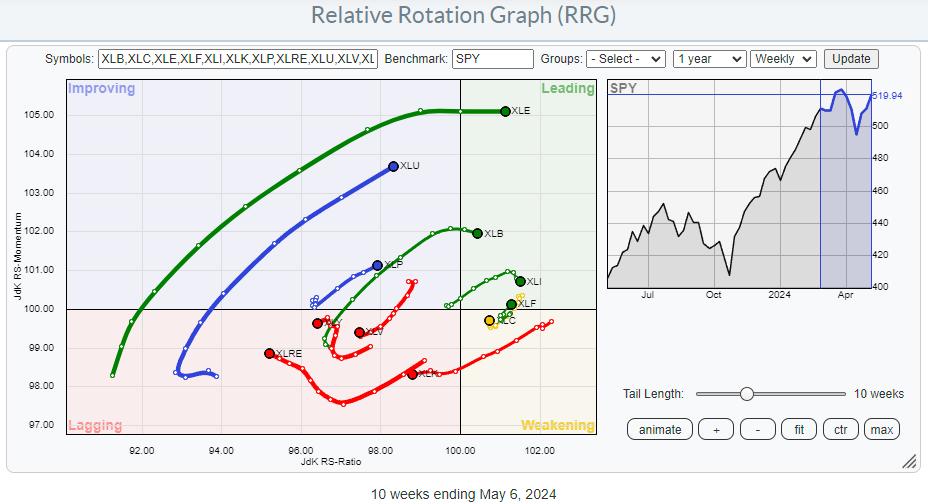
These Three Strong Financial Stocks Look Ready To Surge Higher
by Julius de Kempenaer,
Senior Technical Analyst, StockCharts.com
KEY TAKEAWAYS
* XLF on strong RRG-Heading, rotating back into leading quadrant
* XLF price approaching overhead resistance after short setback
* Three major financial stocks ready for upward breaks to lead the sector higher
The Relative Rotation Graph for US sectors shows long tails for XLE and XLU. Both are on a...
READ MORE
MEMBERS ONLY
Rules-Based Money Management - Part 4: Security Ranking Measures
by Greg Morris,
Veteran Technical Analyst, Investor, and Author
Note to the reader: This is the twentieth in a series of articles I'm publishing here taken from my book, "Investing with the Trend." Hopefully, you will find this content useful. Market myths are generally perpetuated by repetition, misleading symbolic connections, and the complete ignorance of...
READ MORE
MEMBERS ONLY
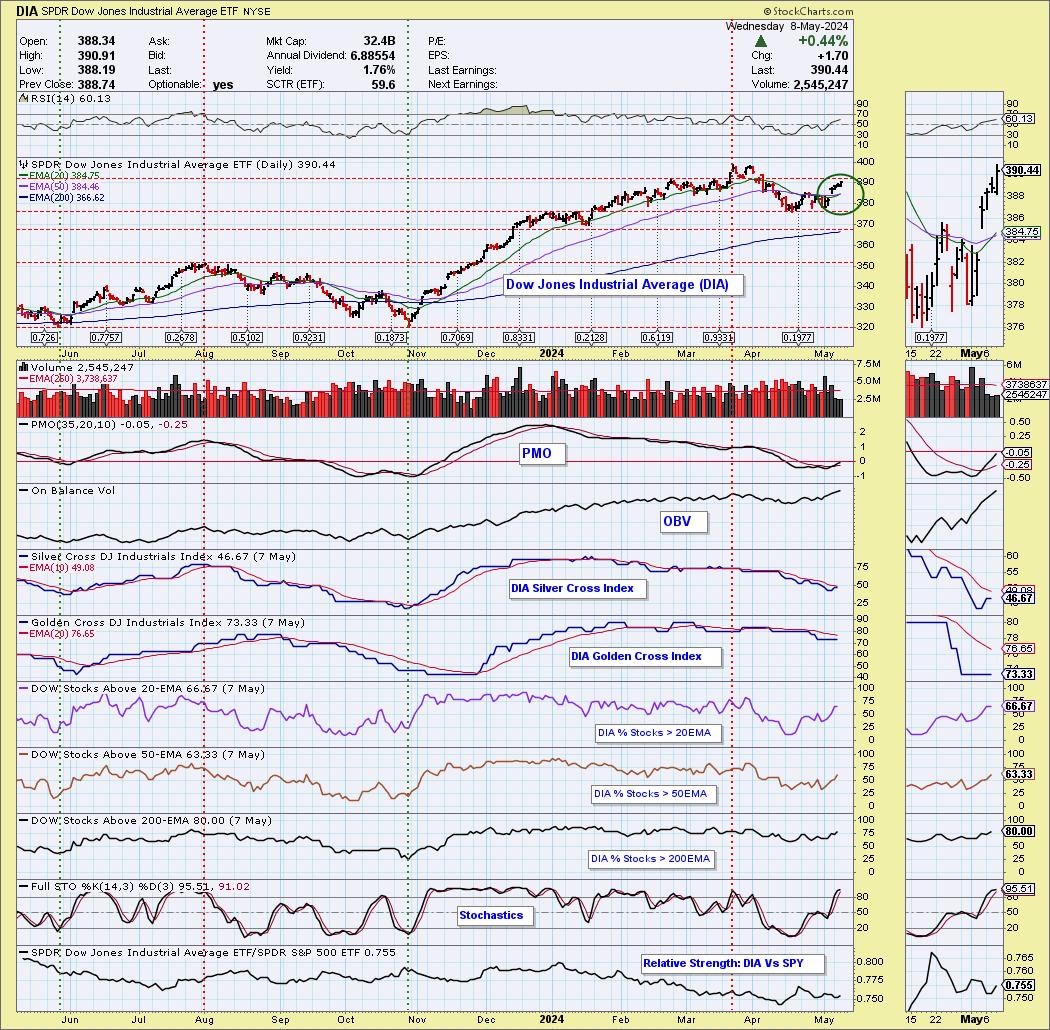
Silver Cross BUY Signals on the Dow (DIA) and Russell 2000 (IWM)
by Erin Swenlin,
Vice President, DecisionPoint.com
The Dow Jones Industrial Average ETF (DIA) 20-day EMA crossed up through the 50-day EMA (a Silver Cross), generating an IT Trend Model BUY Signal. The Dow saw a better rally today than the SPY, but, under the hood, it isn't quite as strong as the SPY. We...
READ MORE
MEMBERS ONLY
What Rising Volatility Means to the Current Market
by Joe Rabil,
President, Rabil Stock Research
On this week's edition of Stock Talk with Joe Rabil, Joe explains how he uses a rising volatility condition to signal increased risk. He then discusses what needs to take place to offer a nice trading opportunity, and shows how to adjust your approach when volatility is increasing....
READ MORE
MEMBERS ONLY
Is the S&P 500 Forming a Bear Flag Pattern?
by David Keller,
President and Chief Strategist, Sierra Alpha Research
In this edition of StockCharts TV'sThe Final Bar, Dave focuses in on price pattern analysis for the S&P 500, then reflects on the emergence of defensive sectors like consumer staples. He also recaps earnings movers, including DIS, SHOP, and more.
This video originally premiered on May...
READ MORE