MEMBERS ONLY
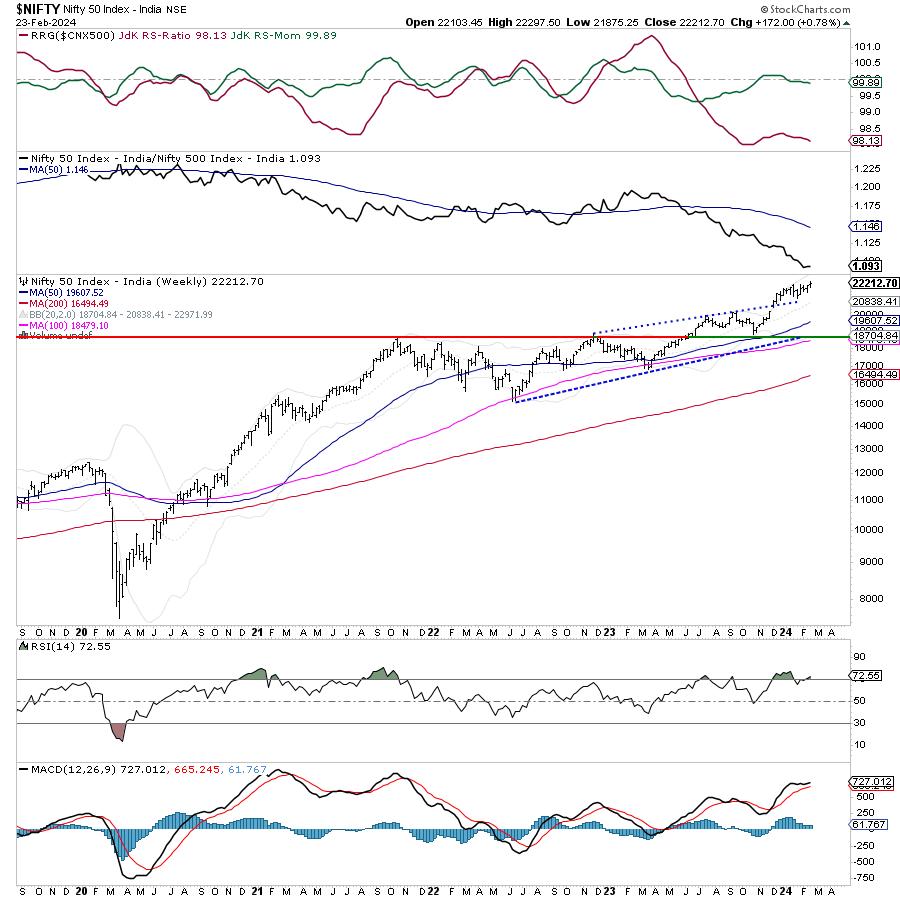
Week Ahead: NIFTY Likely to Continue Consolidating; Finding Relative Outperformance

by Milan Vaishnav,
Founder and Technical Analyst, EquityResearch.asia and ChartWizard.ae
In the previous technical note, it was categorically mentioned that, while the overall trend may stay intact, the markets could continue to largely consolidate. In line with the analysis, the markets kept consolidating, staying in a broad but defined trading range. That range, over the past week, was 422 points;...
READ MORE
MEMBERS ONLY
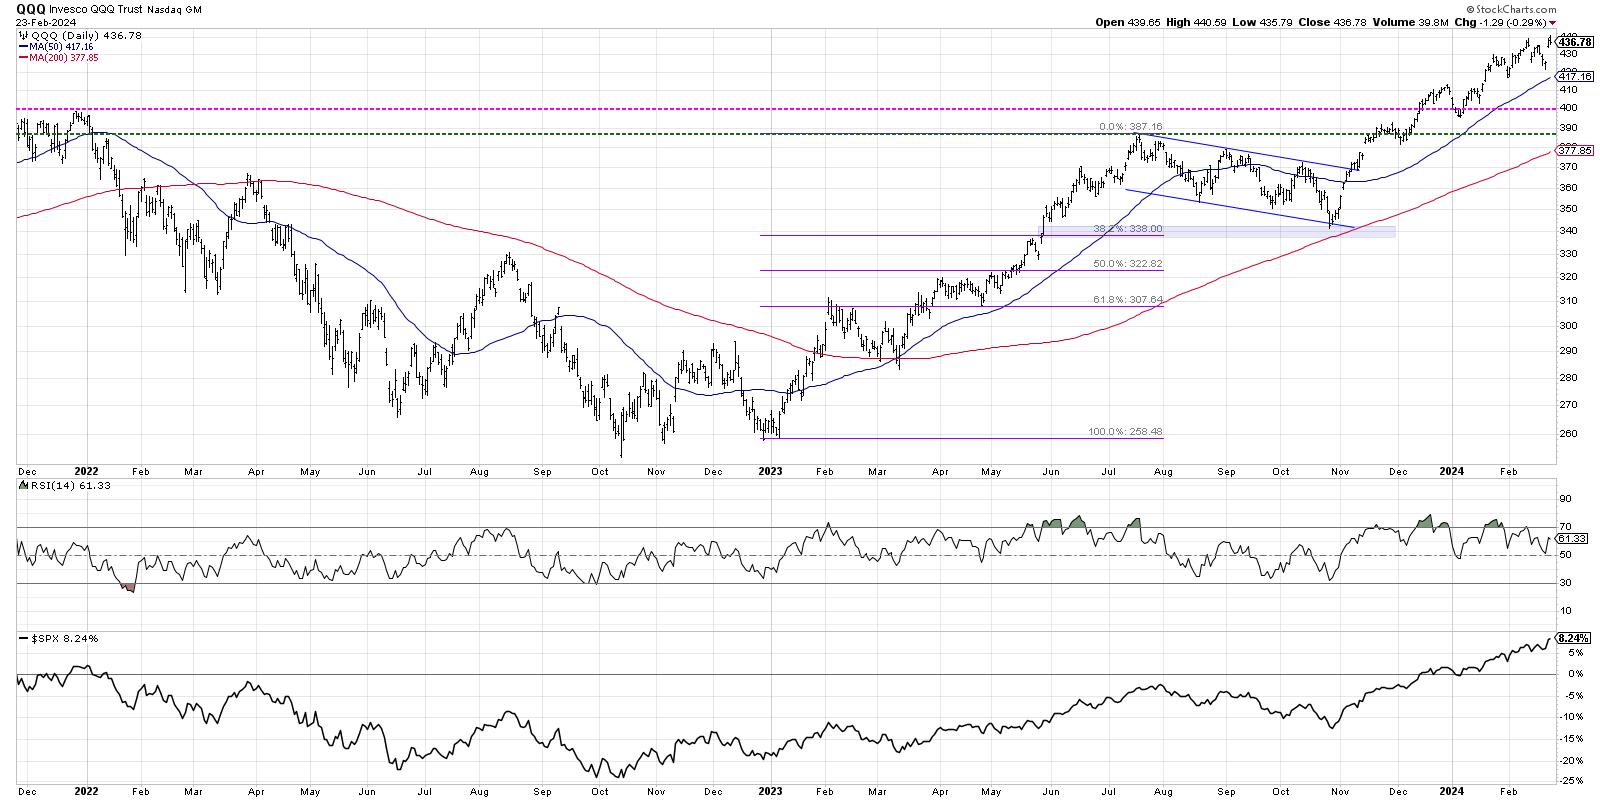
How Overextended Are You, QQQ?

by David Keller,
President and Chief Strategist, Sierra Alpha Research
We've highlighted all the warning signs as this bull market phase has seemed to near an exhaustion point. We shared bearish market tells, including the dreaded Hindenburg Omen,and how leading growth stocks have beendemonstrating questionable patterns. But despite all of those signs of market exhaustion, our growth-led...
READ MORE
MEMBERS ONLY

MEM TV: Simple Way to Identify a Buy Point in NVDA

by Mary Ellen McGonagle,
President, MEM Investment Research
In this episode of StockCharts TV'sThe MEM Edge, Mary Ellen reviews what drove the markets to new highs and what areas are outperforming. She also shares how to identify a buy point in NVDA after its gap up following earnings, as well as how to determine when a...
READ MORE
MEMBERS ONLY
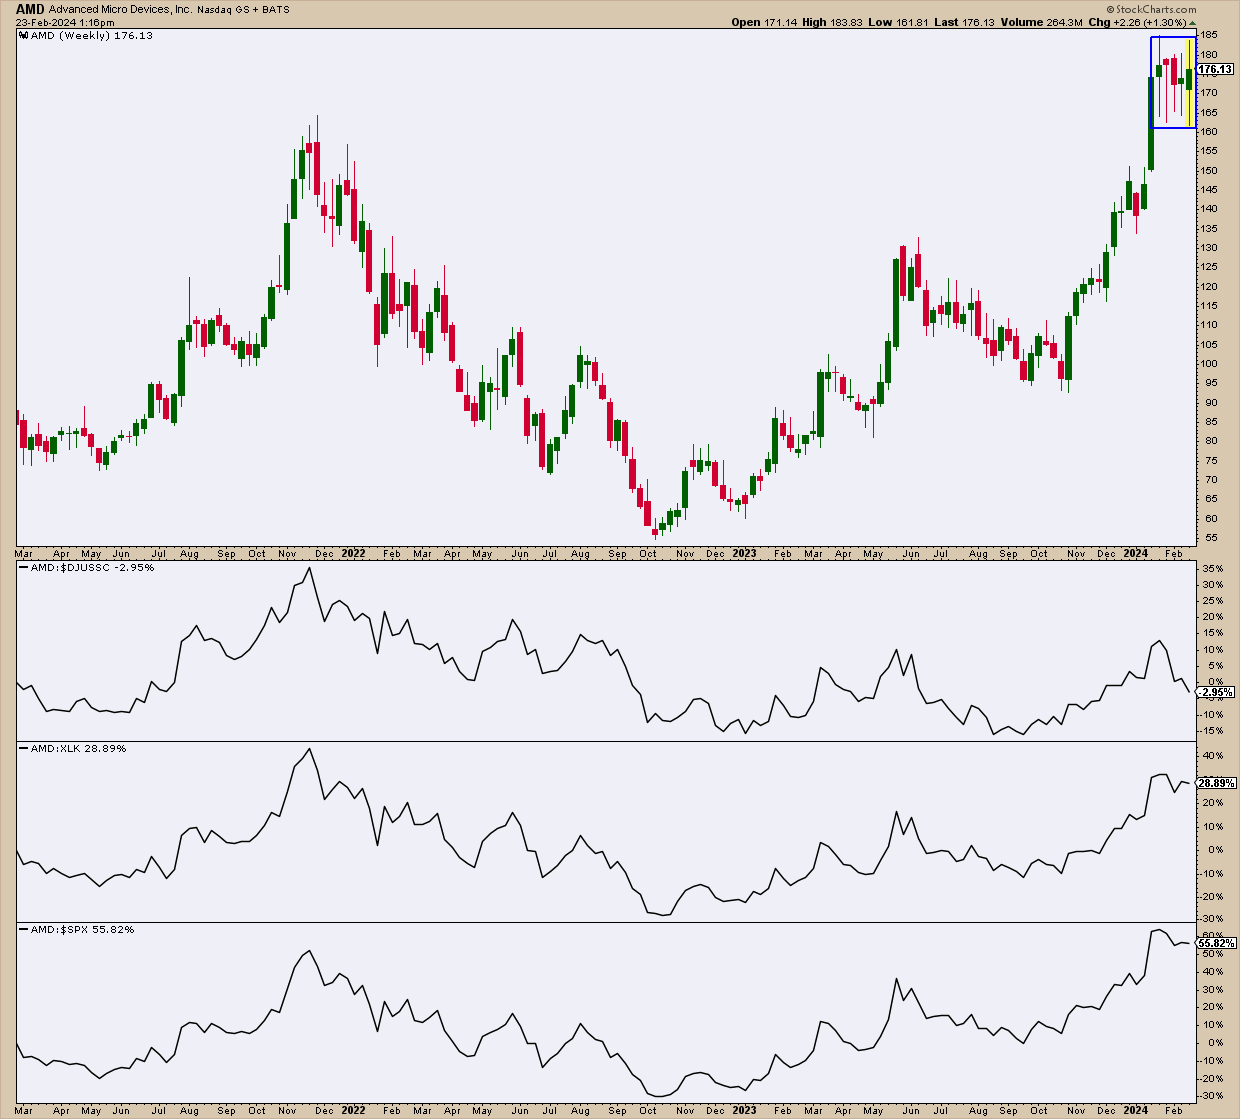
AMD's Sensational Halt — What You Need to Watch

by Karl Montevirgen,
The StockCharts Insider
KEY TAKEAWAYS
* Advanced Micro Devices (AMD) recovered quickly from a post-earnings slump
* Its longer term price action suggests indecision and the current pattern can also break either way
* This can either be a short-term trade or an investment; both scenarios will require different strategies
If you ran a StockCharts Gap...
READ MORE
MEMBERS ONLY

The Best Technical Indicator for Long-Term Investors
by David Keller,
President and Chief Strategist, Sierra Alpha Research
In this edition of StockCharts TV'sThe Final Bar, Dave drops an all-mailbag episode featuring viewer questions on the Hindenburg Omen, ascending triangle patterns, Fibonacci Retracements, projecting upside targets for stocks like NVDA, and the best technical indicator long-term investors should use!
This video originally premiered on February 23,...
READ MORE
MEMBERS ONLY

S&P 500's Sensational Rally Keeps On Going Thanks to NVDA — What You Need to Watch

by Jayanthi Gopalakrishnan,
Director of Site Content, StockCharts.com
KEY TAKEAWAYS
* S&P 500 hits a new all-time high and could keep on going
* NVIDIA's stellar earnings report was a catalyst to the rise in the S&P 500
* Volatility declined, indicating that investors are still relatively calm
Well, Nvidia did it! A stellar earnings...
READ MORE
MEMBERS ONLY
3 Unique RSI Techniques to Maximize Your Investments

by Joe Rabil,
President, Rabil Stock Research
On this week's edition of Stock Talk with Joe Rabil, Joe dives into the world of technical analysis by sharing three unique ways to utilize the RSI indicator alongside MACD and ADX -- the Pullback Trade, Confirming a Breakout and 2nd Chance Entry. He then covers the symbol...
READ MORE
MEMBERS ONLY
Markets Bracing for NVDA Earnings
by David Keller,
President and Chief Strategist, Sierra Alpha Research
In this edition of StockCharts TV'sThe Final Bar, Dave breaks down the latest market breadth indicators, ranging from bullish (S&P 500 advance-decline line) to bearish (Bullish Percent Indexes breaking down) to everything in between. He also analyzes key growth names including SMCI, PANW, AMZN, and NVDA....
READ MORE
MEMBERS ONLY

Emerging Markets Getting Closer to a Breakout

by Martin Pring,
President, Pring Research
Last November I asked the question "Are emerging markets about to emerge?"Using the iShares MSCI Emerging Markets ETF (EEM) as our benchmark, I concluded that more strength was needed in order to push the indicators into a bullish mode. In the intervening period, things have improved, but...
READ MORE
MEMBERS ONLY

The Titanic Syndrome Indicator Issues a WARNING!
by David Keller,
President and Chief Strategist, Sierra Alpha Research
In this edition of StockCharts TV'sThe Final Bar, Dave focuses on AAPL which closed below its 200-day moving average as it tests key price support. Guest Jesse Felder of The Felder Report reports on the Titanic Syndrome, a market breadth indicator similar to the Hindenburg Omen that suggests...
READ MORE
MEMBERS ONLY
Sector Spotlight: Dominant Trend for Stocks Still UP

by Julius de Kempenaer,
Senior Technical Analyst, StockCharts.com
On this episode of StockCharts TV's Sector Spotlight, I separate the 11 sectors in the S&P 500 into Offensive, Defensive, and Sensitive, assessing their group rotational patterns to see if there is any alignment with the current technical condition of the S&P 500. After...
READ MORE
MEMBERS ONLY
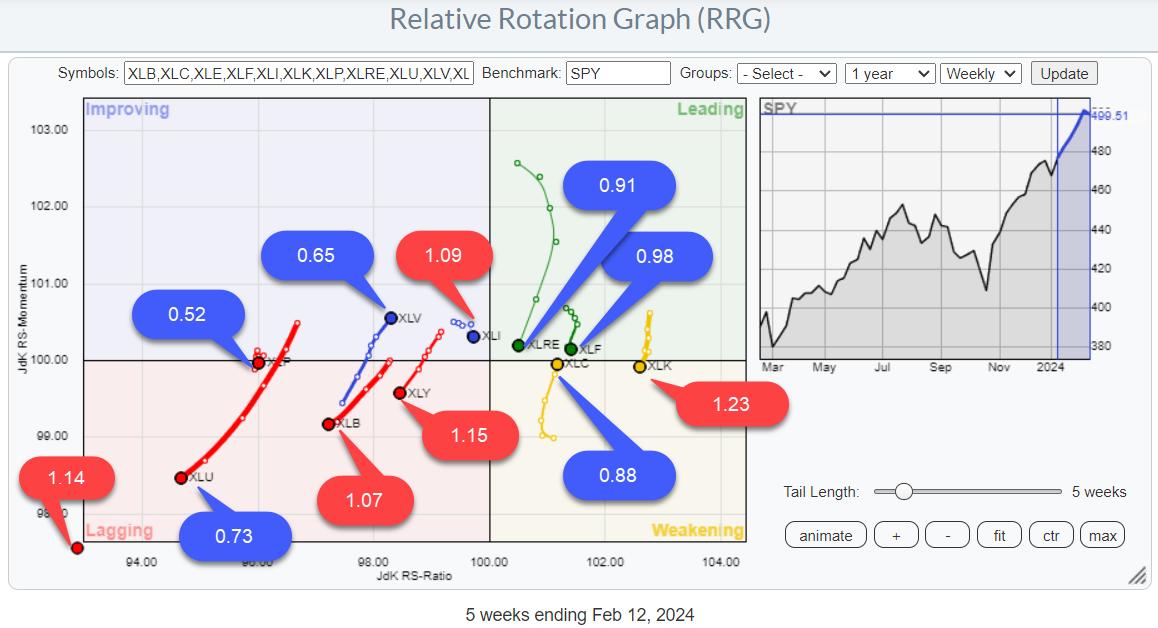
SPY Uptrend Intact, But Mixed Sector Rotation Signals Hesitation
by Julius de Kempenaer,
Senior Technical Analyst, StockCharts.com
KEY TAKEAWAYS
* Looking at Risk ON / OFF through BETA
* RRG shows mixed rotations
* SPY Uptrend intact with limited downside risk
BETA
One of the Risk ON/OFF metrics I like to keep an eye on is BETA.
From Investopedia:
—systematic risk—
I have updated my spreadsheet with last year'...
READ MORE
MEMBERS ONLY

Capturing the Momentum Phenomenon - Nvidia vs Tesla

by Arthur Hill,
Chief Technical Strategist, TrendInvestorPro.com
The momentum phenomenon has been a fixture in the US equity markets for decades. There are two types of momentum to consider: absolute momentum and relative momentum. Absolute momentum refers to the underlying trend, up or down. Relative momentum quantifies the strength of the uptrend and compares it to other...
READ MORE
MEMBERS ONLY
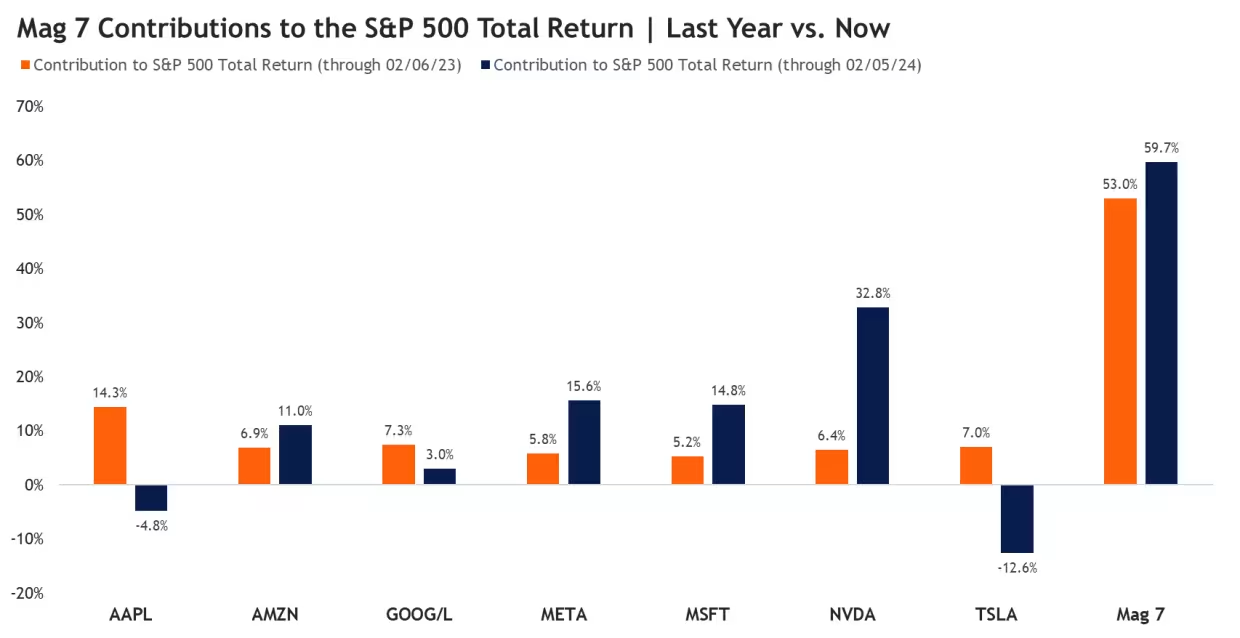
This Beaten-Down Magnificent Seven Stock is Poised to Regain Its Leadership Status
by Mary Ellen McGonagle,
President, MEM Investment Research
Going into last week, the Magnificent Seven stocks were looking more like the Magnificent Four. Leadership within the group became more concentrated, with Amazon, Meta, Microsoft and Nvidia having done most of the heavy lifting.
This is far different from the first 6 weeks of 2023, when gains among these...
READ MORE
MEMBERS ONLY
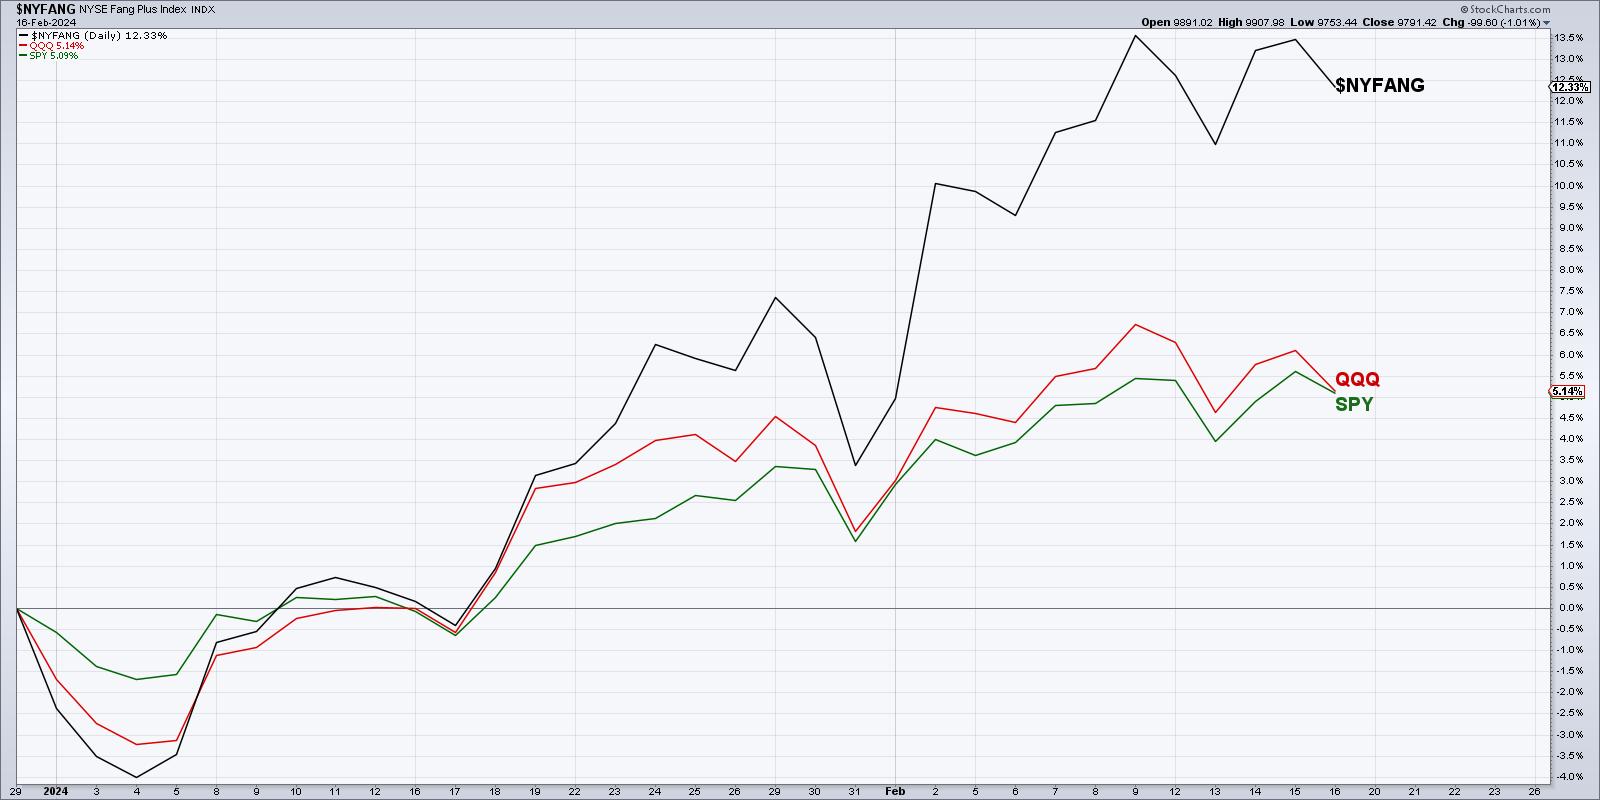
Three Leading Growth Stocks Testing Gap Support
by David Keller,
President and Chief Strategist, Sierra Alpha Research
KEY TAKEAWAYS
* The NYFANG+ index of leading growth stocks is up about 12% year-to-date, while the S&P 500 and Nasdaq 100 have gained only 5%.
* All three of these growth stocks show similar patterns, with a recent gap higher. But they have now all stalled out.
* If these...
READ MORE
MEMBERS ONLY

What to Do With NVDA (And Others Like It)
by David Keller,
President and Chief Strategist, Sierra Alpha Research
In this edition of StockCharts TV'sThe Final Bar, Dave answers viewer questions on the Money Flow Index, using RSP vs. SPY for relative strength analysis, strategies for names in extended uptrends like NVDA, applying Fibonacci retracements to charts like KRE, and more.
This video originally premiered on February...
READ MORE
MEMBERS ONLY

DraftKings' Stock Overheating? Here's What You Need to Do Now
by Karl Montevirgen,
The StockCharts Insider
KEY TAKEAWAYS
* DraftKings has demonstrated significant revenue growth following a lengthy period of outperformance relative to the S&P 500 and its respective sector and industry
* DraftKings' stock is overbought, with a declining RSI suggesting near term market correction
* Set a price alert to measure an anticipated pullback...
READ MORE
MEMBERS ONLY
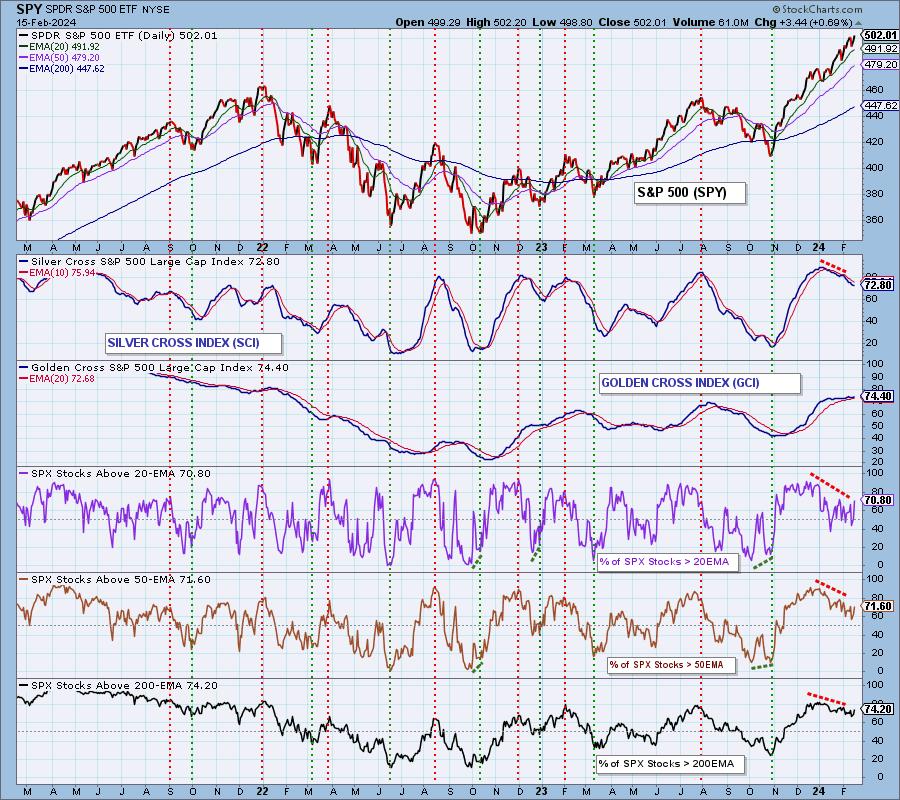
BUY Signals Continue to Diminish

by Carl Swenlin,
President and Founder, DecisionPoint.com
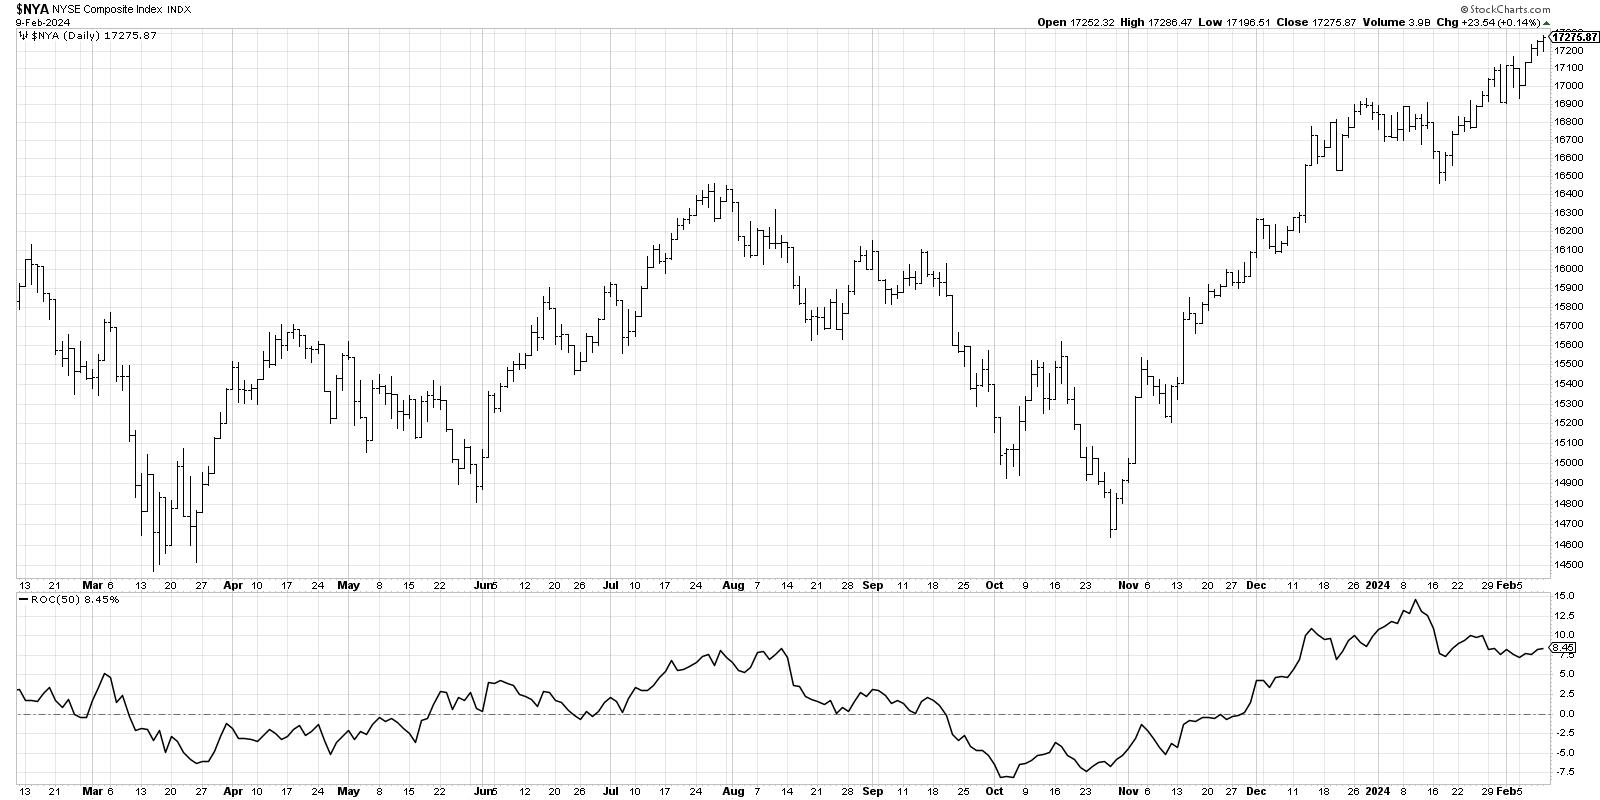
A Golden Cross BUY Signal is generated when the 50-day EMA of a price index crosses up through its 200-day EMA. DecisionPoint's Golden Cross Index (GCI) shows the percentage of stocks in a price index that have a Golden Cross BUY Signal, and is an expression of long-term...
READ MORE
MEMBERS ONLY
Identifying Powerful Trends with This Game-Changing ADX Setup
by Joe Rabil,
President, Rabil Stock Research
On this week's edition of Stock Talk with Joe Rabil, Joe shares the criteria for his favorite ADX setup. He explains what he needs to see on 2 different timeframes to put a stock into position for a powerful trend that can last a long time. Joe closes...
READ MORE
MEMBERS ONLY

Larry's "Family Gathering" February 15, 2024 Recording

by Larry Williams,
Veteran Investor and Author
In this video, Larry begins by presenting two trade recommendations, then digs into AI stocks, Bitcoin, and what you should be doing right now. Is it time to go long? Go short? Or wait for a decline? He explains the difference between FOMO and actually losing money, and how pain...
READ MORE
MEMBERS ONLY
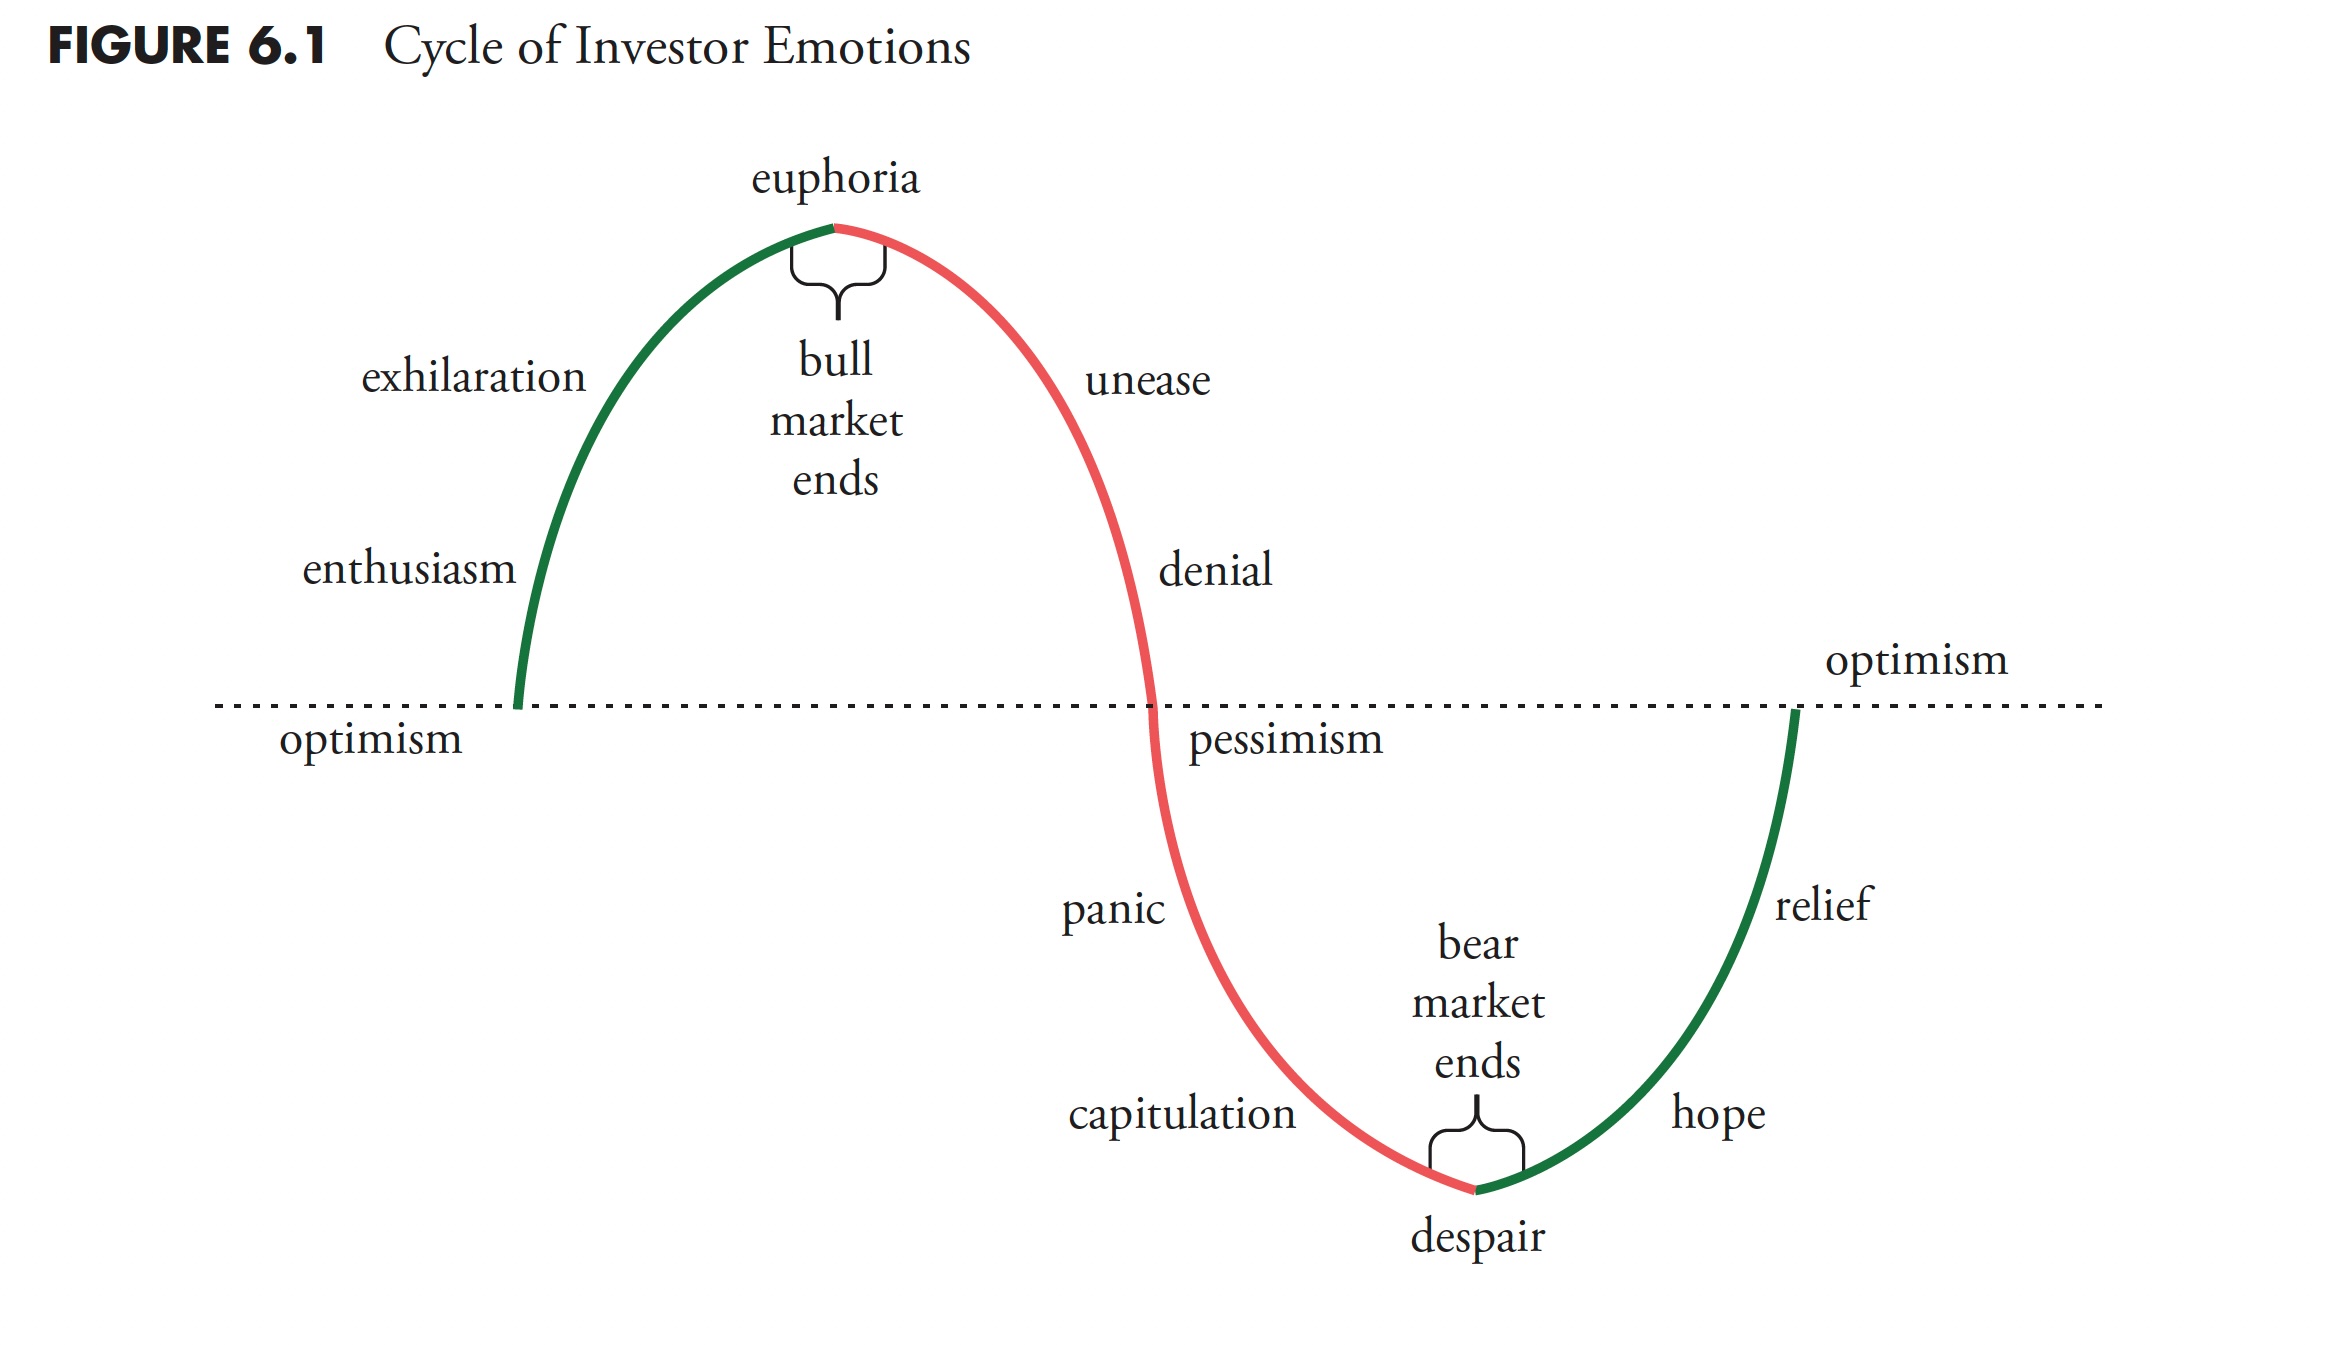
The Hoax of Modern Finance - Part 8: The Enemy in the Mirror

by Greg Morris,
Veteran Technical Analyst, Investor, and Author
Note to the reader: This is the eighth in a series of articles I'm publishing here taken from my book, "Investing with the Trend." Hopefully, you will find this content useful. Market myths are generally perpetuated by repetition, misleading symbolic connections, and the complete ignorance of...
READ MORE
MEMBERS ONLY

Gold is at the Crossroad
by Martin Pring,
President, Pring Research
Last November and December, it looked as if gold had broken out from a multi-year inverse head-and-shoulders. Since then, the price has dropped below the breakout area, and the long-term KST has begun to roll over.
Just like takeoff and landing are the critical points for an aircraft, breakouts are...
READ MORE
MEMBERS ONLY

The Halftime Show: Inflation Back in the Driver's Seat

by Pete Carmasino,
Chief Market Strategist, Chaikin Analytics
Yesterday, the market saw a massive selloff of over 2% at market lows for the SPY and the NDX. However, the rebound at the end of the day was promising, though not enough to change sentiment. What this means is that the selloff came from the hot CPI print, so...
READ MORE
MEMBERS ONLY
S&P 500 Plunges Below 5K!
by David Keller,
President and Chief Strategist, Sierra Alpha Research
In this edition of StockCharts TV'sThe Final Bar, Dave shows how the S&P 500 is just barely holding trendline support as his short-term Market Trend Model threatens to turn bearish this week. Guest Sean McLaughlin of All Star Charts talks through how he's playing...
READ MORE
MEMBERS ONLY

Walmart Stood Strong When The Market Crumbled - Time To Buy?
by Karl Montevirgen,
The StockCharts Insider
KEY TAKEAWAYS
* Walmart's stock was one among 37 outliers, rising early amidst a major market decline before slightly pulling back
* Technical indicators warn of potential weakness, signaling an imminent dip, but there's a good entry point for WMT
* Setting price alerts around specific levels and watching...
READ MORE
MEMBERS ONLY

DP Trading Room: Avoid These "Magnificent 7" Stocks!

by Erin Swenlin,
Vice President, DecisionPoint.com
On today's DecisionPoint Trading Room episode, Carl reviews the Magnificent 7 and gives you his opinion on their current and possible future states. He warns against two in particular and gives his stamp of approval on three others. Negative divergences are still a problem and Carl explains why....
READ MORE
MEMBERS ONLY
Beware the Hindenburg Omen!
by David Keller,
President and Chief Strategist, Sierra Alpha Research
KEY TAKEAWAYS
* Jim Miekka created the Hindenburg Omen after studying the conditions present at previous market peaks.
* The Hindenburg Omen triggered an initial signal this week, just as the S&P 500 finally closed above 5000 for the first time.
* If we see a second signal in the next...
READ MORE
MEMBERS ONLY
Sentiment Lopsided - Is It a Problem?
by Erin Swenlin,
Vice President, DecisionPoint.com
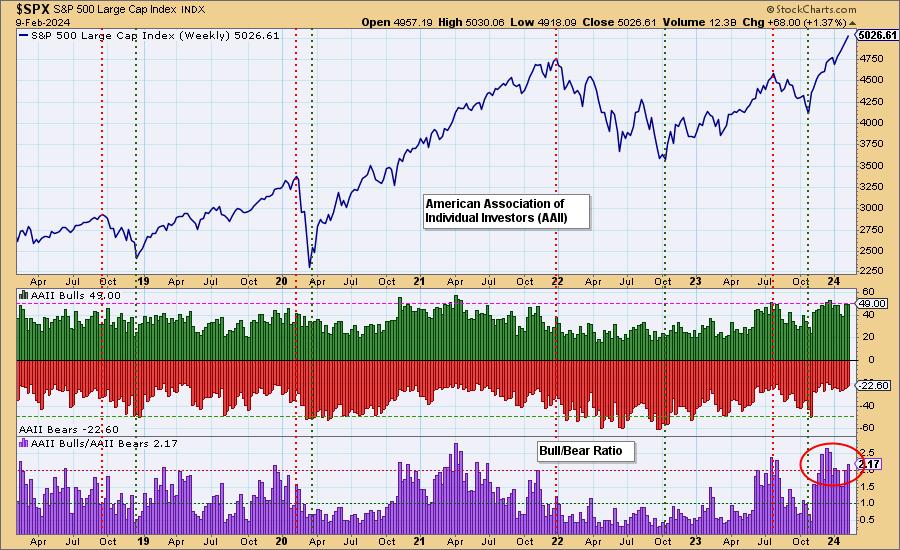
Periodically, we like to review sentiment charts, and today we have two for you. One is the poll results from the American Association of Individual Investors (AAII) and the other is the National Association of Active Investment Managers (NAAIM) Exposure level.
In both cases, we are starting to see sentiment...
READ MORE
MEMBERS ONLY

Your Questions, Answered! Price Gaps, Bull Flags, Inverse Patterns, and MORE
by David Keller,
President and Chief Strategist, Sierra Alpha Research
In this edition of StockCharts TV'sThe Final Bar, Dave digs into The Final Bar Mailbag and answers questions on price patterns like bull flags, what price gaps actually represent on the chart, and why analyzing earnings trends could help you anticipate subsequent moves for stocks like META.
This...
READ MORE
MEMBERS ONLY

The Costco Stock Surge: What You Need to Know Right Now!
by Karl Montevirgen,
The StockCharts Insider
KEY TAKEAWAYS
* Costco's stock surged to unprecedented heights, surpassing its previous all-time record
* Costco's technical situation looks exceedingly bullish, but like many stocks hitting record highs, the stock may be slightly overbought
* The Money Flow Index can measure momentum and show whether price buying pressure is...
READ MORE
MEMBERS ONLY
3 Expert Earnings Plays: Maximizing Reward, Minimizing Risk
by David Keller,
President and Chief Strategist, Sierra Alpha Research
In this edition of StockCharts TV'sThe Final Bar, Dave welcomes Danielle Shay of Simpler Trading. Danielle highlights three earnings plays she's focused on this week, and shares how she combines multiple time frames in her trading to better define risk vs. reward. Dave laments the weakening...
READ MORE
MEMBERS ONLY
Master Momentum Using Price Swings and Fibonacci Grids
by Joe Rabil,
President, Rabil Stock Research
On this week's edition of Stock Talk with Joe Rabil, Joe discusses how he uses the price swings and Fibonacci grid to determine the momentum of a trend without the use of indicators. He explains how indicators can lag at reversal points and why we need to lean...
READ MORE
MEMBERS ONLY

Why the NAAIM Exposure Index Matters to Your Investments
by David Keller,
President and Chief Strategist, Sierra Alpha Research
In this edition of StockCharts TV'sThe Final Bar, Dave welcomes Ryan Redfern, ChFC, CMT of Shadowridge Asset Management and President of NAAIM. Ryan provides a primer on the NAAIM Exposure Index, including what it is, how it's calculated, and how it can be used to measure...
READ MORE
MEMBERS ONLY

Decoding PLTR Stock: Why It's an Attractive Investment
by Jayanthi Gopalakrishnan,
Director of Site Content, StockCharts.com
KEY TAKEAWAYS
* PLTR stock gapped up after its impressive Q4 earnings and guidance
* Watch the average directional index and relative strength index to monitor the momentum of the upward trend
* If momentum continues to be strong, the stock would be an attractive investment
If you look at a chart of...
READ MORE
MEMBERS ONLY

Eli Lilly's Volatile Victory: What Tuesday's Turnaround Means for Your Portfolio
by Karl Montevirgen,
The StockCharts Insider
KEY TAKEAWAYS
* Eli Lilly & Co's beat on earnings and revenue expectations led to a swift 5% spike and reversal in its stock price
* Analyzing Eli Lilly's stock price chart reveal some headwinds that may not be apparent in fundamental data
* Eli Lilly's stock...
READ MORE
MEMBERS ONLY
Market Breadth Divergence Says NO BULL!
by David Keller,
President and Chief Strategist, Sierra Alpha Research
In this edition of StockCharts TV'sThe Final Bar, Dave demonstrates how the market's recent upswing has left mid-caps and small-caps in the dust, with deteriorating breadth conditions suggesting an increased risk of downside for the S&P 500. He also unveils the latest enhancements to...
READ MORE
MEMBERS ONLY

Only a Fool Would Try to Call a Correction in a Bull Market, So Here Goes!
by Martin Pring,
President, Pring Research
The vast majority of the primary trend indicators are pointing to a bull market and have been doing so for the better part of a year. Chart 1, for instance, shows that NYSE Margin Debt, or rather its long-term KST, has only recently gone bullish. The vertical lines point out...
READ MORE
MEMBERS ONLY
DecisionPoint Trading Room: Narrow Advance a Big Problem!
by Erin Swenlin,
Vice President, DecisionPoint.com
The market rally last week was very narrow, driven mainly by large gains in communication services stocks like Meta. Many technical indicators are showing negative divergences. The broader market struggled. Erin reviews all of the sectors under the hood and then takes your symbol requests.
Key Takeaways:
- Communication services...
READ MORE
MEMBERS ONLY

Generals March On, but Fewer Troops are Following - Get the Essential Breadth Indicator ChartList
by Arthur Hill,
Chief Technical Strategist, TrendInvestorPro.com
Divergences reflect a disconnect between price and the indicator. A bearish divergence forms when price forges a higher high and the indicator fails to confirm this high. In the case presented below, we have the S&P 500 moving higher and fewer stocks making it back above their 50...
READ MORE
MEMBERS ONLY

Deciphering Gold's (GLD) Signals: Is Now the Time to Go Long on Gold?
by Karl Montevirgen,
The StockCharts Insider
KEY TAKEAWAYS
* The robust jobs data triggered a sell-off in the gold market, hampering expectations of an imminent rate cut
* Price projections for GLD in 2024 span a wide spectrum, below and above current prices because of fluctuating macroeconomic and geopolitical dynamics
* The Volume-by-Price indicator is especially useful in recognizing...
READ MORE