MEMBERS ONLY
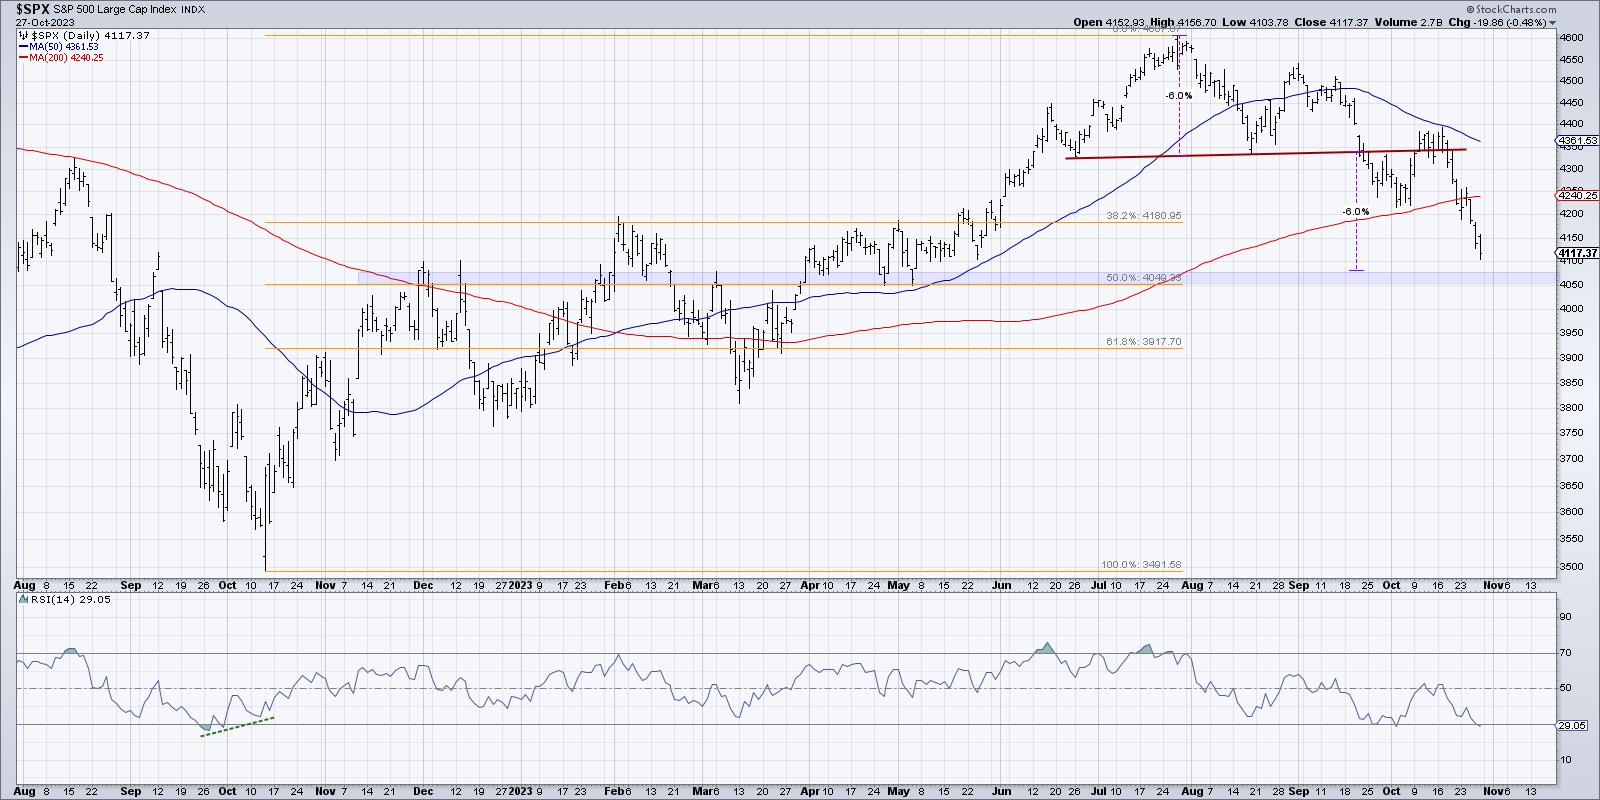
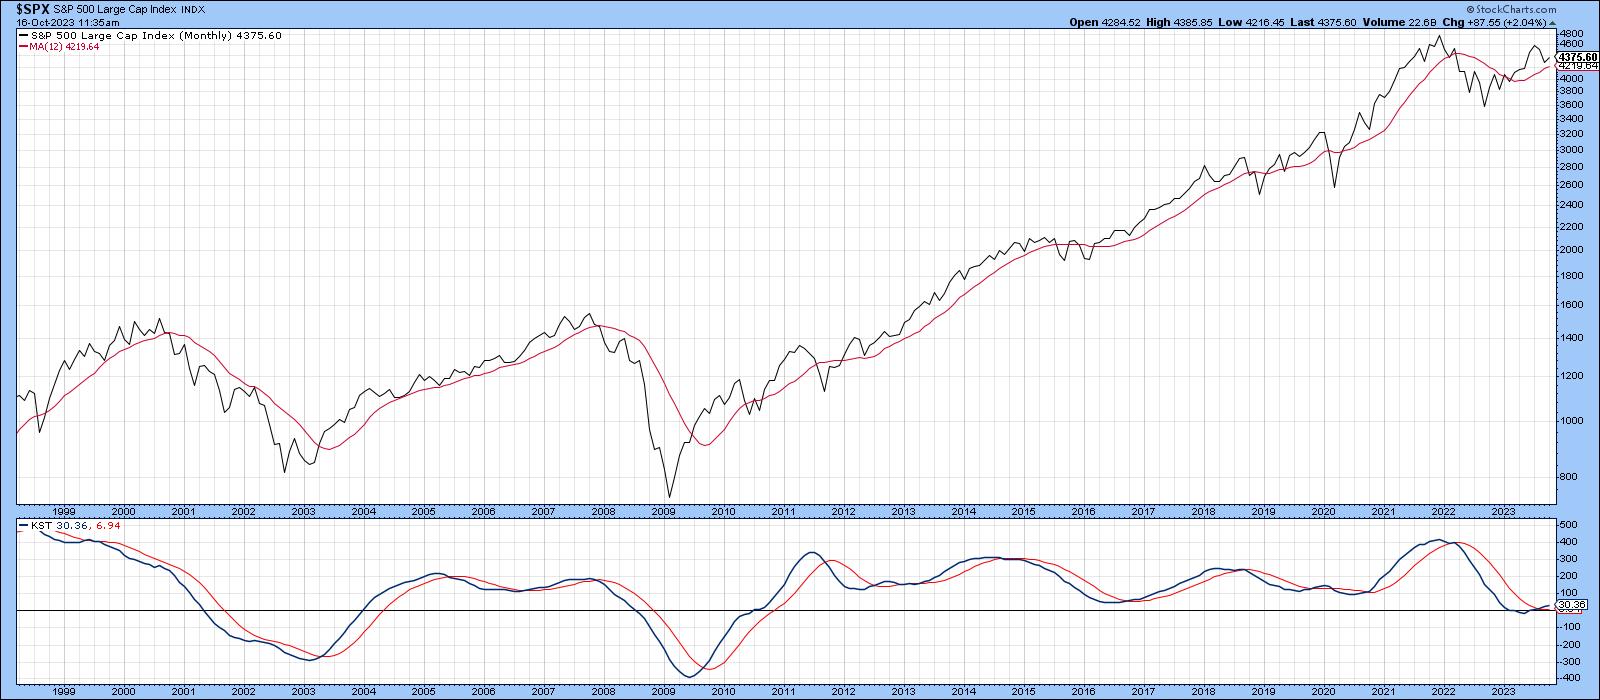
My Downside Targets for the S&P 500

by David Keller,
President and Chief Strategist, Sierra Alpha Research
KEY TAKEAWAYS
* The S&P 500 has almost reached the minimum downside objective based on the head and shoulders topping pattern.
* SPX 3800 would mean represent a 38.2% retracement level of the March 2020 to January 2022 bull market phase.
If you've been fighting the mounting...
READ MORE
MEMBERS ONLY

Where to Find Stock Opportunities in Bear Territory
by David Keller,
President and Chief Strategist, Sierra Alpha Research
In this edition of StockCharts TV'sThe Final Bar, host Dave wraps a bearish week with a discussion on downtrend conditions, trendline resistance, deteriorating breadth, and finding opportunities in a bearish landscape. He answers viewer questions on inverted yield curves, recessionary periods, and leading vs. lagging technical indicators.
This...
READ MORE
MEMBERS ONLY

GNG TV: Charts Flash Warning Signs of Further Risk to the Downside

by Alex Cole,
Co-founder, GoNoGo Charts®
In this edition of the GoNoGo Charts show, with US Equities delivering a streak of daily gains this week, Alex takes a top down approach to see what the GoNoGo Charts are saying about markets. With U.S. domestic equities in a "NoGo" trend, the charts warn that...
READ MORE
MEMBERS ONLY
The Halftime Show: Watch the Unemployment Rate - It Could Change Everything!

by Pete Carmasino,
Chief Market Strategist, Chaikin Analytics
On this week's edition of StockCharts TV'sHalftime, Pete explains how his TLT call from 10/10 was spot-on! But that could all change based on the unemployment rate. Pete believes that rates will fallifthe unemployment rate spikes higher, likely to the 4.25-4.5%...
READ MORE
MEMBERS ONLY

Is the Bear Back?

by Carl Swenlin,
President and Founder, DecisionPoint.com
The S&P 500 (SPY) has fallen about 10 percent from the July top, and the last two weeks has been pretty rough, so should we be looking for the Bear to take charge again?
First, looking at a weekly chart, it is not clear that the Bear actually...
READ MORE
MEMBERS ONLY
Late-Hour Selloff Confirms Downtrend Phase!
by David Keller,
President and Chief Strategist, Sierra Alpha Research
In this edition of StockCharts TV'sThe Final Bar, guest Tom Bowley of EarningsBeats shares his chart of key ratios illustrating how growth still has held its ground relative to value stocks. Host David Keller, CMT focuses in on distribution in the last hour of trading and highlights one...
READ MORE
MEMBERS ONLY

This Powerful MACD/ADX Screener Generates Valuable Ideas

by Joe Rabil,
President, Rabil Stock Research
On this week's edition of Stock Talk with Joe Rabil, Joe shows an intraday trade setup in the SPY that took place this week. He uses the MACD and ADX in multiple timeframes to explain in detail how they can help with our entry and timing. He discusses...
READ MORE
MEMBERS ONLY

Many Reasons to Love and Hate AMZN Stock

by Karl Montevirgen,
The StockCharts Insider
KEY TAKEAWAYS
* Amazon stock has been falling ahead of earnings and is close to hitting the support of its 200-day moving average
* When AMZN announce its Q3 earnings, investors will be interested in the company's e-commerce and cloud services
* Keep an eye on AMZN's...
READ MORE
MEMBERS ONLY
Looking Outside the Stock Market for Opportunities

by Arthur Hill,
Chief Technical Strategist, TrendInvestorPro.com
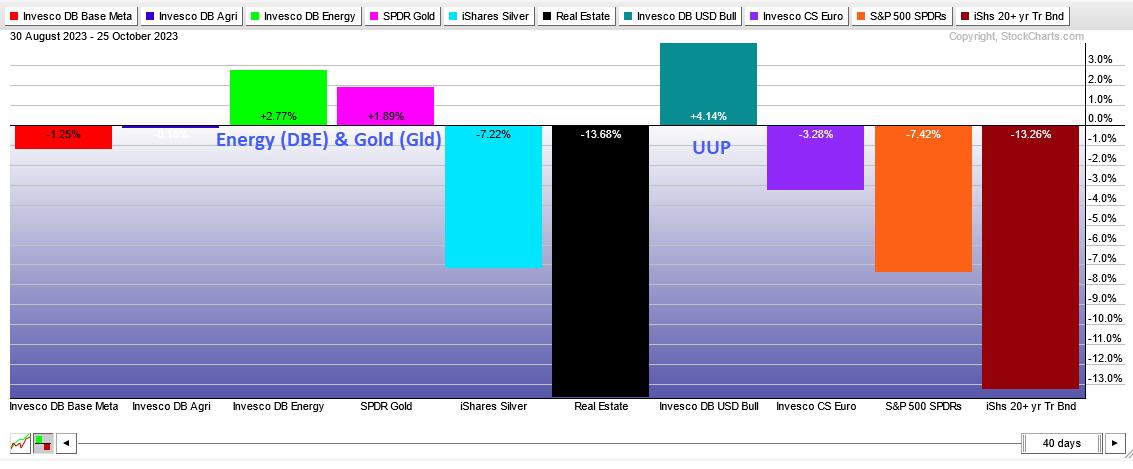
Correlations rise during bear markets. This means more stocks participate in broad market declines than broad market advances. In other words, the odds are stacked against us when picking stocks in bear markets. Traders are better off looking outside of the stock market for opportunities.
The Perfchart below shows the...
READ MORE
MEMBERS ONLY

Microsoft (MSFT) Stock On the Verge of a Powerful Breakthrough
by Karl Montevirgen,
The StockCharts Insider
KEY TAKEAWAYS
* Microsoft's Q1 2024 earnings report beat analyst expectations
* Microsoft's weekly charts suggest a long-term bullish stance for MSFT stock
* Microsoft's daily chart also shows a bullish stance with the stock trading well above its 200-day movign average
When Microsoft (MSFT)...
READ MORE
MEMBERS ONLY

Google Stock Expectations In the Spotlight: Will Earnings Results Exceed Expectations?

by Jayanthi Gopalakrishnan,
Director of Site Content, StockCharts.com
KEY TAKEAWAYS
* Google's Q3 earnings will have an impact on which way the stock moves
* GOOGL's daily stock chart shows the stock is trading very close to its 52-week high
* GOOGL stock is trading above its 21-day exponential moving average, it has a high...
READ MORE
MEMBERS ONLY

Complimentary Edition of the DecisionPoint "Weekly Wrap"
by Carl Swenlin,
President and Founder, DecisionPoint.com

by Erin Swenlin,
Vice President, DecisionPoint.com
KEY TAKEAWAYS
* Golden Cross BUY Signal for Gold
* Death Cross SELL Signal for NYSE Composite
* Death Cross SELL Signal for Materials (XLB)
Gold (GLD) has been strong this month and today its 50-day EMA crossed up through its 200-day EMA (Golden Cross), generating an LT Trend Model BUY...
READ MORE
MEMBERS ONLY

RRG is Sending a Clear Message And Finds Two Stocks With Good Upside Potential

by Julius de Kempenaer,
Senior Technical Analyst, StockCharts.com
KEY TAKEAWAYS
* RRG is sending a strong message to prefer Growth over Value
* Putting the growth stocks from IVW through a scan and some thorough RRG analyses finds a handful of interesting names
* Two unexpected stocks are showing up as having good upside potential
* Especially growth stocks from Defensive sectors...
READ MORE
MEMBERS ONLY

These 3 Stocks Keep Hitting New Highs and Can Still Surge: This Is the Time To Look for an Entry
by Jayanthi Gopalakrishnan,
Director of Site Content, StockCharts.com
KEY TAKEAWAYS
* Scanning for stocks that are reaching all-time highs while the broader market is trending lower can result in ideal trading opportunities
* Look for stocks that are trending higher over the longer-term and pulling back
* FANG, PGR, and MUSA are showing signs of pullback and should be...
READ MORE
MEMBERS ONLY

Tesla Stock Has High Expectations: A Strong Pop or Plunge
by Karl Montevirgen,
The StockCharts Insider
KEY TAKEAWAYS
* Tesla's stock formed a symmetrical triangle pattern leading up to Q3 earnings, indicating potential volatility amid indecision
* TSLA stock broke below the symmetrical triangle after missing earnings
* You can figure out the price target based on a measured move or average statistics
Sometimes, a stock'...
READ MORE
MEMBERS ONLY
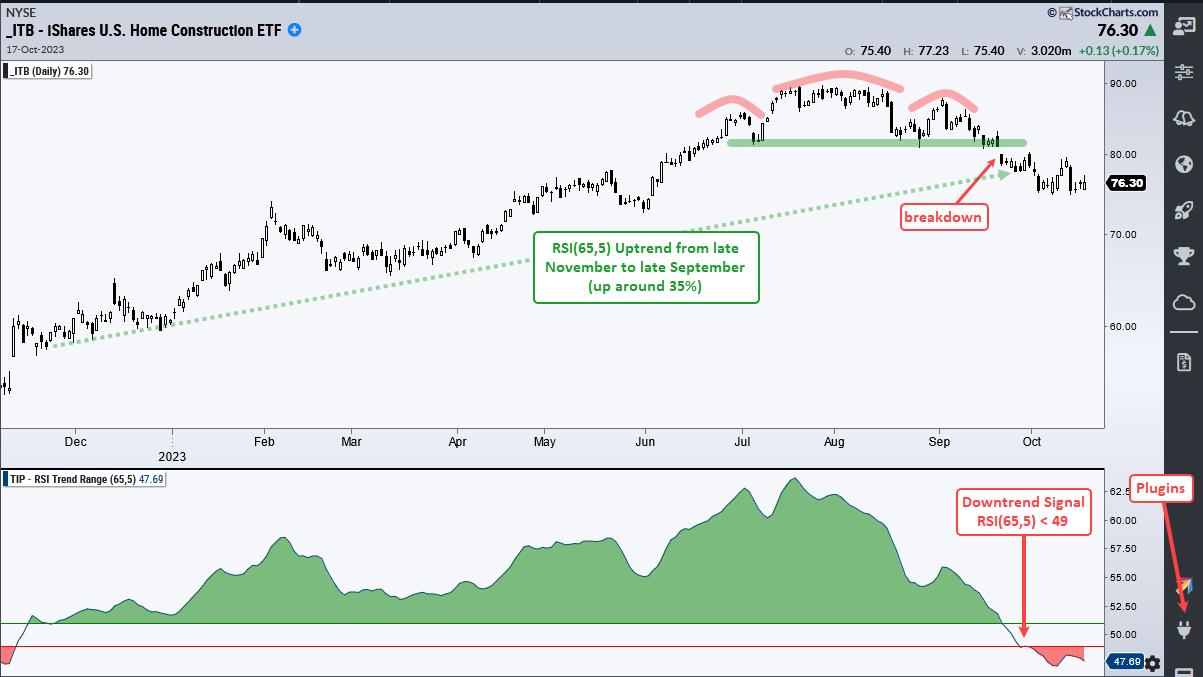
Home Construction ETF Breaks and a Home Builder Sets up for Further Downside
by Arthur Hill,
Chief Technical Strategist, TrendInvestorPro.com
The Home Construction ETF (ITB) led the market the first seven months of the year, but fell on hard times the last two months and reversed its long-term uptrend. Today's report/video will look at the trend reversal in ITB using the RSI Trend Range indicator. We...
READ MORE
MEMBERS ONLY

How Mega-Cap Names Dominate Through Market Cap
by David Keller,
President and Chief Strategist, Sierra Alpha Research
In this edition of StockCharts TV'sThe Final Bar, Dave shares how growth over value is less about the types of companies and more about the market cap represented in the largest benchmark names. He breaks down today's pop-and-drop for Bitcoin and answers questions from...
READ MORE
MEMBERS ONLY
GNG TV: Looking at a Relief Rally or a Return to Go Trends?
by Alex Cole,
Co-founder, GoNoGo Charts®

by Tyler Wood,
Co-founder, GoNoGo Charts®
In this edition of the GoNoGo Charts show, with US Equities delivering a streak of daily gains this week, Alex and Tyler examine the daily weak NoGo trend conditions against the weak Go trend conditions on the weekly timeframe. The model is calculated the exact same way, but longer timeframe...
READ MORE
MEMBERS ONLY

Sector Spotlight: Sensitive Sectors Continue to Prop Up the S&P 500
by Julius de Kempenaer,
Senior Technical Analyst, StockCharts.com
On this episode of StockCharts TV's Sector Spotlight, after two weeks of absence, Julius de Kempenaer is back with an in-depth look at the current state of asset class rotation and sector rotation. By slicing sectors into Offensive, Defensive, and Sensitive groups, he paints a picture with...
READ MORE
MEMBERS ONLY
If War in the Middle East Won't Push this Market Down, What Will?

by Martin Pring,
President, Pring Research
I must say, I was surprised that the outbreak of war in the Middle East and a 4% rise in oil sent the market higher, not lower by the close of business last Monday. Typically, a market that does not respond to bad news in a negative way is one...
READ MORE
MEMBERS ONLY
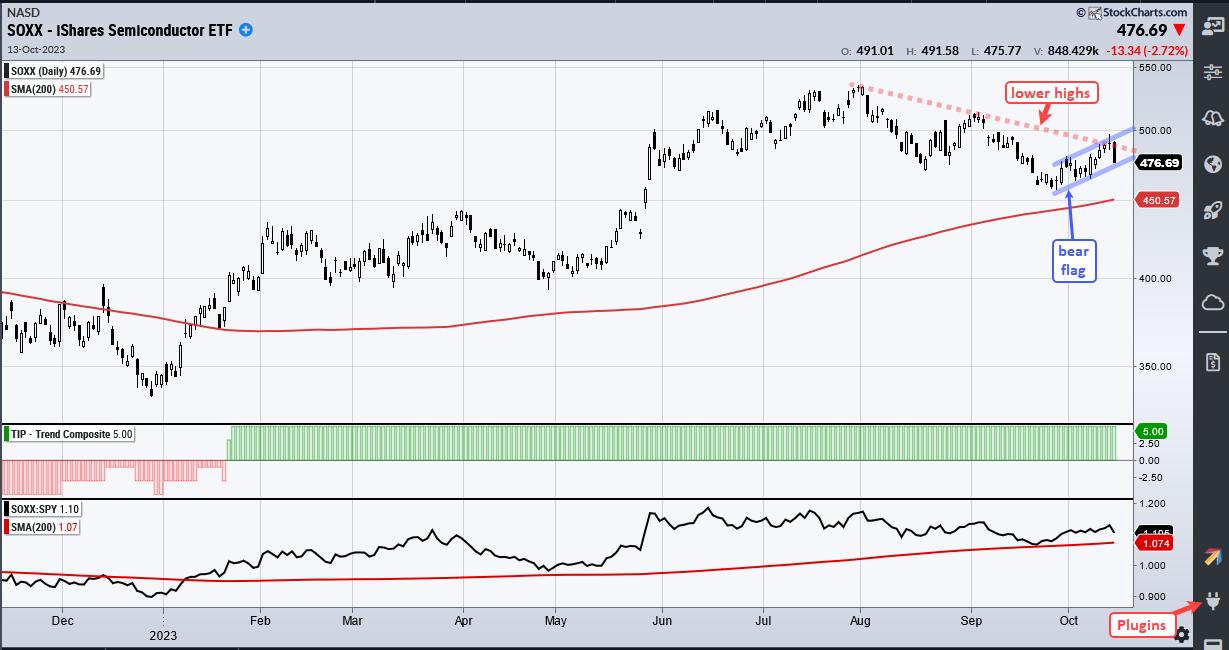
Equal-weight Semis Break Down - Is SOXX Next? - with video (Free)
by Arthur Hill,
Chief Technical Strategist, TrendInvestorPro.com
Today's report will compare charts and performance for the Semiconductor ETF (SOXX) and the Semiconductor SPDR (XSD). SOXX represents large-caps and is holding up. XSD represents the average semiconductor stock and it is not holding up. Broad weakness within the semiconductor group is likely to spread to...
READ MORE
MEMBERS ONLY
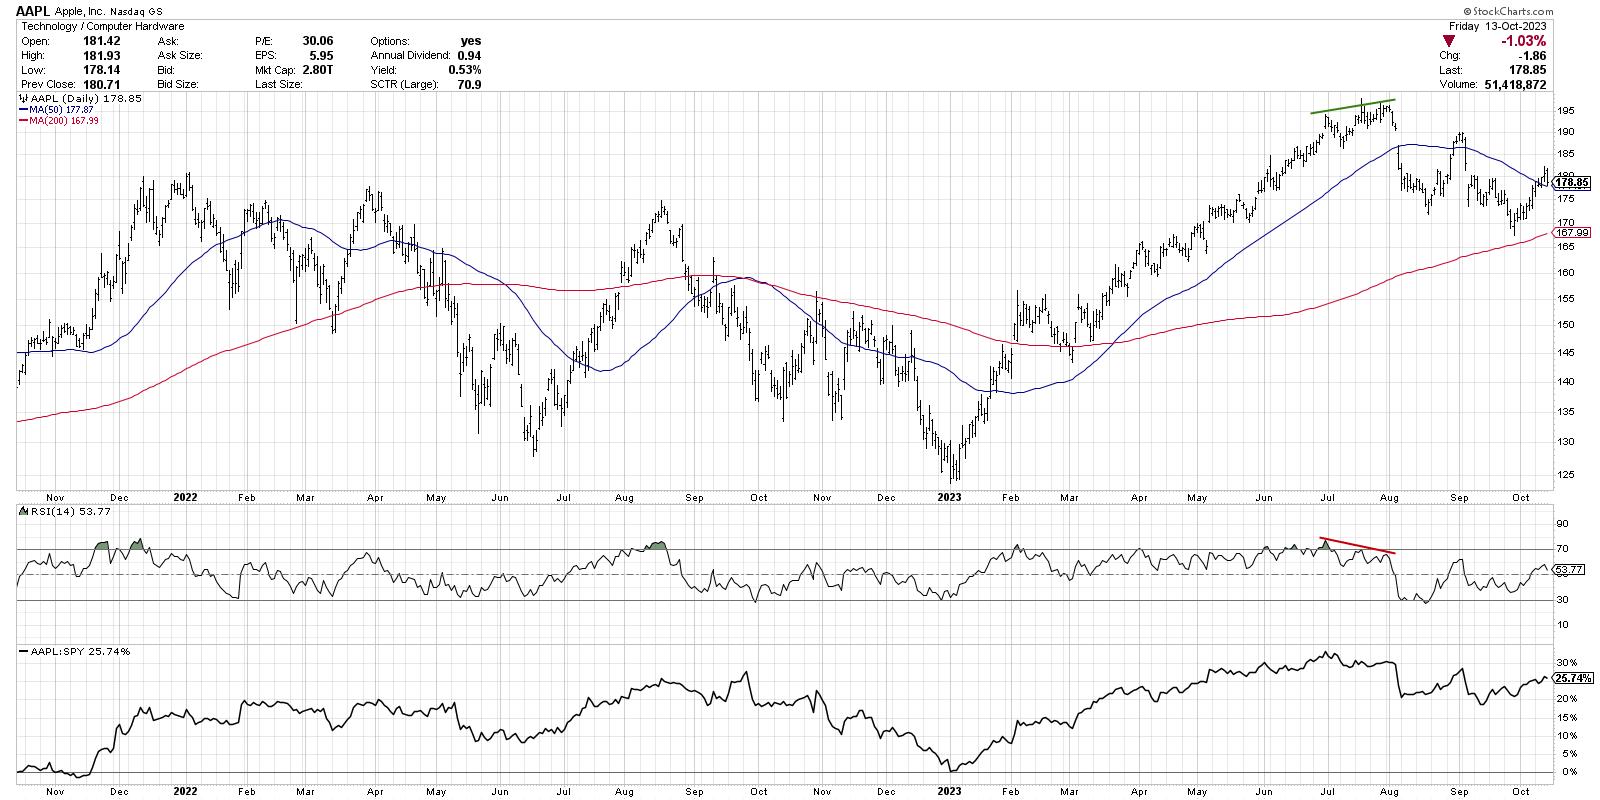
Lagging Indicators Confirm Bearish Phase For Growth
by David Keller,
President and Chief Strategist, Sierra Alpha Research
KEY TAKEAWAYS
* Leading indicators help anticipate price reversals, while lagging indicators validate trend changes you've already observed.
* RSI combines the qualities of leading and lagging indicators, helping investors to prepare for and react to trend reversals.
* AAPL recently showed a bullish momentum divergence, meaning the leading indicator has...
READ MORE
MEMBERS ONLY

Gain GREATER CLARITY on The Market's Latest Moves With Seasonality Charts!

by Grayson Roze,
Chief Strategist, StockCharts.com
On this week's edition of StockCharts TV'sStockCharts in Focus, Grayson explores the Seasonality tool and shares how these unique charts can help you gain a deeper, more data-driven perspective on the market's latest moves. By charting historical price moves for each month of...
READ MORE
MEMBERS ONLY

Growth Sectors Tumble as Defensive Plays Post a Strong Finish
by David Keller,
President and Chief Strategist, Sierra Alpha Research
In this edition of StockCharts TV'sThe Final Bar, Dave tracks the rapid decline in growth sectors including Technology and Communication Services as defensive plays like utilities and gold post a strong finish to the week. Dave answers questions from The Final Bar Mailbag on the McClellan Summation Index...
READ MORE
MEMBERS ONLY

Looking At a Perfect Pullback Opportunity

by TG Watkins,
Director of Stocks, Simpler Trading
The market followed the Moxie rules perfectly this week. The setup was there for our traders, and so we took advantage of the choppy down move over the last three days which were spurred on by some economic reports and worldly events. In this week's edition of Moxie...
READ MORE
MEMBERS ONLY

Stock Market Weekly Update: 3 Valuable Points You Need To Know About the Selloff
by Jayanthi Gopalakrishnan,
Director of Site Content, StockCharts.com
KEY TAKEAWAYS
* Broader stock market indices are still holding support despite the selloff
* The VIX closed higher but it's still tame relative to past readings
* Gold futures closed above $1900 per ounce indicating that investors may have fled to gold in case geopolitical tensions escalated over the weekend...
READ MORE
MEMBERS ONLY
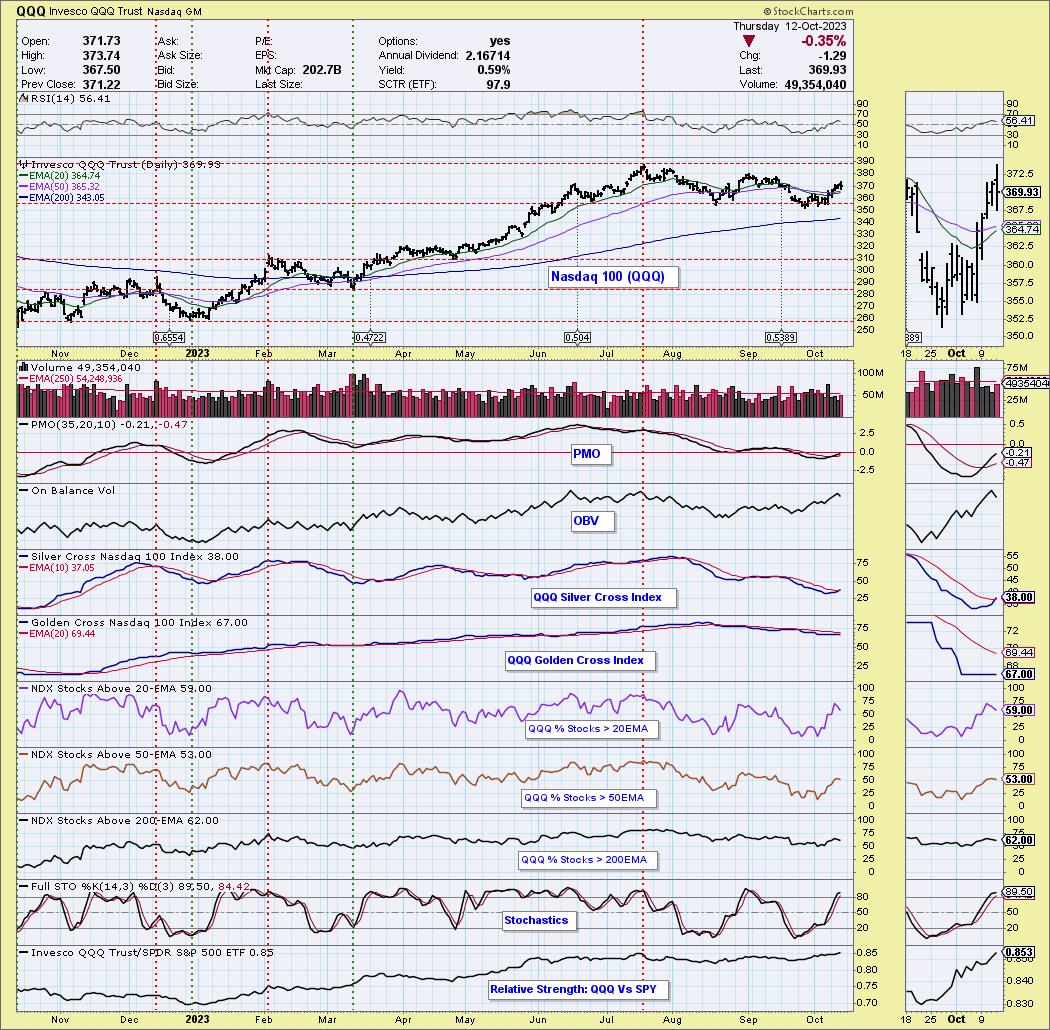
Nasdaq 100 (QQQ), Communication Services (XLC), and Transports (IYT) New Bullish Bias in IT
by Erin Swenlin,
Vice President, DecisionPoint.com
KEY TAKEAWAYS
* Silver Cross Index Has Bullish "Shift" Above Signal Line for QQQ, XLC and IYT
* QQQ Should Continue Higher
* XLC Struggles Today, But Has Bullish Outlook
* IYT Neutral Outlook Based on Relative Strength
The Silver Cross Index is another way for us to measure participation within an...
READ MORE
MEMBERS ONLY
2 Clear Strategies When Using the ADX
by Joe Rabil,
President, Rabil Stock Research
On this week's edition of Stock Talk with Joe Rabil, Joe discusses keys to using the ADX indicator. He focuses on the 2 clear strategies for ADX and how to handle them. In addition, he describes the slope of this line and how that affects the strategy. Joe...
READ MORE
MEMBERS ONLY
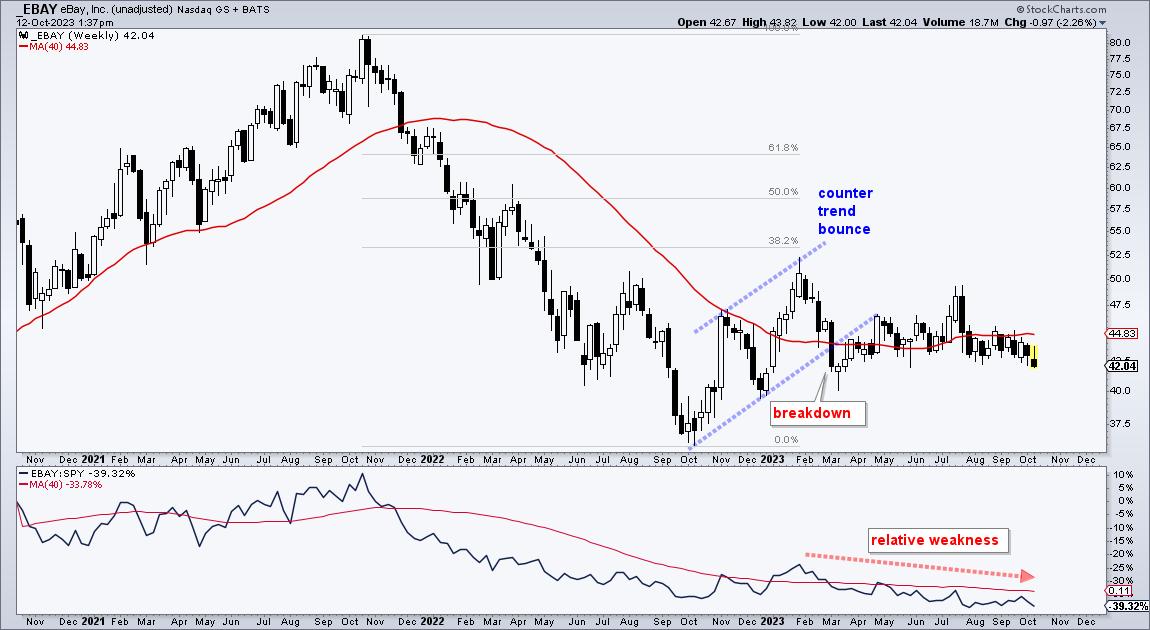
EBAY Cannot Hold a Bid
by Arthur Hill,
Chief Technical Strategist, TrendInvestorPro.com
Despite a rough ride in September, the S&P 500 is still up 14% year-to-date and the Nasdaq 100 is up a whopping 40%. The gains here, however, do not tell the entire story because many stocks are struggling in 2023. In fact, around half of the...
READ MORE
MEMBERS ONLY
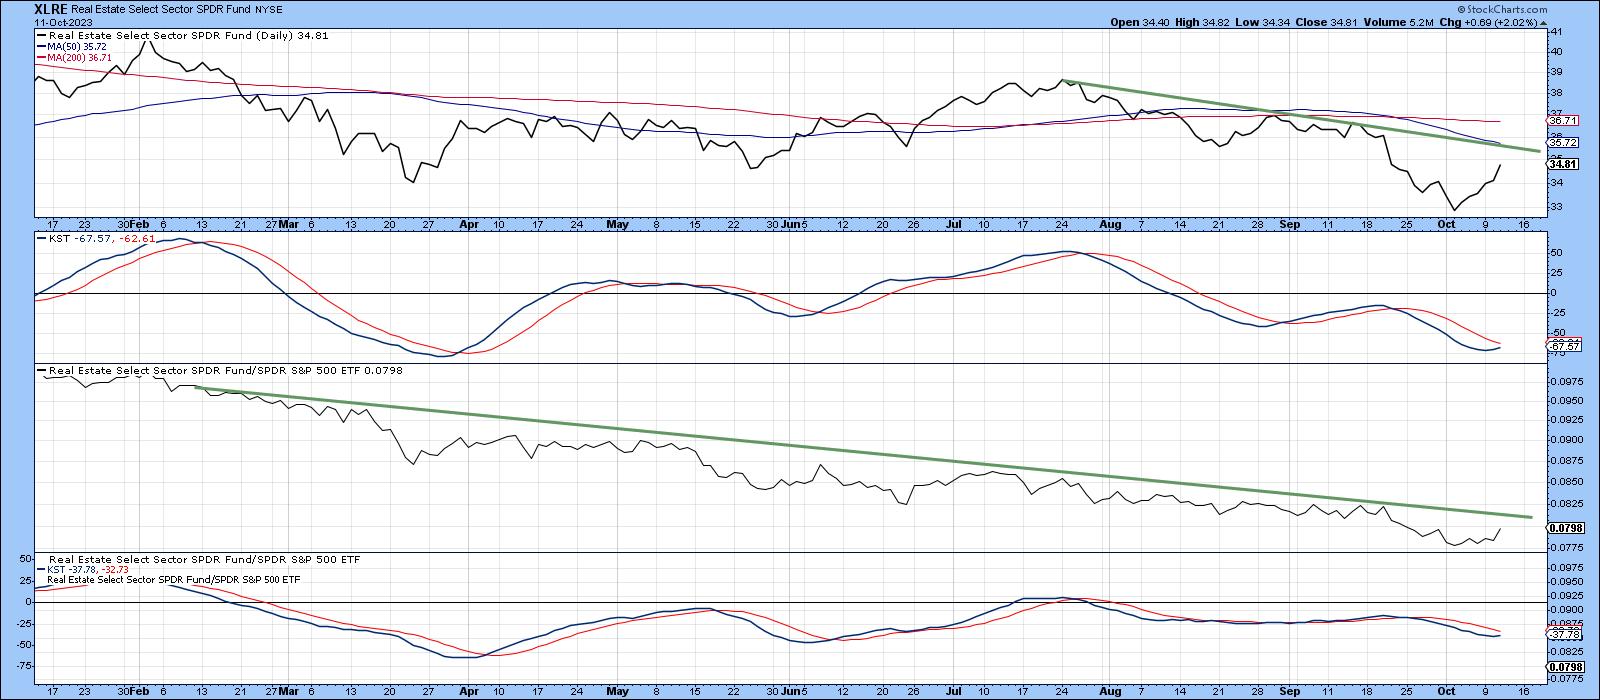
REITS Getting Ready to Rally, But What Happens After That?
by Martin Pring,
President, Pring Research
Several short-term charts suggest the SPDR Real Estate ETF (XLRE) is getting ready to rock and roll, thereby indicating an extension to this week's rebound is in the cards. It's possible that the expected rally could result in shifting some of the longer-term indicators...
READ MORE
MEMBERS ONLY

The Best Cybersecurity Stocks Showing Profitable Investment Opportunities
by Karl Montevirgen,
The StockCharts Insider
KEY TAKEAWAYS
* Increasing demand for cybersecurity can give cybersecurity stocks a massive boost
* Four cybersecurity stocks showing technical strength are PANW, FTNT, CRWD, and ZS
* Keep an eye on the cybersecurity space, especially prior to the top companies' earnings announcement
Cybersecurity companies occupy a unique space. It can never...
READ MORE
MEMBERS ONLY

AMD Stock Projection: Price Could Soar Over 50%
by Jayanthi Gopalakrishnan,
Director of Site Content, StockCharts.com
KEY TAKEAWAYS
* The StockCharts Technical Rank is indicating that AMD's stock price is strengthening
* A bull flag pattern and potential resistance levels can help to make a projection on AMD's stock price
* AMD stock's relative performance and momentum are improving, which means the stock...
READ MORE
MEMBERS ONLY
Breadth Indicators Illustrate Recent Dire Conditions
by David Keller,
President and Chief Strategist, Sierra Alpha Research
In this edition of StockCharts TV'sThe Final Bar, guest Doug Ramsey, CFA CMT of The Leuthold Group talks small-cap underperformance and shares two breadth indicators illustrating the recently dire conditions. Host David Keller, CMT declares the 200-day moving average "the most important line in the...
READ MORE
MEMBERS ONLY

A Closer Look at Long Bonds and The US Dollar
The next direction of the long bonds is crucial in determining the macro.
First, after a wrecking ball crash and ahead of the FOMC, we could surmise that a bottoming-like action defines the last several trading days. Our Real Motion indicator shows a mean reversion. The 10-day moving...
READ MORE
MEMBERS ONLY
The Halftime Show: Are Oversold Conditions Real? The Bullish Percent Says So
by Pete Carmasino,
Chief Market Strategist, Chaikin Analytics
On this week's edition of StockCharts TV'sHalftime, Pete reviews the bullish percent index; with all the market talking about oversold conditions, the bullish percent makes that narrative make more sense. He then reviews the 20+ Year Treasury Bond ETF (TLT) and deciphers what is happening on...
READ MORE
MEMBERS ONLY
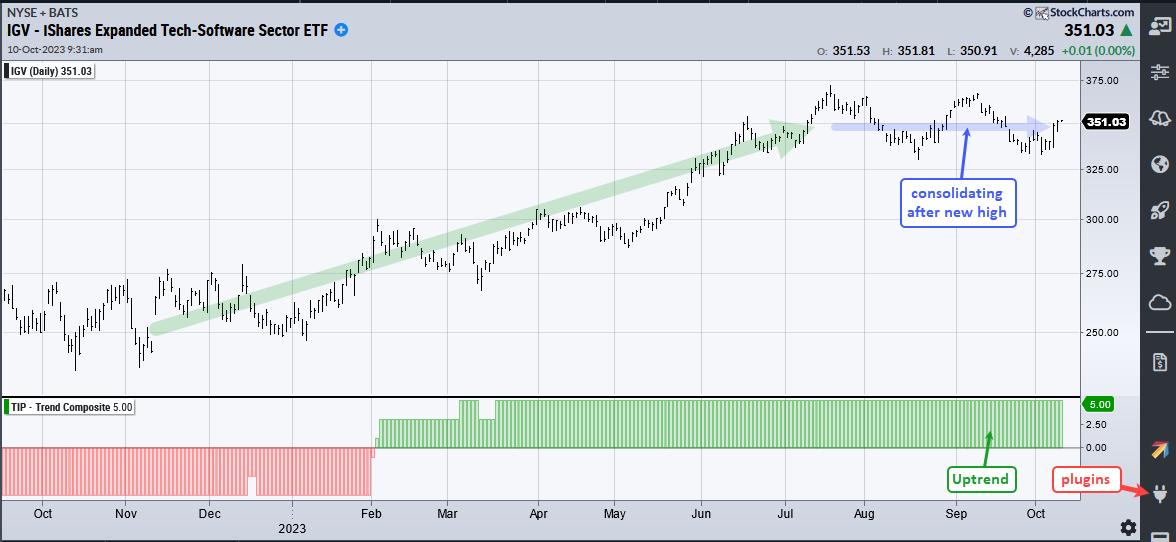
Trading the Swing within the Pattern: IGV Example
by Arthur Hill,
Chief Technical Strategist, TrendInvestorPro.com
Chartists looking to get the jump on a bigger breakout can turn to the swings within a developing pattern. For example, a Symmetrical Triangle after an advance is a bullish continuation pattern. We can get the jump on a breakout by trading a downswing reversal within the pattern. Let'...
READ MORE
MEMBERS ONLY
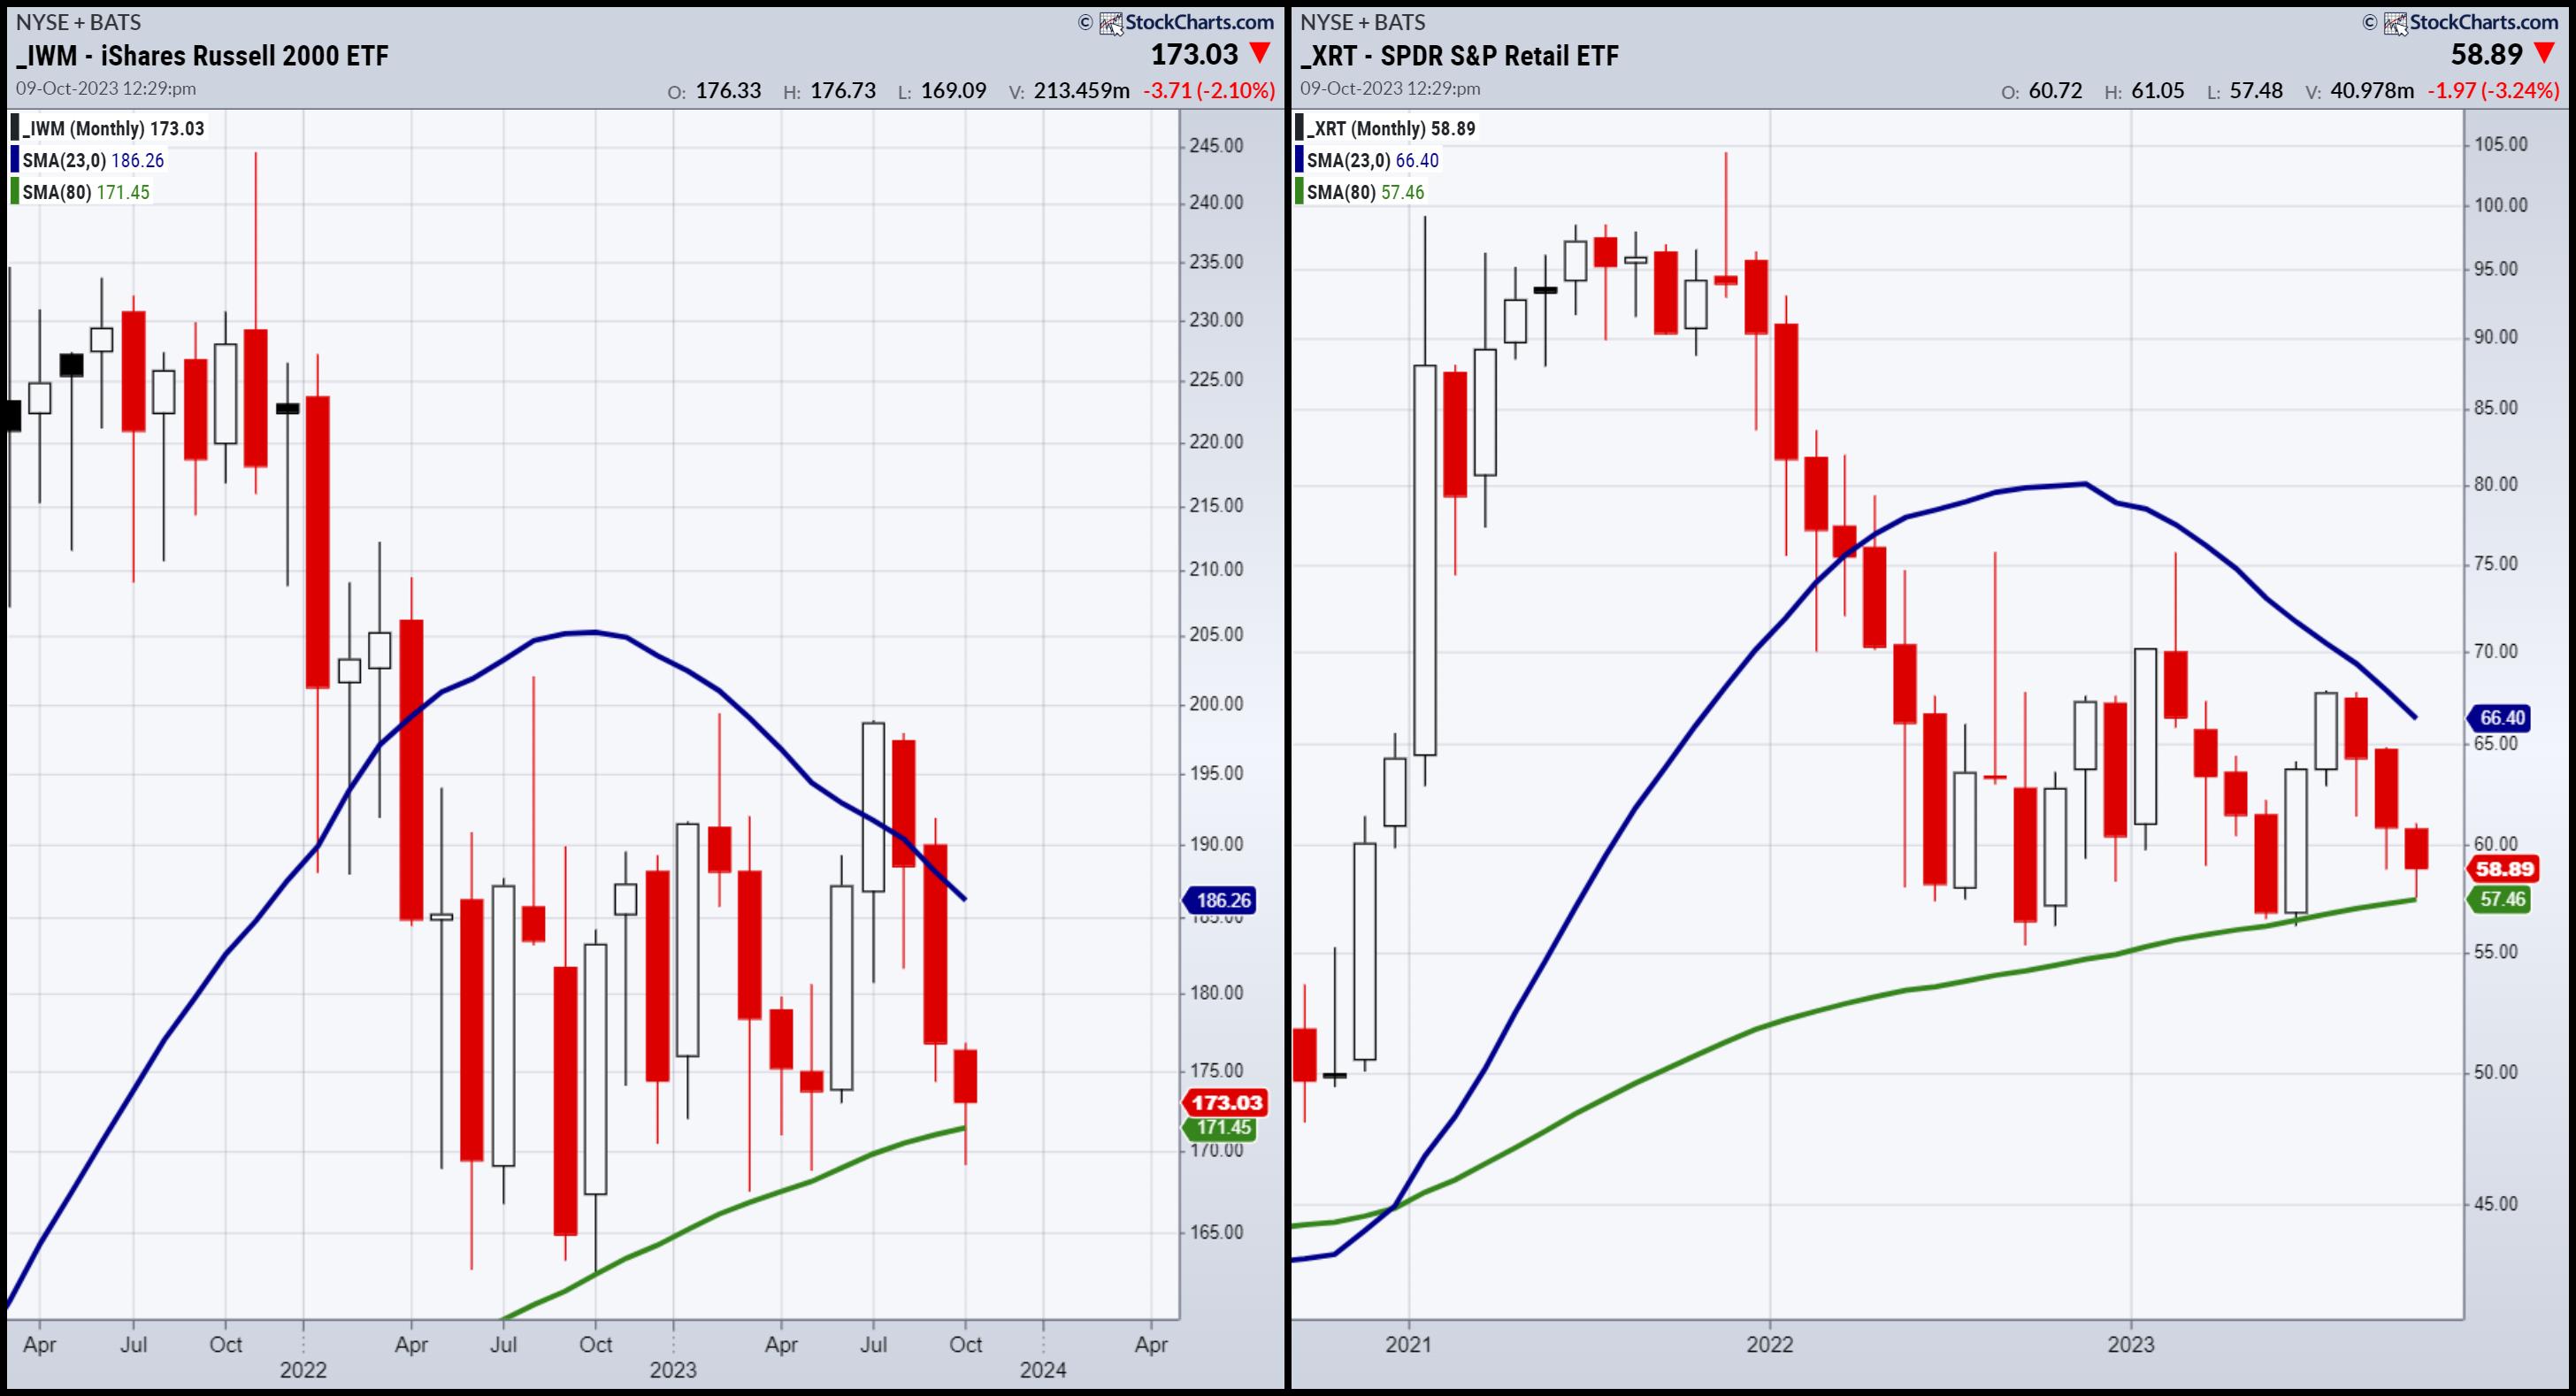
What We Will Use to Ascertain the Market's Next Moves
For consistency, here are the key go-tos during an uncertain time in the market:
1. The next direction of long bonds (TLT).
2. The next direction of the small caps and retail sectors (IWM, XRT).
3. The next direction of commodities, all of them, but particularly the agricultural ones,...
READ MORE
MEMBERS ONLY

Maximizing Profits: Three Stocks in Three Phases
by David Keller,
President and Chief Strategist, Sierra Alpha Research
KEY TAKEAWAYS
* The accumulation phase is marked by higher highs and higher lows, as investors push the price onward and ever upward.
* Stocks in the distribution phase are trending lower, with the price usually below two downward-sloping moving averages.
* A symmetrical triangle or "coil" pattern is a...
READ MORE
MEMBERS ONLY

MEM TV: Here's What To Do With Base Breakouts and Other Bullish Signals

by Mary Ellen McGonagle,
President, MEM Investment Research
In this episode of StockCharts TV'sThe MEM Edge, Mary Ellen reviews the bullish bias that's shaping up in the markets as high-growth areas begin to turn positive. She also provides insights into what's driving this price action, as well as what to be...
READ MORE
MEMBERS ONLY

Stock Market Ends Week on Positive Note; Market Internals May Be Turning Bullish
by Jayanthi Gopalakrishnan,
Director of Site Content, StockCharts.com
KEY TAKEAWAYS
* Strong September jobs report caused an initial shock but investors overcame it and the broader stock market indexes all closed higher
* Volatility remained below 20 during the trading day
* In addition to Technology and Communication Services, Financials may be showing bullish strength
September's strong labor market—...
READ MORE