MEMBERS ONLY
Dave's September 2025 Stock Picks: 3 Charts That Worked… and 2 That Didn’t

by David Keller,
President and Chief Strategist, Sierra Alpha Research
Dave revisits five stocks from the September Top Ten Charts episode to see how they’ve evolved. He reviews NVDA, AXP, MSI, MRK, and the SIL, explaining which setups worked, which failed, and the lessons to carry forward. From short ideas that didn’t pan out to breakout patterns and...
READ MORE
MEMBERS ONLY

Taking Stock of the Small-Cap Record High: Here's How High IWM Could Go
The Russell 2000 ETF (IWM) logged a record weekly close, triggering a bullish breakout target of $322. Explore why small-caps may thrive with Fed rate cuts, supportive seasonality, and strong relative strength versus large caps....
READ MORE
MEMBERS ONLY

Week Ahead: NIFTY Faces Resistance at These Levels; RRG Indicates Weakening Outpacing Shifts Within Sectors

by Milan Vaishnav,
Founder and Technical Analyst, EquityResearch.asia and ChartWizard.ae
The price action in the Nifty reflects a potential breakout buildup. But will it be able to break out of the resistance? Here's what you need to look for in the charts....
READ MORE
MEMBERS ONLY

Sector Rotation Points to Large-Cap Growth Stocks

by Julius de Kempenaer,
Senior Technical Analyst, StockCharts.com
Julius takes a look at the current sector rotation, in combination with growth-value and size rotation. Combining these Relative Rotation Graphs shows strength concentrating in large-cap growth and the Tech, Discretionary, and Communication Services sectors. From this vantage point, we can see continued strength for the S&P 500...
READ MORE
MEMBERS ONLY

Simple Yet Powerful RSI Pullback Signal

by Joe Rabil,
President, Rabil Stock Research
In this video, Joe shows viewers how to use a deep pullback in RSI as a buying opportunity. He uses two different settings for RSI in order to identify when a stock is a getting a great setup during an uptrend, and presents several examples on weekly and daily charts....
READ MORE
MEMBERS ONLY

Offense Still Crushing Defense
by David Keller,
President and Chief Strategist, Sierra Alpha Research
While technology stocks have stalled out over the last six weeks, other growth sectors have stepped into a leadership role. Here are the charts Dave uses regularly to track leadership themes, and identify when new sectors are improving in relative strength terms....
READ MORE
MEMBERS ONLY
Pre-FOMC Setup: S&P 500 Calm Before the Fed

by Frank Cappelleri,
Founder & President, CappThesis, LLC
Frank Cappelleri analyzes the S&P 500’s unusual calm ahead of the Fed, highlighting trend signals, failed bearish patterns, and key GoNoGo charts....
READ MORE
MEMBERS ONLY

These Asset Relationships Could Be About to Signal Some Important Changes Ahead

by Martin Pring,
President, Pring Research
Martin explains how analyzing inter-asset relationships can give important insights into the market -- and what those relationships are telling us right now....
READ MORE
MEMBERS ONLY

RSI Overbought? Why That Could Signal Big Gains Ahead
by David Keller,
President and Chief Strategist, Sierra Alpha Research
Join Dave as he explains how traders often get into trouble by thinking of “overbought” stocks as being bearish setups. While an RSI over 70 can often lead to short-term pullbacks, Dave explains that they can also signal the strength of a long-term uptrend phase. He uses Motorola Solutions (MSI)...
READ MORE
MEMBERS ONLY

Bonds Still Underperforming, Best Sectors for Hunting, IWM Starts to Leads SPY, Healthcare and Biogen Perk Up

by Arthur Hill,
Chief Technical Strategist, TrendInvestorPro.com
TLT broke out, but is still underperforming SPY; meanwhile, IWM has begun outperforming SPY. Arthur explains how to find the ideal "hunting grounds" for sectors....
READ MORE
MEMBERS ONLY

6,555 Target Hit!
by Frank Cappelleri,
Founder & President, CappThesis, LLC
Despite skepticism, the S&P reached Frank's upside target of 6,555. Frank breaks down how we got here and what it means for ongoing market patterns....
READ MORE
MEMBERS ONLY
Is the SPX Exhausted?
by Joe Rabil,
President, Rabil Stock Research
This week, Joe breaks down the importance of focusing on Price and using indicators as supporting tools. He shows how the daily SPX chart has continued to make higher highs and higher lows, explaining that, as the ADX shows weakness, we need price to confirm this signal. Joe then covers...
READ MORE
MEMBERS ONLY

Where Has Industrials Leadership Gone? A Sector Drill Down
With Industrials now in consolidation mode, Mike highlights underperforming single-stock culprits and explains why the groundwork is in place for a late-year rally....
READ MORE
MEMBERS ONLY

The CPI is Coming Out Wednesday: Here is Something to Be Aware of
by Martin Pring,
President, Pring Research
As August CPI data looms, Martin looks at the chart and analyzes whether an upside reversal could be in the cards....
READ MORE
MEMBERS ONLY
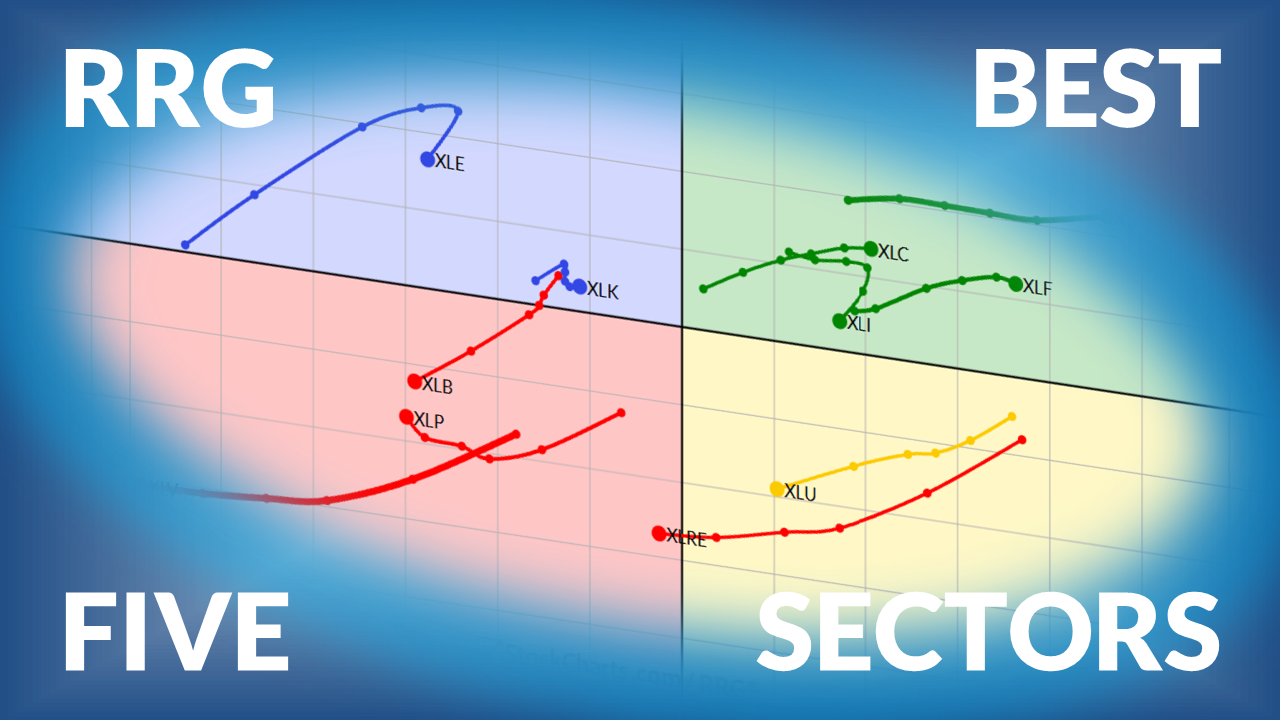
The Best Five Sectors This Week, #35
by Julius de Kempenaer,
Senior Technical Analyst, StockCharts.com
Julius de Kempenaer presents his weekly update on the top five sectors on the leaderboard, and the movement under the surface....
READ MORE
MEMBERS ONLY

Pullback or Pitfall? Let the 21-Day EMA Be Your Guide
by David Keller,
President and Chief Strategist, Sierra Alpha Research
Dave explains how the 21-day exponential moving average can help confirm trend phases, validate signals from other moving averages, and serve as an essential risk management tool for traders....
READ MORE
MEMBERS ONLY

Before CPI and PPI: 5 Things to Watch This Week

by Jayanthi Gopalakrishnan,
Director of Site Content, StockCharts.com
Rate cuts on deck? Look for these signals in small caps, TLT, gold, and more to help you position your portfolio ahead of this week's data....
READ MORE
MEMBERS ONLY

Major AI Announcement Sparks Repricing Across Tech Stocks

by Mary Ellen McGonagle,
President, MEM Investment Research
As Broadcom surges following the announcement of a $10 billion AI chip deal, Mary Ellen breaks down AVGO's technicals and what makes it a market leader....
READ MORE
MEMBERS ONLY

New Highs vs New Lows; XLC Goes Beast Mode; Risk is On; Dissecting Gold; A Cyber Setup
by Arthur Hill,
Chief Technical Strategist, TrendInvestorPro.com
This week, new highs are consistently outpacing new lows. The Communication Services sector is leading the pack, gold is surging, and there's a cybersecurity stock setting up for a big move. Read all about the stock market's price action here....
READ MORE
MEMBERS ONLY

The World is Breaking Out All Over
by Martin Pring,
President, Pring Research
A plethora of breakouts suggests that international markets have much further to run on the upside. Martin reviews where the principal regions of the world currently stand....
READ MORE
MEMBERS ONLY

Is a Bear Market Starting? History Says Watch These Months

by Tom Bowley,
Chief Market Strategist, EarningsBeats.com
Tom recaps the week as September trading begins with weakness across major indices. He reviews market performance, sector trends, and key stock action. From there, he turns his attention to the history of bear markets, pointing out when they historically start, and explains why current conditions, including strong accumulation trends...
READ MORE
MEMBERS ONLY

MACD Reverse Divergence: Hidden Power in the Charts
by Joe Rabil,
President, Rabil Stock Research
Joe shares a lesson on the MACD reverse divergence pattern—also known as hidden divergence—and explains why it can be a powerful signal in combination with low ADX or strong ADX conditions. He highlights multiple stock examples showing this setup, then reviews the S&P market conditions, discussing...
READ MORE
MEMBERS ONLY

Mortgage Rates Hit 11-Month Low as Homebuilder Stocks Surge
With mortgage rates trending lower, homebuilder ETFs have been rising. Here's what traders and investors should watch next. ...
READ MORE
MEMBERS ONLY

Week Ahead: Cautious Start Likely as Nifty Moves Towards This Crucial Support Zone
by Milan Vaishnav,
Founder and Technical Analyst, EquityResearch.asia and ChartWizard.ae
The Nifty is at a critical support level. A break below this level could mean a deeper correction....
READ MORE
MEMBERS ONLY

Is Consumer Discretionary About to Take Over the Market?
by Julius de Kempenaer,
Senior Technical Analyst, StockCharts.com
Julius breaks down the latest asset class and sector rotations in order to show where real market strength is building. Stocks continue to outperform bonds, but the spotlight is on sectors: technology remains strong, financials and industrials are gaining, and consumer discretionary is accelerating with broad participation. Meanwhile, defensive groups...
READ MORE
MEMBERS ONLY
Is It Time to Think Small in a Big Way?
by Martin Pring,
President, Pring Research
The NYSE/S&P ratio has been in a downtrend for seventeen years, but is a reversal finally underway? What does the picture look like for small-caps going forward?...
READ MORE
MEMBERS ONLY

Two Volume Indicators Every Investor Should Know
by David Keller,
President and Chief Strategist, Sierra Alpha Research
Dave explains why volume indicators, including the Accumulation/Distribution Line and Chaikin Money Flow, still matter in today’s markets. Using NVDA’s earnings, the S&P 500, WMT, and EAT as examples, he shows how volume trends can reveal accumulation or distribution beneath the surface, even when price...
READ MORE
MEMBERS ONLY

From Slump to Surge: Why Investors Are Smiling Again
by Jayanthi Gopalakrishnan,
Director of Site Content, StockCharts.com
Stocks surged as Powell's rate-cut hints lifted markets. Dow hit a record, Nasdaq rebounded, and small caps rallied. Here's what it means for investors....
READ MORE
MEMBERS ONLY
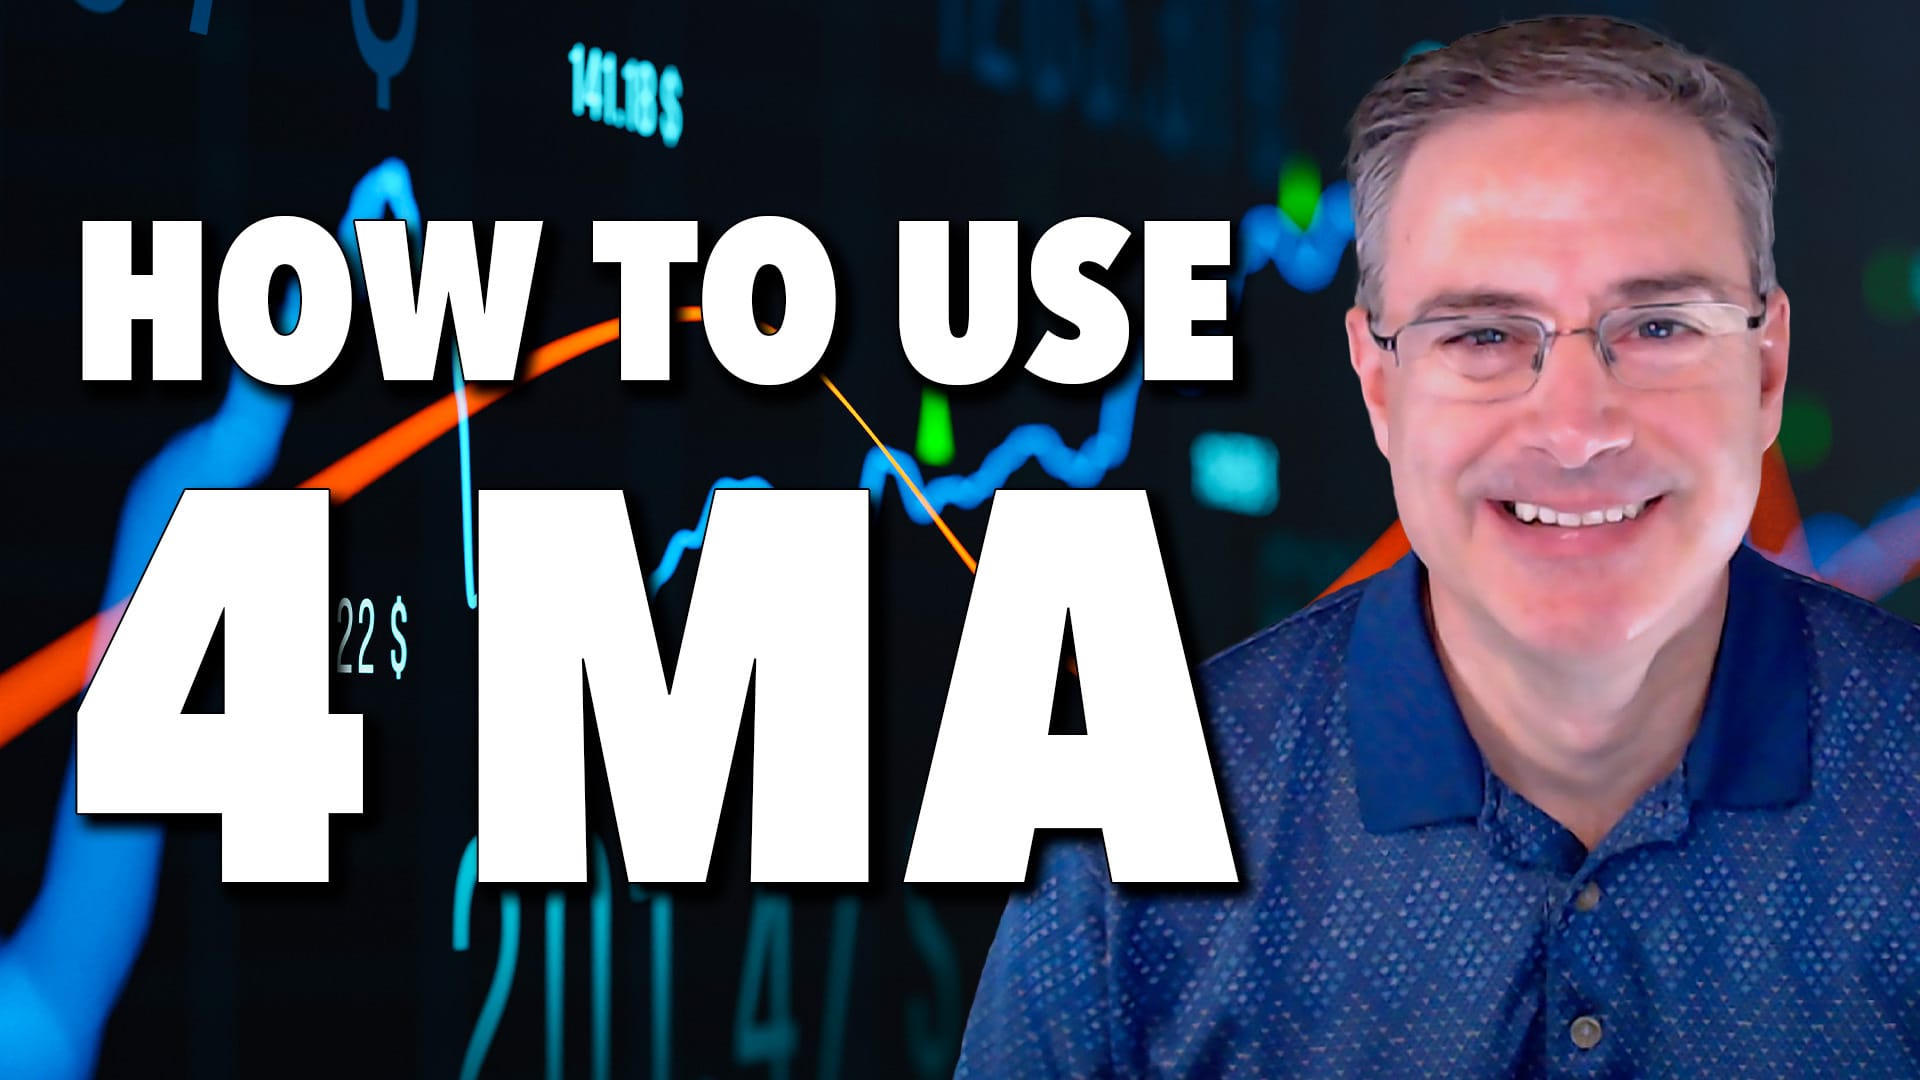
How to Use the 4 MA for Better Timing in Trading & Investing
by Joe Rabil,
President, Rabil Stock Research
In this video, Joe demonstrates how to apply the 4 simple moving average (4 MA) as both a short-term trading tool and a longer-term timing guide. He explains how this moving average can help identify opportunities, manage pullbacks, and improve decision-making across multiple time frames. Joe then reviews the current...
READ MORE
MEMBERS ONLY

S&P 500 Breakouts, Bitcoin Risks & Uber’s Next Move
by Frank Cappelleri,
Founder & President, CappThesis, LLC
In this market update, Frank takes a close look at the S&P 500, key indices, ETFs, crypto, and a recent trade idea. Frank compares the 2025 market to 2020 patterns, reviewing corrections and highlighting bullish and bearish setups. He focuses on weekly Bollinger Bands, GoNoGo charts, sector performance...
READ MORE
MEMBERS ONLY

Financials and Industrials Are Key to the Rally as Tech Takes a Breather
What to watch ahead of Powell: S&P 500 RSI divergence, NVDA under 20-day MA, key levels at 6212/6025/5852; can Financials and Industrials lead?...
READ MORE
MEMBERS ONLY

Short-Term Market Swings: A Gentle Rhythm of Short-Term Bounces
by Frank Cappelleri,
Founder & President, CappThesis, LLC
Get the latest S&P 500 analysis with a focus on RSI negative divergence, short-term swing setups, and market breadth trends. Learn what current patterns mean and how to spot the next move....
READ MORE
MEMBERS ONLY

Can Gold Defy Gravity and Break to the Upside?
by Martin Pring,
President, Pring Research
Why does gold look ready to "defy gravity"? Martin Pring explains the technical signs....
READ MORE
MEMBERS ONLY
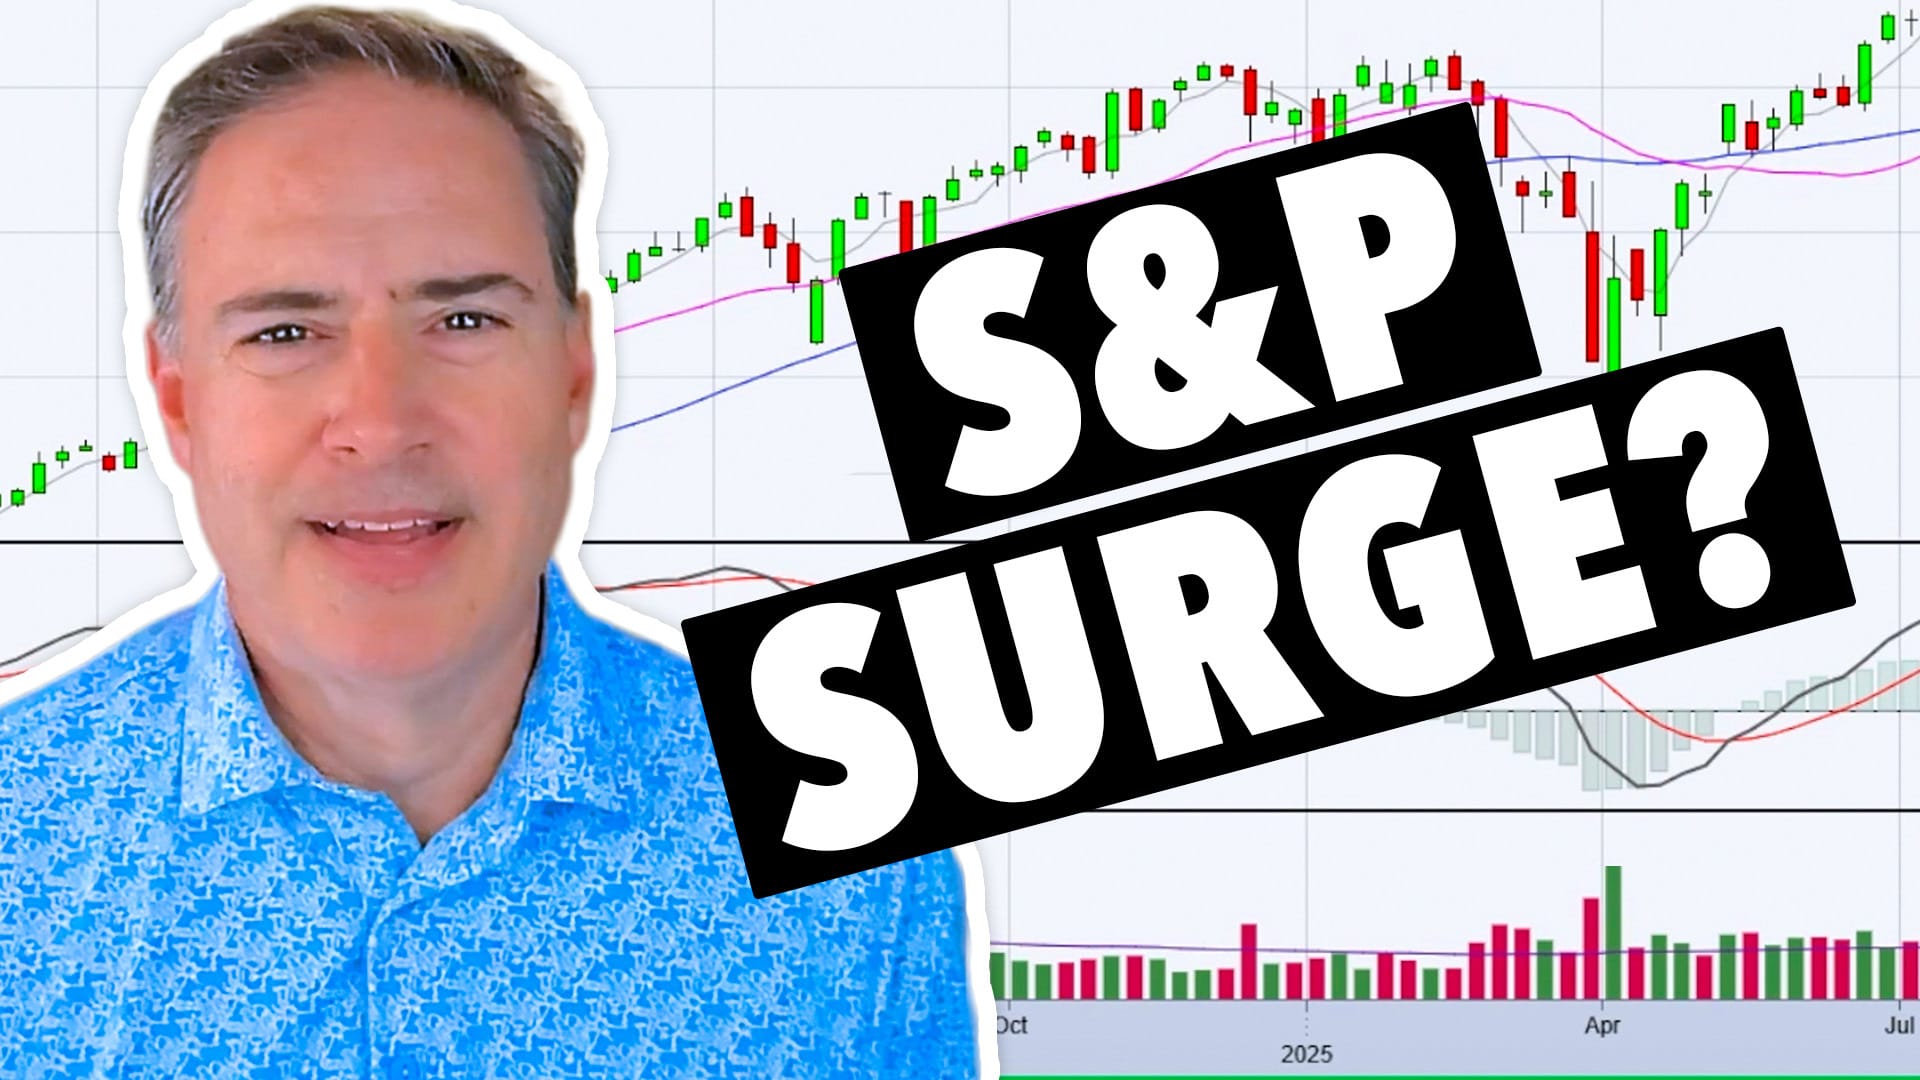
Is the S&P 500 About to Surge?
by Joe Rabil,
President, Rabil Stock Research
Joe analyzes the S&P 500’s current sequential wave pattern and, from there, explains how to spot a shift into a surging market phase. He breaks down key support and resistance levels on the SPY daily chart, evaluates the QQQ and IWM for signs of market strength, and...
READ MORE
MEMBERS ONLY

What to Make of the Small-Cap Rally: A Closer Look at IJR and IWM
Small-cap stocks are showing signs of strength. Investors should keep an eye on the performance of IWM and IJR, two small-cap ETFs, to determine if the small-cap rally has legs....
READ MORE
MEMBERS ONLY

This Week’s Stock Market Winners — And What’s Driving Them
by Mary Ellen McGonagle,
President, MEM Investment Research
Join Mary Ellen as she breaks down the latest market trends! The highlight of the show is a deep dive into the consumer discretionary sector, where Mary Ellen analyzes leading industry groups like homebuilders, apparel, and specialty retail, and explains why this sector continues to show relative strength. She shares...
READ MORE
MEMBERS ONLY

The Best Five Sectors, #31
by Julius de Kempenaer,
Senior Technical Analyst, StockCharts.com
Julius presents his weekly update on US sector rotation based on Relative Rotation Graphs....
READ MORE