MEMBERS ONLY
The Best Five Sectors, #22

by Julius de Kempenaer,
Senior Technical Analyst, StockCharts.com
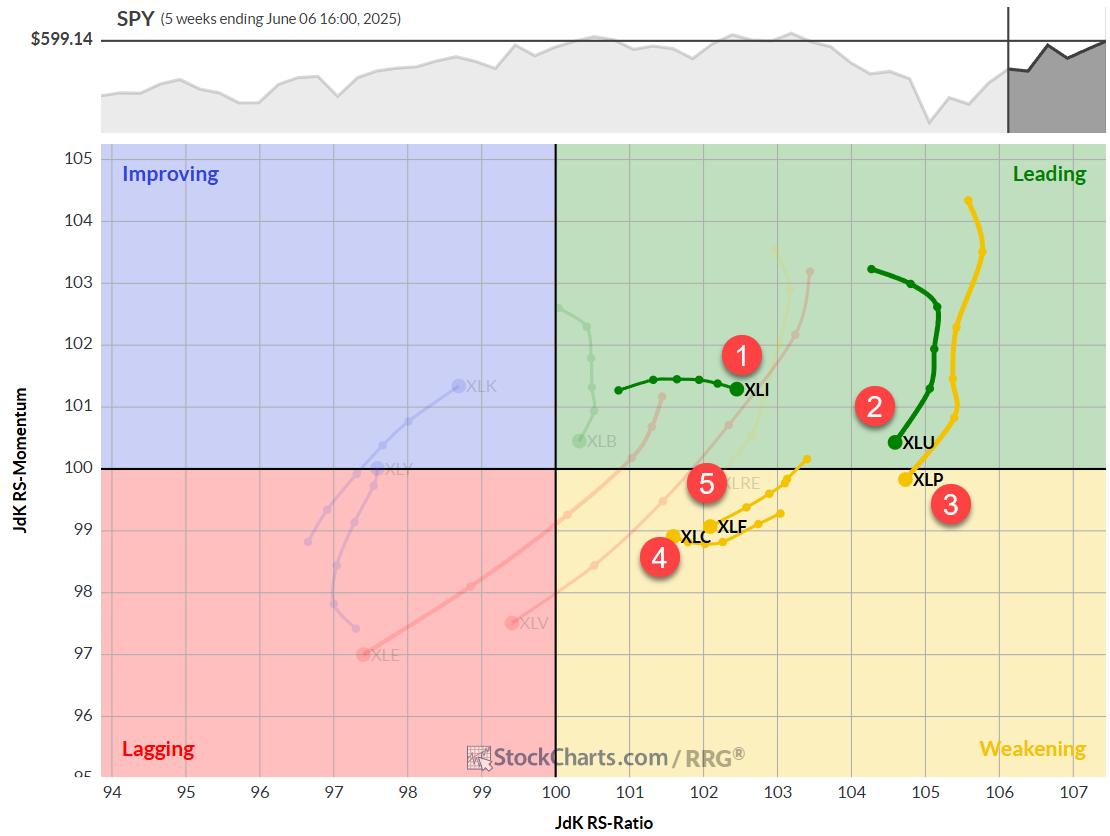
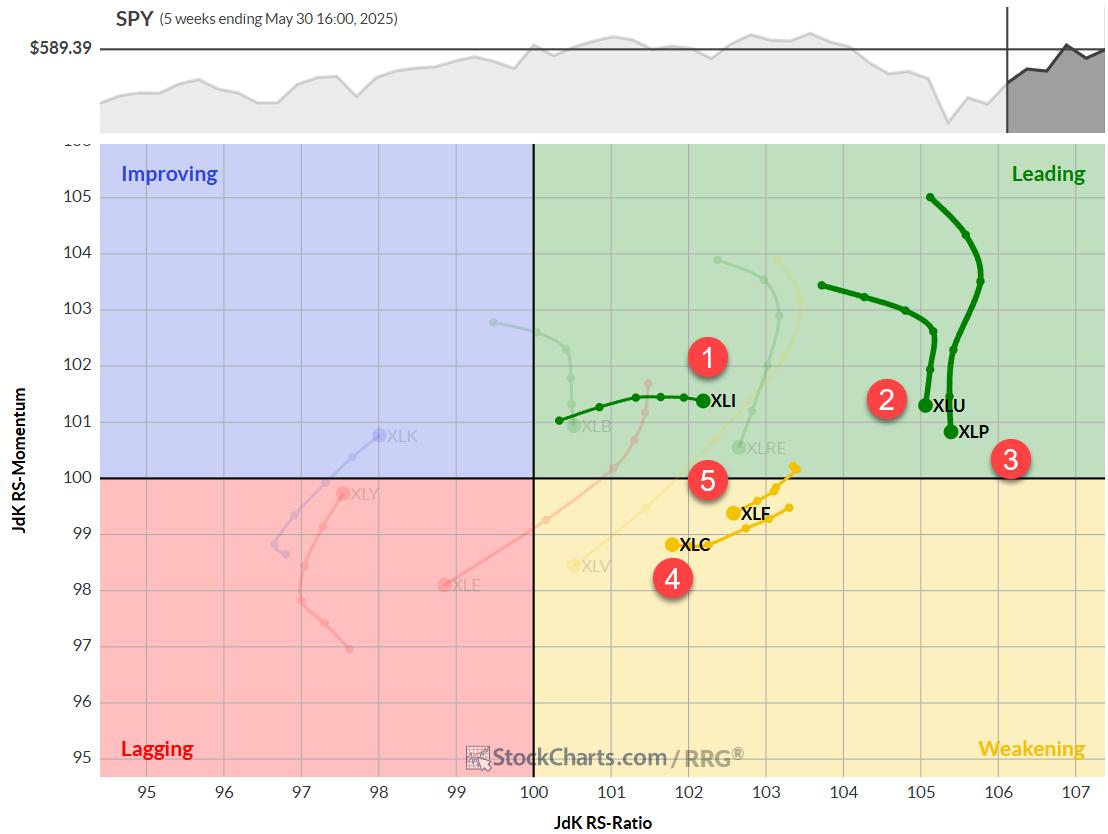
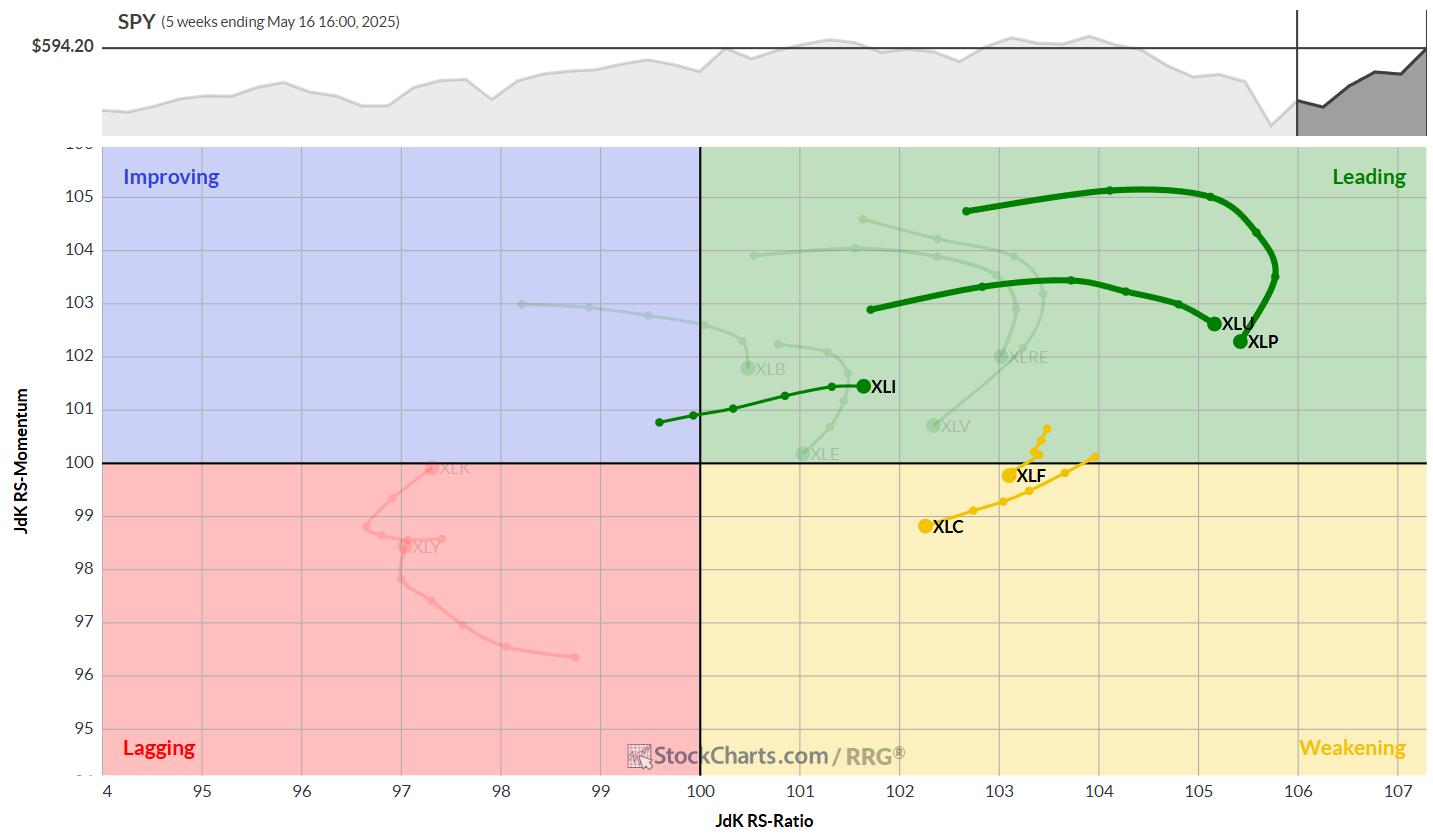
Sector Rotation: A Week of Stability Amidst Market Dynamics
Last week presented an intriguing scenario in our sector rotation portfolio.
For the first time in recent memory, we witnessed complete stability across all sector positions -- no changes whatsoever in the rankings.
1. (1) Industrials - (XLI)
2. (2) Utilities...
READ MORE
MEMBERS ONLY

Silver's Surge is No Fluke—Here's the Strange Ratio Driving It

by Karl Montevirgen,
The StockCharts Insider
Silver just hit a 13-year high, breaking above a key resistance level that could ignite a major bull run. Some metals analysts now say a rally to $40 isn't a long shot, but a matter of time. So, are the odds finally shifting in favor of the bulls?...
READ MORE
MEMBERS ONLY
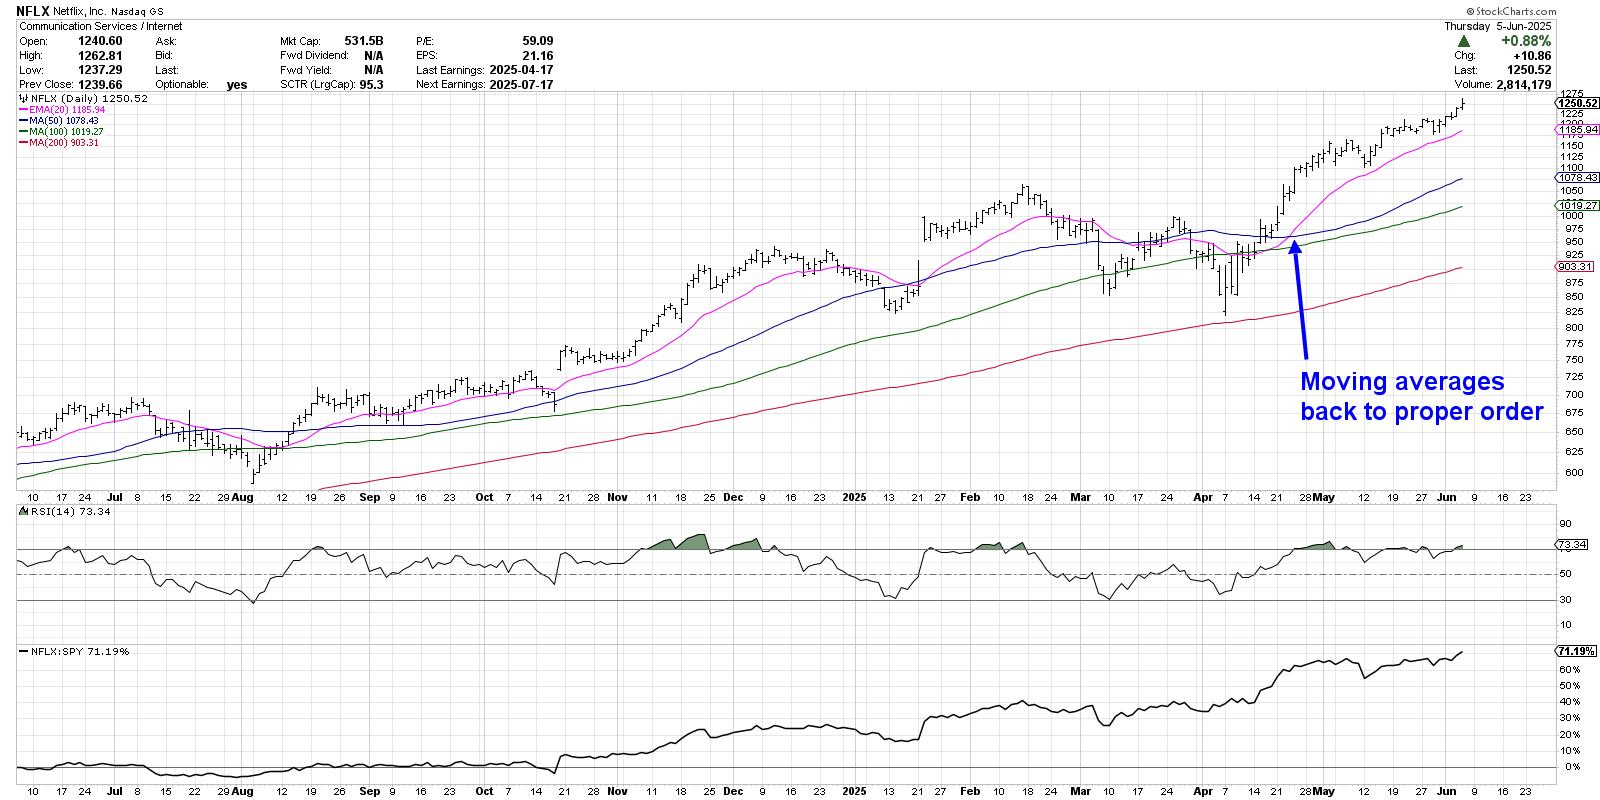
Three Charts Showing Proper Moving Average Alignment

by David Keller,
President and Chief Strategist, Sierra Alpha Research
I'm a huge fan of using platforms like StockCharts to help make my investment process more efficient and more effective. The StockCharts Scan Enginehelps me identify stocks that are demonstrating constructive technical configuration based on the shape and relationship of multiple moving averages.
Today, I'll share...
READ MORE
MEMBERS ONLY

Clusters of Long Winning Streaks: What They're Telling Us

by Frank Cappelleri,
Founder & President, CappThesis, LLC
Recently, the S&P 500 ($SPX) has been racking up a good number of wins.
Since late April, the index has logged its third winning streak of at least five: a nine-day streak from April 22–May 2 and a six-day streak from May 12–May 19. That makes...
READ MORE
MEMBERS ONLY
Why ADX Can Mislead You — And How to Avoid It

by Joe Rabil,
President, Rabil Stock Research
In this video, Joe walks through a comprehensive lesson on using the ADX (Average Directional Index) as part of a technical analysis strategy. Joe explains the key components of the ADX indicator, how to interpret DI+ and DI- lines, and how to identify strong or weak trends in the market....
READ MORE
MEMBERS ONLY

Strategic Chaos or Tactical Goldmine? What QQQ's Chart is Whispering Right Now
by Karl Montevirgen,
The StockCharts Insider
Despite the uncertainty prevailing in the markets, the Nasdaq 100 Index ($NDX) has proven resilient, perhaps more so than its peer benchmarks. The 90-day trade truce between the U.S. and China, initiated in May, boosted investor confidence. Yet that's now at risk amid mutual accusations of violations....
READ MORE
MEMBERS ONLY
S&P 500 Bullish Patterns: Are Higher Highs Ahead?
by Frank Cappelleri,
Founder & President, CappThesis, LLC
In this market update, Frank breaks down recent developments across the S&P 500, crypto markets, commodities, and international ETFs. He analyzes bullish and bearish chart patterns, identifies key RSI signals, and demonstrates how "Go No Go Charts" can support your technical analysis. You'll also...
READ MORE
MEMBERS ONLY

This Important Metal Could Be on the Verge of a Mega-Breakout

by Martin Pring,
President, Pring Research
Gold has been on a tear since 2022, leaving other metals in the dust. Nevertheless, it's important to remember that the yellow metal has a strong tendency to lead commodities in general, which implies the likelihood of inflationary pressures in the commodity pits going forward. The leads and...
READ MORE
MEMBERS ONLY

How I Find Up-trending Stocks Every Week (Step-by-Step Scan Tutorial)
by David Keller,
President and Chief Strategist, Sierra Alpha Research
In this video, Dave shares his weekly stock scan strategy used to identify bullish stock trends. He illustrates how to set up this powerful scan, reveals the tips and tricks he uses to identify the most constructive patterns, and explains the four winning chart setups that tend to come up...
READ MORE
MEMBERS ONLY

What's Next for Dollar Tree, CrowdStrike, and Broadcom? Watch These Setups

by Jay Woods,
Chief Global Strategist, Freedom Capital Markets
Earnings season may be winding down, but a few standout names could still make headlines this week. If you're looking for potential moves, keep an eye on these three stocks — Dollar Tree, Inc. (DLTR), CrowdStrike Holdings, Inc. (CRWD), and Broadcom, Inc. (AVGO).
Each of these names is at...
READ MORE
MEMBERS ONLY
The Best Five Sectors, #21
by Julius de Kempenaer,
Senior Technical Analyst, StockCharts.com
Staples and Tech Swap Positions Again
The weekly sector rotation continues to paint a picture of a market in flux, with defensive sectors gaining ground while cyclicals take a step back. This week's shifts underscore the ongoing volatility and lack of clear directional trade that's been...
READ MORE
MEMBERS ONLY

Run Your Stock Portfolio Like a Pro Sports Team

by Grayson Roze,
Chief Strategist, StockCharts.com
Manage your stock portfolio like a pro! Learn stock portfolio management, trading strategy, and how to build stock watchlists like a professional investor with this insightful video from Grayson. He shares how to run your portfolio like a championship sports team—organizing stocks like players, keeping top performers in play,...
READ MORE
MEMBERS ONLY
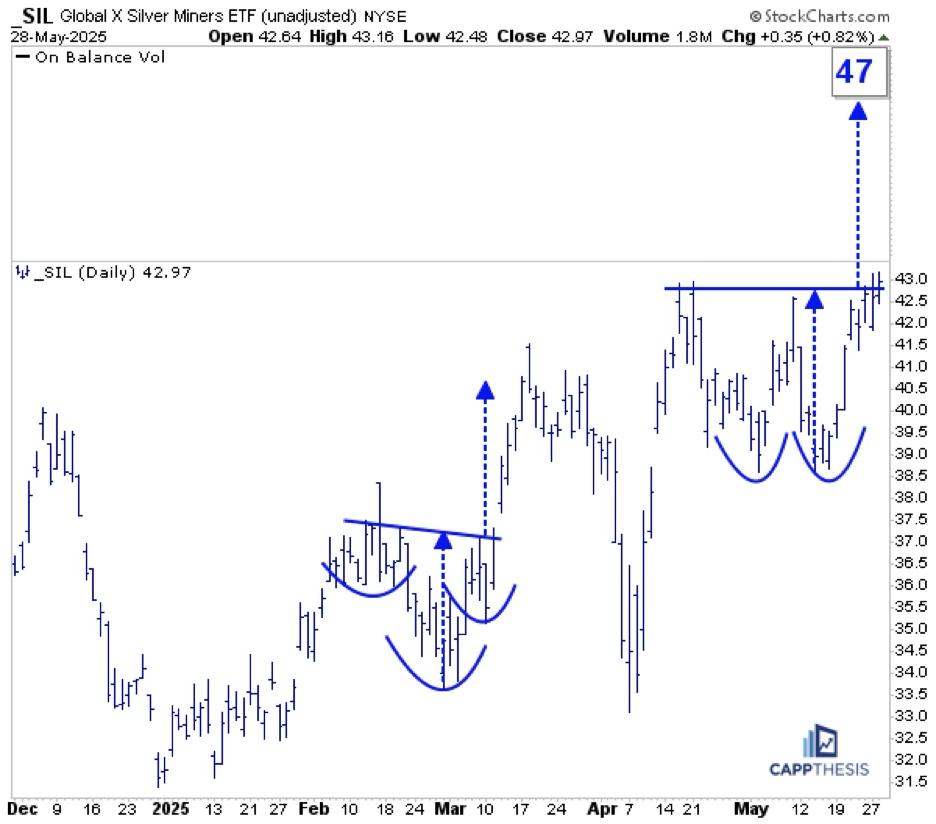
Analyzing SIL, USO, and NVDA: Could These Bullish Patterns Trigger?
by Frank Cappelleri,
Founder & President, CappThesis, LLC
SIL Silver Miners
SIL was among the leaders yesterday and now is close to triggering this double-bottom bullish pattern. Staying above the 43-mark would target 47. That's not a big move, but let's remember that SIL is sporting bullish formations on its longer-term charts, too.
SIL...
READ MORE
MEMBERS ONLY

Nuclear Power Trio: OKLO, SMR, and CCJ in Focus
by Karl Montevirgen,
The StockCharts Insider
Nuclear energy stocks are on a tear, and Oklo Inc. (OKLO), Cameco Corp. (CCJ), and NuScale Power Corporation (SMR) are leading the charge, fueled by presidential executive orders, investor hype, and hopes for a nuclear-powered future.
Is It Time to Go Nuclear?
These names bucked the trend on Wednesday, rising...
READ MORE
MEMBERS ONLY

Top Sectors to Watch + The 18 SMA Setup Every Trader Should Know
by Joe Rabil,
President, Rabil Stock Research
In this video, Joe analyzes which sectors to focus on when selecting new stocks. He demonstrates how to use the 18-period simple moving average (SMA) on monthly, weekly, and daily charts to identify the strongest stock patterns and the best timeframes to trade. He then provides chart analysis on the...
READ MORE
MEMBERS ONLY

Larry Williams on the Fed, Interest Rates & Markets! What's Next?

by Larry Williams,
Veteran Investor and Author
In this must-see market update, Larry Williams returns with timely stock market analysis, trading insights, and macroeconomic forecasts. Discover what's next for the Federal Reserve, interest rates, and inflation — and how it could impact top stocks like Tesla (TSLA), Nvidia (NVDA), Apple (AAPL), and consumer staples (XLP).
This...
READ MORE
MEMBERS ONLY

Smarter Options Trading Starts Here! StockCharts + OptionsPlay

by Tony Zhang,
Chief Strategist, OptionsPlay
In this video, Chip Anderson, President of StockCharts, sits down with Tony for a conversation in the StockCharts studio! During this in-depth Q&A session, Chip and Tony explore the powerful features that make the OptionsPlay add-on a must-have for options traders using the StockCharts platform. They discuss the...
READ MORE
MEMBERS ONLY
Mixed Signals on the Charts? RRG Reveals Market Rotation Tension
by Julius de Kempenaer,
Senior Technical Analyst, StockCharts.com
Confused by mixed market signals? Follow along as Julius analyzes sector rotation, asset rotation, and global market trends using daily and weekly Relative Rotation Graphs (RRGs).
In this video, Julius puts the current sector rotation in perspective on both weekly and daily Relative Rotation Graphs (RRGs). He also examines asset...
READ MORE
MEMBERS ONLY

Five Charts I Am Watching Closely
by Martin Pring,
President, Pring Research
Each week, I monitor numerous charts to see if they have the potential for an important breakout. I tend to look at longer-term ones, because they set the scene as to whether the primary trend is bullish or bearish. That's important information to have, as the magnitude and...
READ MORE
MEMBERS ONLY

The Best Five Sectors, #20
by Julius de Kempenaer,
Senior Technical Analyst, StockCharts.com
Technology Back in Top-5
Last week's market decline of 2-2.5% (depending on the index) has led to some notable shifts in sector performance and rankings.
This pullback, coming after a strong rally, is changing the order of highs and lows on the weekly chart -- a particularly...
READ MORE
MEMBERS ONLY

3 Stocks to Watch While Everyone's Staring at NVIDIA
by Jay Woods,
Chief Global Strategist, Freedom Capital Markets
This week, while everyone else is focused on NVIDIA Corp. (NVDA), we will focus our attention on stocks with earnings that may get overlooked.
We're watching a different group of stocks heading into earnings: Okta, Inc. (OKTA), AutoZone, Inc. (AZO), and Salesforce.com, Inc. (CRM). OKTA and AZO...
READ MORE
MEMBERS ONLY
Automate Your Scans with Ease! Sample Scan Library + Scheduled Scans Walkthrough
by Grayson Roze,
Chief Strategist, StockCharts.com
In this insightful overview, Grayson dives into StockCharts' powerful scanning capabilities. He shows you how to navigate the markets quickly with the sample scan library, and automate your stock screening with the scheduled scans feature.
This video originally premiered on May 23, 2025. Click on the above image to...
READ MORE
MEMBERS ONLY

Moving from Thrust Signals to a Bull Market

by Arthur Hill,
Chief Technical Strategist, TrendInvestorPro.com
The bullish signals stacked up in April and May, but most long-term breadth indicators are still bearish. SPY and QQQ showed signs of capitulation in early April and rebounded into mid April. A Zweig Breadth Thrust triggered on April 24th and several other thrust indicators turned bullish in May. We...
READ MORE
MEMBERS ONLY

Applying Key Ratios to the Broader Market Surge: Are We at the Threshold of a New Trend?
by Karl Montevirgen,
The StockCharts Insider
The financial media is flooded with commentary questioning whether the current rise in stock indexes is sustainable enough to mark the beginning of a new bull market. In short, have we gotten out of the woods, or are we in a clearing with more uncertainty to come?
There are many...
READ MORE
MEMBERS ONLY

MACD + ADX: Spot the Pullbacks Worth Trading
by Joe Rabil,
President, Rabil Stock Research
In this video, Joe shares how to use MACD and ADX indicators to analyze stock pullbacks, focusing on the good while avoiding the weak setups. He explains how these indicators can complement one another. Joe then shows the Summary Page in ACP and how he uses it on a regular...
READ MORE
MEMBERS ONLY

Become the Investor You Aspire to Be: Essential Insights for Success

by Jayanthi Gopalakrishnan,
Director of Site Content, StockCharts.com
Retail traders and investors often don't get the credit they deserve. But in April, they showed they've got serious market smarts.
While headlines screamed about a tanking stock market — remember, post-Liberation Day— retail investors waited patiently. And when the time felt right, they jumped in, adding...
READ MORE
MEMBERS ONLY

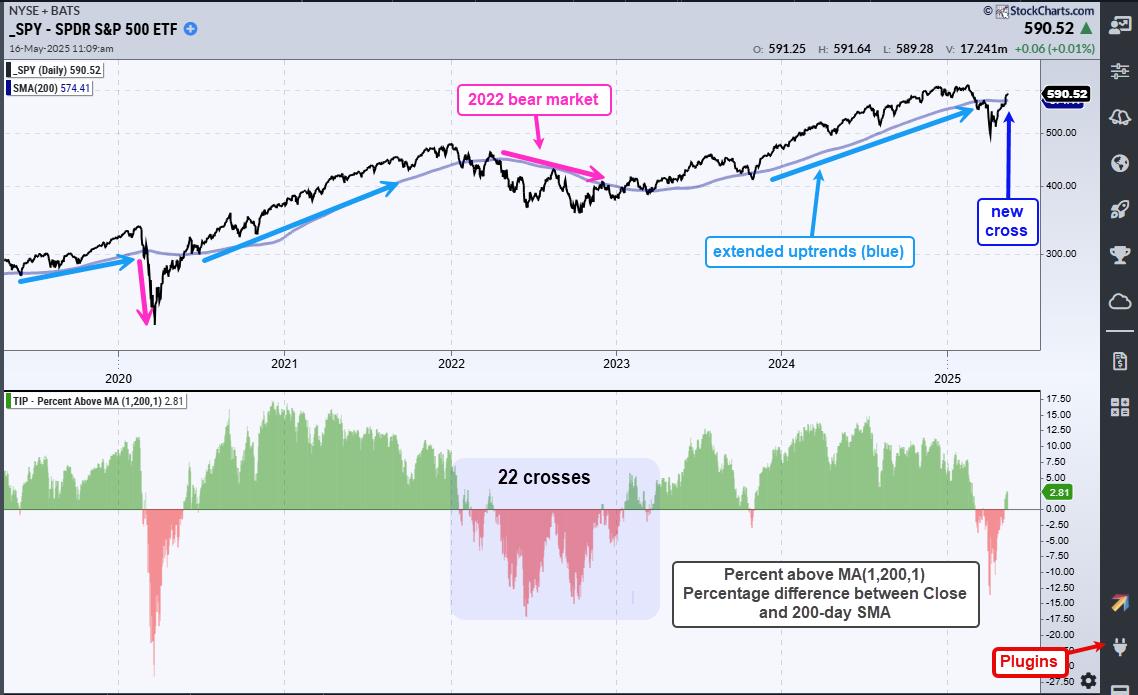
Why the May 31 Close is Pivotal To Determine Primary Trend's Direction
by Martin Pring,
President, Pring Research
Way back in 1988, Robert W. Colby and Thomas A. Meyers authored a classic technical analysis book entitled Encyclopedia of Technical Market Indicators, in which they back-tested the performance of hundreds of market indicators. What caught my eye was their work on 12-month moving average (MA) crossovers, which offered the...
READ MORE
MEMBERS ONLY

Quantum Stocks Explode: Why Traders are Obsessed with QBTS and RGTI Right Now
by Karl Montevirgen,
The StockCharts Insider
If you regularly follow the SCTR Reports (StockCharts Technical Rank), you'll notice that some top-ranked stocks aren't just individual standouts, but groupings that call attention to particular sectors, industries, or subgroups within the two.
That's exactly what happened Tuesday morning. A couple of high-ranking...
READ MORE
MEMBERS ONLY

Earnings Watch: Smart Setups in HD, PANW, and BJ
by Jay Woods,
Chief Global Strategist, Freedom Capital Markets
KEY TAKEAWAYS
* The chart of Home Depot (HD) shows the stock could face resistance from its 200-day moving average.
* Palo Alto Networks (PANW) shows bullish technical momentum and has the potential to breakout toward its all-time high.
* Despite macroeconomic headwinds, BJ's Wholesale (BJ) offers a strong risk/reward...
READ MORE
MEMBERS ONLY
The Best Five Sectors, #19
by Julius de Kempenaer,
Senior Technical Analyst, StockCharts.com
KEY TAKEAWAYS
* Industrials surge to #1 in sector ranking, replacing Real Estate in top 5
* Communication Services showing vulnerability, moving into weakening quadrant
* Utilities and Consumer Staples losing momentum but maintaining leading positions
* Portfolio maintains defensive positioning despite underperformance vs SPY
Sector Rotation Shakeup: Industrials Take the Lead
Another week...
READ MORE
MEMBERS ONLY
SPY and QQQ Recapture their 200-day SMAs - Tips for Reducing Whipsaws and Improving Performance
by Arthur Hill,
Chief Technical Strategist, TrendInvestorPro.com
KEY TAKEAWAYS
* SPY and QQQ surged above their 200-day SMAs this week.
* The signal is bullish, but prone to whipsaws.
* Chartists can reduce whipsaws with smoothing and signal filters.
SPY and QQQ crossed above their 200-day SMAs with big moves on Monday, and held above these long-term moving averages the...
READ MORE
MEMBERS ONLY
Applying Dow Theory to Today's Market: Are We in a Reversal or a New Trend?
by Karl Montevirgen,
The StockCharts Insider
KEY TAKEAWAYS
* Despite being over 100 years old, Dow Theory can still help you identify major turning points in the market.
* Like market breadth and sentiment indicators, many tools might enhance Dow's basic tenets.
* Secondary trends are vulnerable to geopolitical risk, so continue monitoring what's happening...
READ MORE
MEMBERS ONLY
What Sector Rotation Says About the Market Cycle Right Now
by Julius de Kempenaer,
Senior Technical Analyst, StockCharts.com
Where are we in the market cycle? In this video, Julius reviews the sector rotation and asset class performance from the past 2-3 weeks to provide an objective take on where we stand in the current market cycle. Using his signature Relative Rotation Graphs (RRG), he uncovers shifts in momentum...
READ MORE
MEMBERS ONLY

SMCI Stock Rebounds: Why Its SCTR Score is Screaming for Attention
by Jayanthi Gopalakrishnan,
Director of Site Content, StockCharts.com
KEY TAKEAWAYS
* SMCI stock shows strong bullish momentum and is in the Top 10 in the Large Cap stocks category.
* SMCI stock broke above its 200-day moving average and is showing indications of a potential uptrend continuation.
* Using StockCharts tools such as SCTR Score, RSI, and PPO can help identify...
READ MORE
MEMBERS ONLY

The S&P 500 Snapped Back Hard: Now What?
by Frank Cappelleri,
Founder & President, CappThesis, LLC
KEY TAKEAWAYS
* The S&P 500's 14-week RSI hit its lowest point since the 2008 financial crisis.
* Sector ETFs like XLK (Technology) and XLI (Industrials) are showing bullish patterns.
* While the stock market's rapid reversal is encouraging, historical trends show that pullbacks often follow oversold...
READ MORE
MEMBERS ONLY

Tariff Tensions Ease, Nasdaq Soars — But is SMH the Emerging Leader?
by Karl Montevirgen,
The StockCharts Insider
KEY TAKEAWAYS
* The Nasdaq 100 leads with a strong show of breadth.
* Semiconductors are showing signs of recovery, despite lagging major indices.
* SMH's price action may be reaching a turning point.
For months, investors have been on edge over U.S.-China tariff tensions, bracing for everything from...
READ MORE
MEMBERS ONLY

Is It Time for Emerging Markets to Emerge?
by Martin Pring,
President, Pring Research
The US market has been recovering nicely since the April low, but it has actually been outperformed by the rest of the world this year so far. In that respect, Chart 1 shows that a major shift away from the US could well be in the cards.
It is evident...
READ MORE
MEMBERS ONLY
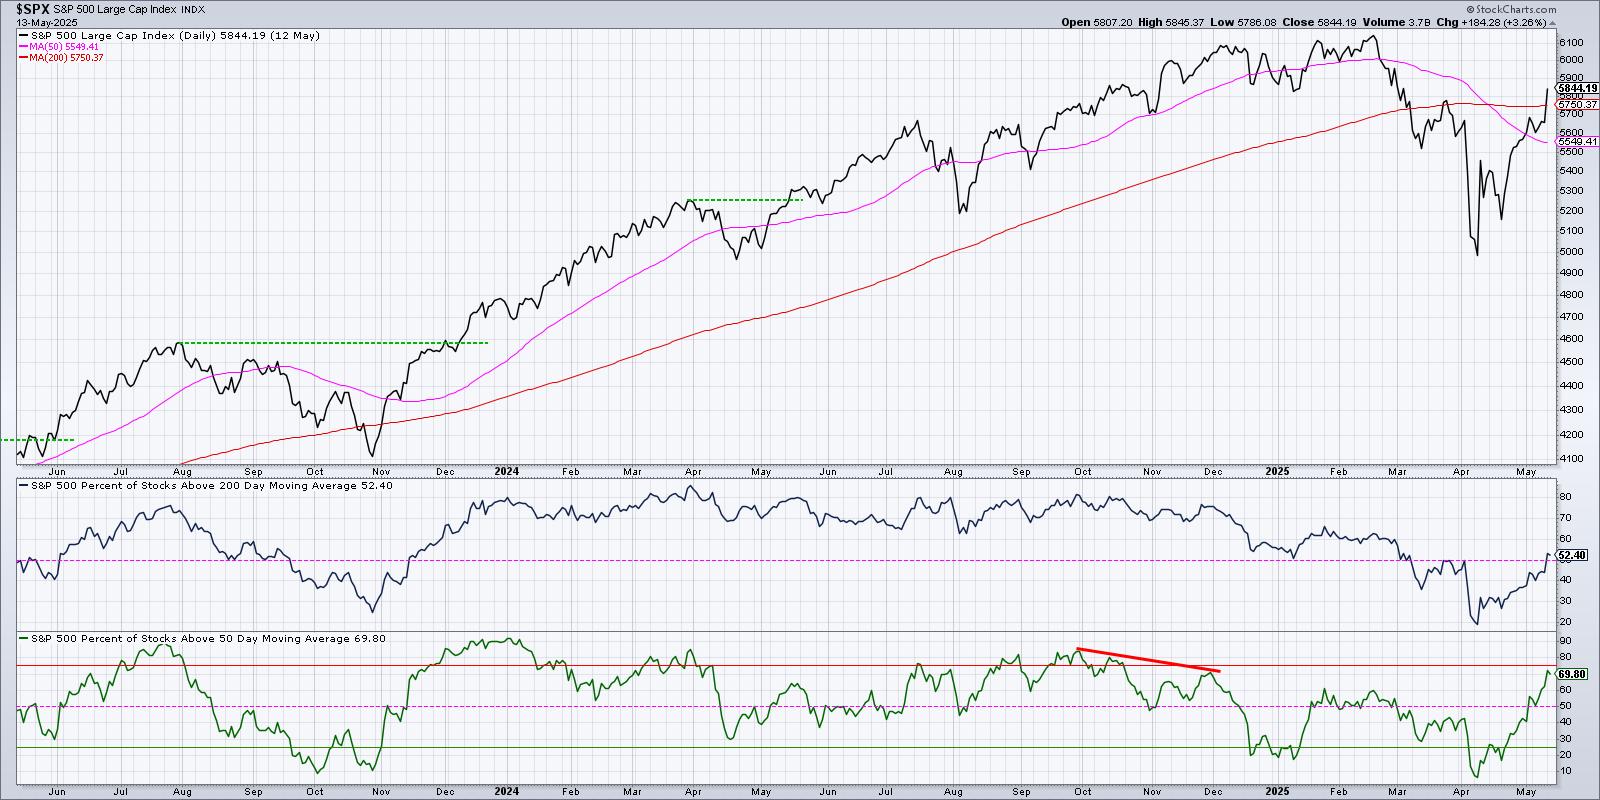
Bullish Breadth Improvement Suggests Further Upside for Stocks
by David Keller,
President and Chief Strategist, Sierra Alpha Research
KEY TAKEAWAYS
* For the first time since early March, over 50% of S&P 500 members are above their 200-day moving average.
* When this long-term breadth indicator has gone from below 25% to above 50%, forward 12-month returns have been positive.
* Investors should keep a watchful eye on the...
READ MORE
MEMBERS ONLY
50% of S&P 500 Stocks Just Turned Bullish – What Happens Next?
by David Keller,
President and Chief Strategist, Sierra Alpha Research
Bullish signal alert! Over 50% of S&P 500 stocks are now above their 200-day moving average.
In this video, Dave explains this key market breadth indicator and what it means for stock market trends. He shows how moving average breadth has reached a bullish milestone, what this means...
READ MORE
MEMBERS ONLY

Unlock the Power of StockCharts' NEW Market Summary Dashboard | Walkthrough & Tips
by Grayson Roze,
Chief Strategist, StockCharts.com
In this in-depth walkthrough, Grayson introduces the brand-new Market Summary Dashboard, an all-in-one resource designed to help you analyze the market with ease, speed, and depth. Follow along as Grayson shows how to take advantage of panels, mini-charts, and quick scroll menus to maximize your StockCharts experience.
This video originally...
READ MORE
