MEMBERS ONLY

New Stocks Breaking Out While Big Tech Falters!

by David Keller,
President and Chief Strategist, Sierra Alpha Research
Mega-cap growth stocks like META, MSFT, and AAPL are showing weakness, but breadth conditions remain strong as other areas of the market push higher. In this episode, David Keller, CMT explores leadership rotation in August 2025, highlighting failed breakouts, key breadth indicators, and how to use scans on StockCharts...
READ MORE
MEMBERS ONLY

S&P 500 Breakouts, Bitcoin Risks & Uber’s Next Move

by Frank Cappelleri,
Founder & President, CappThesis, LLC
In this market update, Frank takes a close look at the S&P 500, key indices, ETFs, crypto, and a recent trade idea. Frank compares the 2025 market to 2020 patterns, reviewing corrections and highlighting bullish and bearish setups. He focuses on weekly Bollinger Bands, GoNoGo charts, sector performance...
READ MORE
MEMBERS ONLY

Financials and Industrials Are Key to the Rally as Tech Takes a Breather
What to watch ahead of Powell: S&P 500 RSI divergence, NVDA under 20-day MA, key levels at 6212/6025/5852; can Financials and Industrials lead?...
READ MORE
MEMBERS ONLY

Tech Stumbles, Market Widens: What Savvy Investors Should Watch Now

by Jayanthi Gopalakrishnan,
Director of Site Content, StockCharts.com
Tech stocks wobble while other sectors firm up. Learn how breadth, equal-weight trends, and small/mid-cap strength can guide your investment decisions....
READ MORE
MEMBERS ONLY

StockCharts Insider: What’s the Deal with the S&P 100, 400, and 600 in the Market Summary?

by Karl Montevirgen,
The StockCharts Insider
Before We Dive In…
Have you ever wondered why the S&P 100, 400, and 600 show up in the Market Summary? They serve a purpose, mainly to give you a quick read on investor sentiment: whether Wall Street is favoring large-, mid-, or small-caps. Today, I’m...
READ MORE
MEMBERS ONLY

Visualizing Breadth and Rotation Using RRG

by Julius de Kempenaer,
Senior Technical Analyst, StockCharts.com
When it comes to understanding what’s really going on beneath the surface of the market, two key concepts come to mind: breadth and rotation. Breadth helps us gauge the participation behind a trend, while rotation reveals where the strength is moving within the universe we’re analyzing. Combine both,...
READ MORE
MEMBERS ONLY

Surprise Sector Surge as Market Leaders Stall!

by Mary Ellen McGonagle,
President, MEM Investment Research
On this week’s show, Mary Ellen McGonagle analyzes a notable shift in market leadership as former top sectors slow and new areas step up. She covers the latest sector performance — from healthcare and biotech to home builders, retail, and small caps — and shows you how to navigate the changing...
READ MORE
MEMBERS ONLY

Short-Term Market Swings: A Gentle Rhythm of Short-Term Bounces
by Frank Cappelleri,
Founder & President, CappThesis, LLC
Get the latest S&P 500 analysis with a focus on RSI negative divergence, short-term swing setups, and market breadth trends. Learn what current patterns mean and how to spot the next move....
READ MORE
MEMBERS ONLY

Friday Chart Fix: QQQ Overtakes QQEW, GOOGL Near New High, Groups with Most Highs, Verizon Gaps Higher

by Arthur Hill,
Chief Technical Strategist, TrendInvestorPro.com
Which charts stand out this week? Arthur Hill analyzes the market and does a deep dive into the charts with price action that's not to be ignored....
READ MORE
MEMBERS ONLY
Consumer Discretionary Breakouts — 3 Stocks to Watch Now
by Julius de Kempenaer,
Senior Technical Analyst, StockCharts.com
Discover which sectors are leading — and which to avoid — with Julius' latest RRG analysis. Follow along as he breaks down weekly and daily sector rotations, revealing technology’s dominance, potential in consumer discretionary, and why some defensive sectors are showing unexpected strength. Julius then dives deeper into the consumer...
READ MORE
MEMBERS ONLY
Is the S&P 500 About to Surge?

by Joe Rabil,
President, Rabil Stock Research
Joe analyzes the S&P 500’s current sequential wave pattern and, from there, explains how to spot a shift into a surging market phase. He breaks down key support and resistance levels on the SPY daily chart, evaluates the QQQ and IWM for signs of market strength, and...
READ MORE
MEMBERS ONLY

What to Make of the Small-Cap Rally: A Closer Look at IJR and IWM
Small-cap stocks are showing signs of strength. Investors should keep an eye on the performance of IWM and IJR, two small-cap ETFs, to determine if the small-cap rally has legs....
READ MORE
MEMBERS ONLY

This Week’s Stock Market Winners — And What’s Driving Them
by Mary Ellen McGonagle,
President, MEM Investment Research
Join Mary Ellen as she breaks down the latest market trends! The highlight of the show is a deep dive into the consumer discretionary sector, where Mary Ellen analyzes leading industry groups like homebuilders, apparel, and specialty retail, and explains why this sector continues to show relative strength. She shares...
READ MORE
MEMBERS ONLY

US Dollar at a Crossroads, Gold Primed for Action: Macro Moves to Watch
With high-impact US data and geopolitical risks on tap this week, traders must assess the US dollar. Here are some outcomes that could surface in the dollar and gold....
READ MORE
MEMBERS ONLY
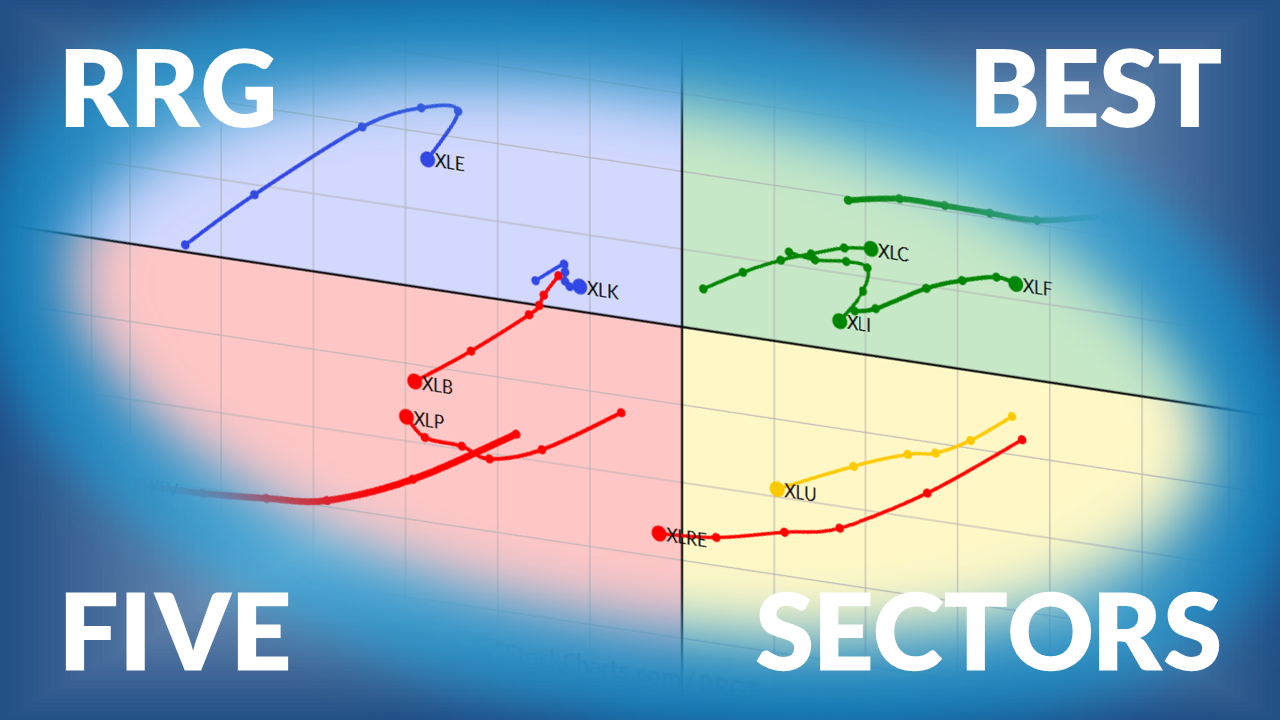
The Best Five Sectors, #31
by Julius de Kempenaer,
Senior Technical Analyst, StockCharts.com
Julius presents his weekly update on US sector rotation based on Relative Rotation Graphs....
READ MORE
MEMBERS ONLY

Week Ahead: Keeping Head Above This Level Crucial for Nifty To Avoid Slipping Into Prolonged Weakness

by Milan Vaishnav,
Founder and Technical Analyst, EquityResearch.asia and ChartWizard.ae
Nifty logs its sixth week of losses, hovering below key resistance. Traders remain cautious amid potential downside risks. ...
READ MORE
MEMBERS ONLY

Three Key Macro Charts I’m Watching on Vacation
by David Keller,
President and Chief Strategist, Sierra Alpha Research
Here are the key levels to watch in the S&P 500 as well as META, MSFT, and AAPL. As long as the index and stocks hold above key support levels, the uptrend in stocks is in good shape. ...
READ MORE
MEMBERS ONLY

Friday Chart Fix: 2024 vs. 2025, Commodities with a Dash of Crypto, Moment of Truth for IWM, The Tesla Squeeze
by Arthur Hill,
Chief Technical Strategist, TrendInvestorPro.com
Here's a deep dive into the differences between the 2024 bull market and 2025 bull run, small-cap performance, the price action in Bitcoin and gold, and the Bollinger Band squeeze in Tesla's stock price....
READ MORE
MEMBERS ONLY

Apple's Strongest 2-Day ROC Since April: Breakout or Bull Trap?
Apple (AAPL) jumps on tariff relief headlines. See the ROC thrust, 200-day moving average test, gap levels at $213/$203, and targets to $237-$250....
READ MORE
MEMBERS ONLY

Smart Investors are Watching These Chart Signals: Here's Why
by Frank Cappelleri,
Founder & President, CappThesis, LLC
Discover what Bollinger Bands and RSI are signaling for the S&P 500. Learn how low volatility and key momentum indicators could point to the next market breakout....
READ MORE
MEMBERS ONLY
How We Beat the S&P 500 by 20% This Quarter!

by Tom Bowley,
Chief Market Strategist, EarningsBeats.com
Tom breaks down how his model portfolios have consistently outperformed the S&P 500 — including a 24.5% return for the aggressive portfolio over the past quarter, against the S&P 500’s 5%. He covers market signals following the Fed’s recent rate decision, explains why Wall...
READ MORE
MEMBERS ONLY

The Good, the Bad, and the Sideways
by David Keller,
President and Chief Strategist, Sierra Alpha Research
As U.S. equity indexes hit new highs, not all stocks are keeping pace. Explore these three stocks that are at key technical junctures with charts that highlight trend shifts, risk levels, and actionable signals....
READ MORE
MEMBERS ONLY
Top 10 Charts to Watch August 2025!

by Grayson Roze,
Chief Strategist, StockCharts.com
Join Grayson Roze as he reveals his top 10 stock charts to watch this month including SFM, BSX, AFRM and SYF. From breakout strategies to moving average setups, he walks through technical analysis techniques using relative strength, momentum, and trend-following indicators. Viewers will also gain insight into key market...
READ MORE
MEMBERS ONLY
Top 10 Stock Charts for August 2025 You Need to Watch Now
by David Keller,
President and Chief Strategist, Sierra Alpha Research
Join Dave as he shares ten actionable stock charts for August 2025 that he’s watching closely. From breakout setups to key reversals, David highlights tickers like Tesla, Meta, Caterpillar, Motorola, and Newmont Mining that show compelling technical patterns. He also walks through how to manage the full trading process...
READ MORE
MEMBERS ONLY
Markets Drop! But These Stocks Are Still Leading
by Mary Ellen McGonagle,
President, MEM Investment Research
Mary Ellen McGonagle breaks down this week’s market volatility and what it means for investors. She explains how inflation and employment data triggered technical breakdowns in key indexes, and discusses why volatility, relative strength, and leadership stocks (including MPWR, TER, and Cadence Design) should remain on your radar. Mary...
READ MORE
MEMBERS ONLY

Last Week’s Market Action Showed Signs of Exhaustion, Especially In This One Key Stock

by Martin Pring,
President, Pring Research
Explore how recent bearish weekly patterns in the S&P 500, Nasdaq, and Microsoft could signal an intermediate-term trend reversal. Learn why confirmation is key in technical analysis....
READ MORE
MEMBERS ONLY

Warning Signs in the Charts: How to Survive a Late-Summer Shakeout
by Tom Bowley,
Chief Market Strategist, EarningsBeats.com
The stock market rally may be hitting a wall as volatility spikes and bearish signals emerge. Discover key technical warnings, seasonal trends, and how traders and investors should prepare for a choppy August–September....
READ MORE
MEMBERS ONLY

Week Ahead: Nifty Tests Key Support Levels—May Weaken If Levels Violated
by Milan Vaishnav,
Founder and Technical Analyst, EquityResearch.asia and ChartWizard.ae
The Nifty closed the week lower, trading within a narrow range. Volatility also rose. Monitor short-term support levels as we head into next week. Discover which sectors are leading and which are lagging....
READ MORE
MEMBERS ONLY

Thursday's Stock Market Dive: Noise or a Warning? Let the Charts Decide
by Jayanthi Gopalakrishnan,
Director of Site Content, StockCharts.com
Was Thursday's market dip a warning sign or just noise? Explore market trends, sentiment, and sector rotation, and learn how the StockCharts Market Summary page can help you stay one step ahead....
READ MORE
MEMBERS ONLY

Meta, Microsoft Blow Past Earnings — Are These Stock Next?
by Tom Bowley,
Chief Market Strategist, EarningsBeats.com
Tom recaps a pivotal week for the markets, as the Fed holds rates steady despite signs of softening economic growth. Tom breaks down the rare dissent among Fed governors, the market’s sharp reaction during Jerome Powell’s press conference, and the technical fallout across major indexes, especially small caps...
READ MORE
MEMBERS ONLY

3 Types of Breakouts To Upgrade Your Portfolio
by David Keller,
President and Chief Strategist, Sierra Alpha Research
Use this StockCharts scan to identify three categories of stocks and ETFs that are making new three-month highs....
READ MORE
MEMBERS ONLY
Avoid This Common RSI Mistake (And What to Do Instead)
by Joe Rabil,
President, Rabil Stock Research
Master RSI strategies with Joe! Follow along as Joe shares his refined method using dual timeframes and a two-RSI approach; see how he uses RSI-20 as a trend filter and RSI-5 as an entry signal to avoid common mistakes and enhance trading precision. Joe breaks down real...
READ MORE
MEMBERS ONLY
Catch Big Moves Early With This Breakout Scan!
by David Keller,
President and Chief Strategist, Sierra Alpha Research
Follow along as Dave shares the one stock scan he runs every week to uncover potential breakout candidates. He explains the three types of chart setups that frequently appear, each with their own trading implications, and walks through how he structures trades according to type. He also illustrates how to...
READ MORE
MEMBERS ONLY

Is It Time to Take Another Look at China?
by Martin Pring,
President, Pring Research
Here's an analysis of the recent bullish developments in the Shanghai Stock Exchange Composite Index and liquid Chinese ETFs. ...
READ MORE
MEMBERS ONLY

Before You Cast Away, Hook the Market's Key Trends on StockCharts
by Jayanthi Gopalakrishnan,
Director of Site Content, StockCharts.com
Check these must-see StockCharts signals before you cast off for the summer and see whether August's market currents say "stay the course" or "make adjustments."...
READ MORE
MEMBERS ONLY
These Breakout Stocks Are Leading the Market Right Now
by Mary Ellen McGonagle,
President, MEM Investment Research
Markets hit another all-time high as rotation accelerates into biotech, software, and alt-energy names. Follow along as Mary Ellen breaks down the top-performing sectors and ETFs, including key breakouts in Bloom Energy, DoorDash, and Deckers. She also highlights meme stocks' action, examines what international leadership in...
READ MORE
MEMBERS ONLY

Is the Charging Bull Getting Tired?

by Bruce Fraser,
Industry-leading "Wyckoffian"
Optimism surrounds the stock market indexes with lofty price targets. Could the fulfillment of Point & Figure targets mean the end of a bull market? Find out here. ...
READ MORE
MEMBERS ONLY

The Week Ahead: NIFTY Will Have a Lot Of Reactions To Offer; Stares At Important Supports
by Milan Vaishnav,
Founder and Technical Analyst, EquityResearch.asia and ChartWizard.ae
Nifty ended the week slightly lower after trading within a narrow range. With key levels in focus and technical indicators showing mixed signals, markets may remain sideways for a while....
READ MORE
MEMBERS ONLY

Using Relative Rotation Graphs to Visualize Sector Rotation
by Julius de Kempenaer,
Senior Technical Analyst, StockCharts.com
Relative Rotation Graphs or RRGs will help investors to keep an eye on relative trends that unfold within a universe. Among other things this will help to visualize sector rotation...
READ MORE