MEMBERS ONLY

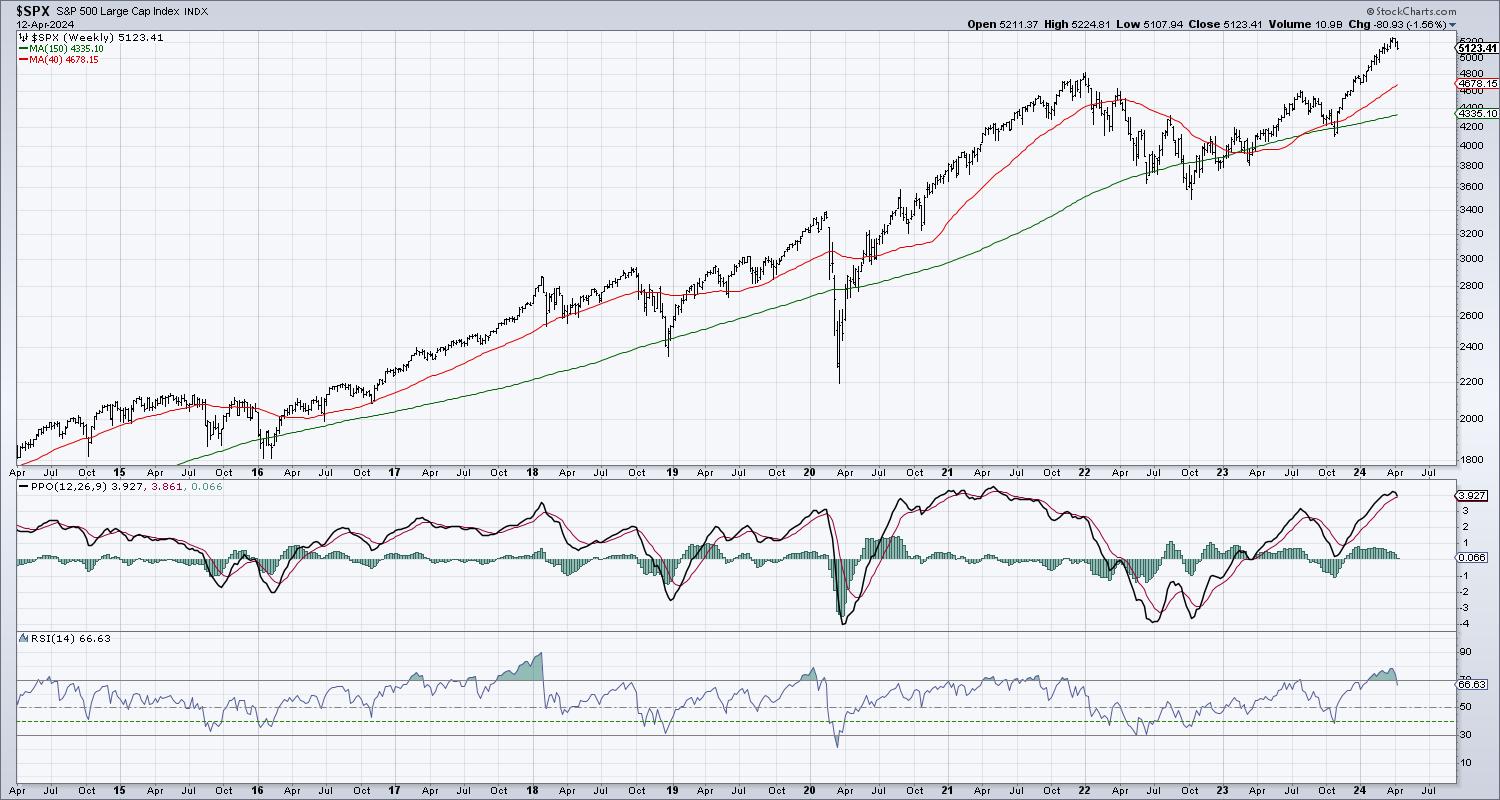
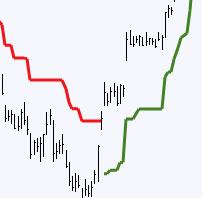
Getting Perspective and Dealing with Volatility

by Arthur Hill,
Chief Technical Strategist, TrendInvestorPro.com
KEY TAKEAWAYS
* Primary moves define the long-term trend
* Secondary moves are corrections within bigger uptrends
* Corrections provide opportunities to partake in the bigger uptrend
The S&P 500 is down 5.5% this month and volatility is rearing its ugly head. This is a good time to get some...
READ MORE
MEMBERS ONLY
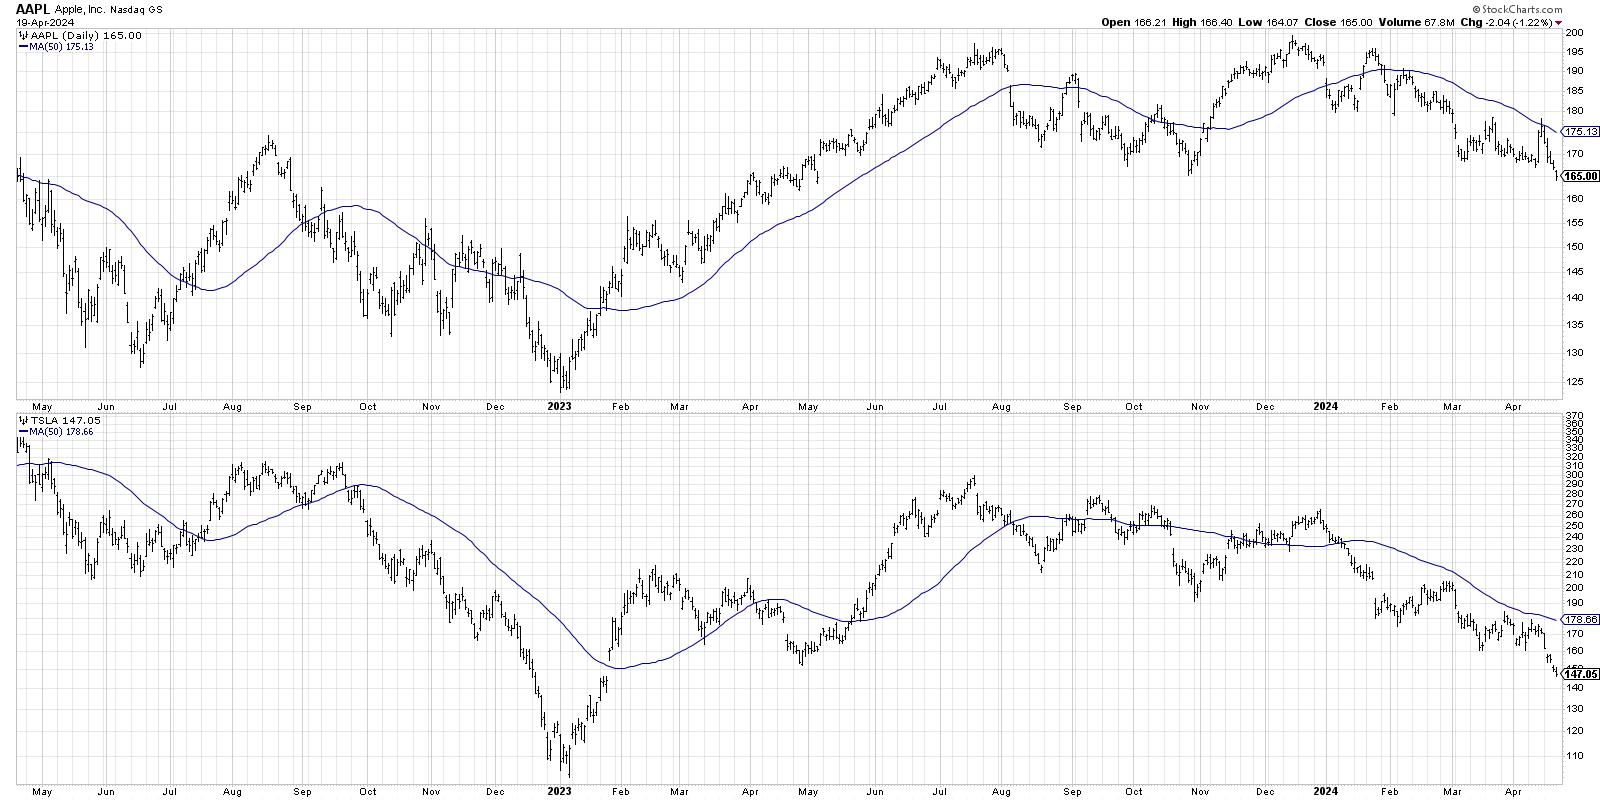
Breakdown in Mega-Cap Growth Confirms Bear Phase

by David Keller,
President and Chief Strategist, Sierra Alpha Research
KEY TAKEAWAYS
* Early breakdowns from AAPL and TSLA provided initial warnings of a late stage bull market.
* Exponential gains in stocks like SMCI and MSTR have now turned into steep pullbacks with both stocks breaking below moving average support.
* With AMZN and NFLX finishing the week below their 50-day moving...
READ MORE
MEMBERS ONLY
MEM TV: Capitulation Signals for a Market BOTTOM

by Mary Ellen McGonagle,
President, MEM Investment Research
In this episode of StockCharts TV'sThe MEM Edge, Mary Ellen reviews the negative shift that's evolved over the past week in the market and highlights key signals of capitulation you should be watching for. She then shares the move into Value stocks she's seeing...
READ MORE
MEMBERS ONLY
How to Chart In Multiple Timeframes Like A PRO

by Grayson Roze,
Chief Strategist, StockCharts.com
On this week's edition of StockCharts TV'sStockCharts in Focus, Grayson shows you how to chart the same symbol in multiple timeframes with ease using ChartStyles and StyleButtons. Learn how to customize multiple charts with the periods and ranges that fit with your system and then set...
READ MORE
MEMBERS ONLY

S&P 500 Approaches 100-Day Moving Average: Is Now an Attractive Time to Buy Stocks?

by Jayanthi Gopalakrishnan,
Director of Site Content, StockCharts.com
KEY TAKEAWAYS
* The possibility of only one interest rate cut and escalation of geopolitical tensions increases uncertainty levels for investors
* The 100-day simple moving average could be the S&P 500's next support level
* Massive selloff in Tech stocks sends the Nasdaq Composite below its 100-day moving...
READ MORE
MEMBERS ONLY
Top 10 Stocks to Watch April 2024
by David Keller,
President and Chief Strategist, Sierra Alpha Research
by Grayson Roze,
Chief Strategist, StockCharts.com
In this edition of StockCharts TV'sThe Final Bar, Dave and Grayson run through top 10 charts to watch in April 2024! Together they cover breakout strategies, moving average techniques, relative strength, and much more. You don't want to miss these insights into market dynamics and chart...
READ MORE
MEMBERS ONLY
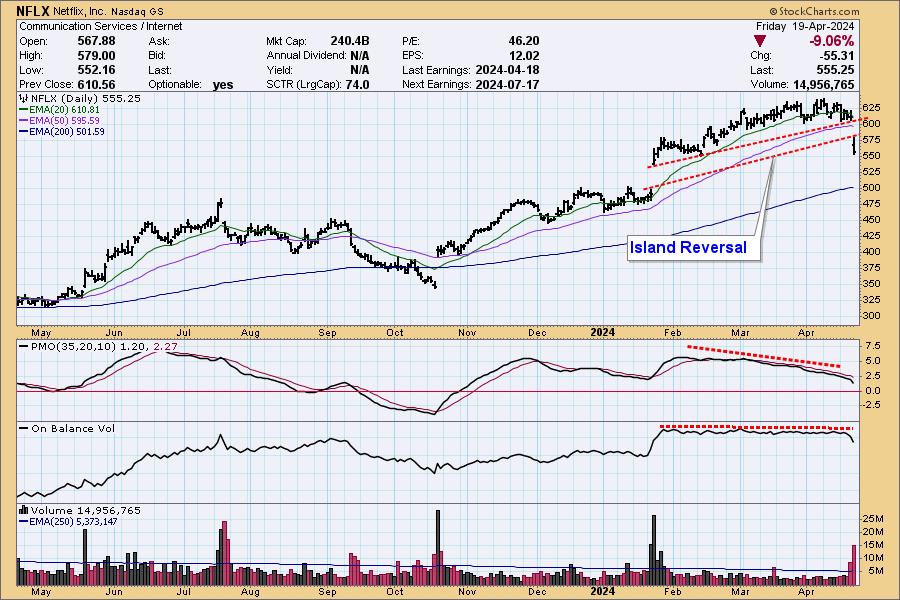
Netflix Gets Island Reversal On Earnings

by Carl Swenlin,
President and Founder, DecisionPoint.com
Netflix (NFLX) earnings were released today, and the news was good. . . except for one little thing. They also suspiciously announced that, starting next year, they would no longer be reporting subscriber metrics. That's like General Motors saying that they will no longer report how many cars and trucks...
READ MORE
MEMBERS ONLY

Charts Flashing "No Go" for S&P 500!
by David Keller,
President and Chief Strategist, Sierra Alpha Research
In this edition of StockCharts TV'sThe Final Bar, Dave welcomes guest Tyler Wood, CMT of GoNoGo Charts. Tyler walks through their proprietary momentum model which confirms a bearish rotation for the major equity benchmarks yet a bullish rotation for the commodity space. David walks through key earnings names...
READ MORE
MEMBERS ONLY
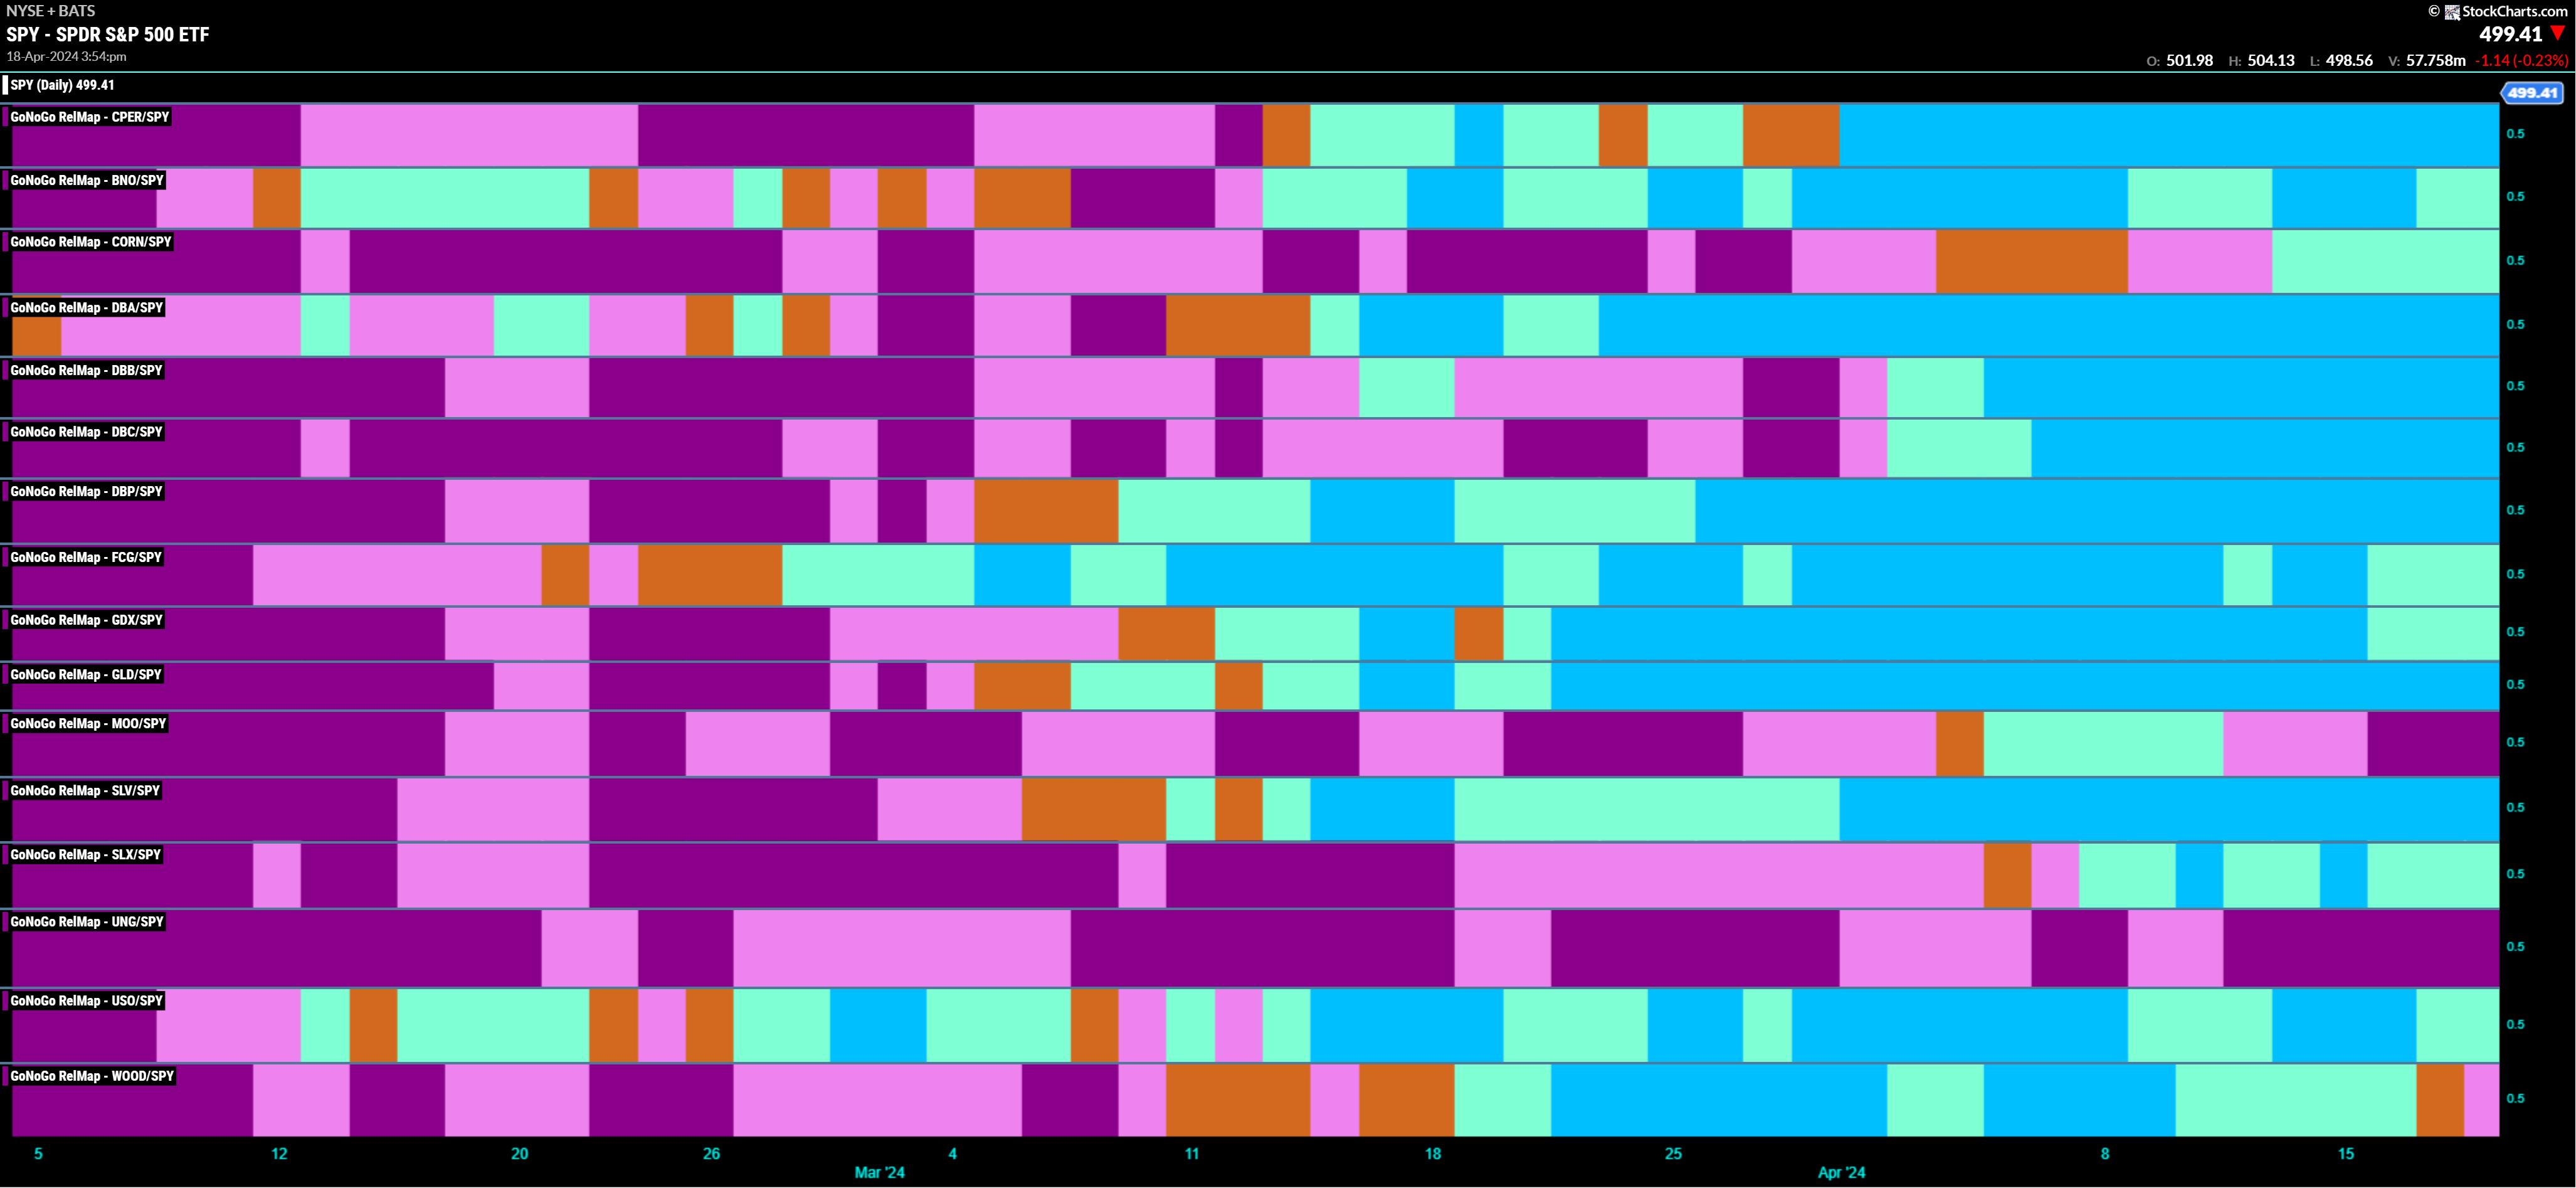
Rocks over Stocks | GoNoGo Show 041824

by Tyler Wood,
Co-founder, GoNoGo Charts®
KEY TAKEAWAYS
* New Risk Off Environment for Equities
* Commodities Leading
The S&P500 trend conditions have reversed into "NoGo" and strengthened to purple bars. Alex Cole and Tyler Wood, CMT identify intermarket forces including rising rates ($TNX) and a strong US Dollar (UUP) that can provide headwinds...
READ MORE
MEMBERS ONLY

Larry's "Family Gathering" April 18, 2024 Recording

by Larry Williams,
Veteran Investor and Author
Right now, there's lots of room for a downside in the market. Do we really want a rate cut?
In this video, Larry talks about past interest rate cuts from the Fed, and what happens to stock prices as a result. Historically, we've seen these cuts...
READ MORE
MEMBERS ONLY
Intraday Trading Entry and Exit Strategies

by Joe Rabil,
President, Rabil Stock Research
On this week's edition of Stock Talk with Joe Rabil, Joe details a trade setup in the QQQ that demonstrates how he uses MACD and ADX in multiple timeframes for his trading. He gives detail on the entry and exit for this trade. Joe then covers the stock...
READ MORE
MEMBERS ONLY
Rules-Based Money Management - Part 1: Popular Indicators and Their Uses

by Greg Morris,
Veteran Technical Analyst, Investor, and Author
Note to the reader: This is the seventeenth in a series of articles I'm publishing here taken from my book, "Investing with the Trend." Hopefully, you will find this content useful. Market myths are generally perpetuated by repetition, misleading symbolic connections, and the complete ignorance of...
READ MORE
MEMBERS ONLY

"Family Gathering" Meeting Today at 2:00 PM Eastern
Today, Larry Williams will be hosting a "Family Gathering" meeting at 2pm Eastern Daylight Time (11am Pacific). Sign-in in begins 5 minutes prior. The show will be recorded and posted online for those of you who cannot attend. Use the link below to join:
Link to Join Webinar:...
READ MORE
MEMBERS ONLY
Semiconductors are at CRITICAL Level!
by David Keller,
President and Chief Strategist, Sierra Alpha Research
In this edition of StockCharts TV'sThe Final Bar, Dave welcomes guest Danielle Shay of Simpler Trading. Danielle speaks to the downside rotation for the QQQ, SMH, and leading growth stocks, including why the $210 level is so crucial for the SMH. Dave highlights the recent downswing for Bitcoin,...
READ MORE
MEMBERS ONLY

Larry's LIVE "Family Gathering" Webinar Airs TOMORROW - Thursday, April 18 at 2:00pm EDT!
Larry is going LIVE! Don't miss the upcoming "Family Gathering" webinar with Larry Williams, airing live through Zoom on Thursday, April 18 at 2:00pm Eastern Daylight Time.
In this must-see event, Larry will be presenting his current opinions on a broad variety of current market...
READ MORE
MEMBERS ONLY

Bitcoin Halving Could Bring Massive Upside!
by David Keller,
President and Chief Strategist, Sierra Alpha Research
In this edition of StockCharts TV'sThe Final Bar, Dave shares a brief history of Bitcoin halving and relates it to the short-term and long-term technical outlook on this significant development for cryptocurrencies. He also focuses on stocks testing their 50-day moving averages, including NFLX, SMCI, and MSTR.
This...
READ MORE
MEMBERS ONLY
Is Market Breadth Signaling THE TOP?!
by David Keller,
President and Chief Strategist, Sierra Alpha Research
In this edition of StockCharts TV'sThe Final Bar, Dave shows how bearish short-term breadth combined with the deterioration in long-term breadth lines up well with previous market tops. He then breaks down key levels for the S&P 500 index as well as MSFT, TSLA, and more....
READ MORE
MEMBERS ONLY

DP Trading Room: Final Earnings are In for 2023 Q4!

by Erin Swenlin,
Vice President, DecisionPoint.com
Carl opens the show with a view of the final earnings results for 2023 Q4! His chart reveals whether stocks are fair valued, overvalued or undervalued. Get his take on the current readings.
Carl gave us his market overview including Bitcoin, Gold Miners, Gold and Crude Oil and many more....
READ MORE
MEMBERS ONLY

Precious Metals Reach Exhaustion

by Martin Pring,
President, Pring Research
In the last couple of weeks, I have been reading stories about shoppers picking up gold bars in, of all places, Costco. According to Gemini, the AI branch of Google, "Reports indicate they may be selling up to $200 million worth of gold bars every month."
Normally, thin...
READ MORE
MEMBERS ONLY
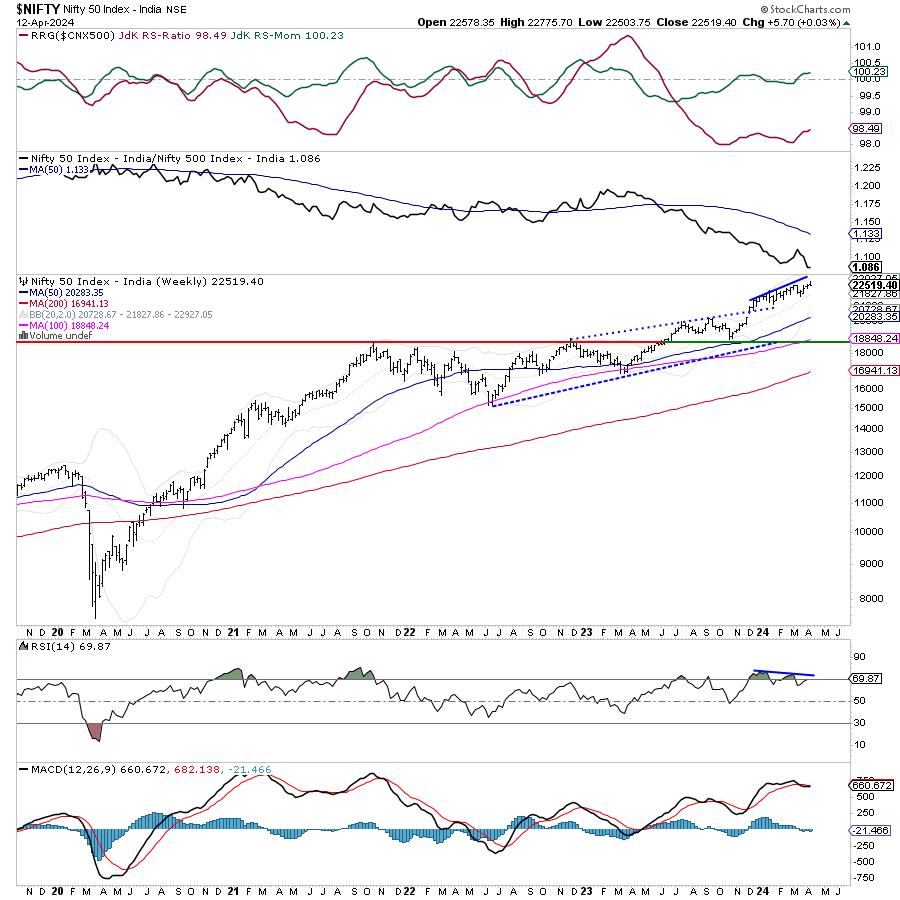
Week Ahead: NIFTY May Stay Subdued Over the Truncated Week; Defensive Play May Seem Evident

by Milan Vaishnav,
Founder and Technical Analyst, EquityResearch.asia and ChartWizard.ae
Going into the previous week, the markets had been expected to inch higher; however, at the same time, while it was believed that incremental highs may be formed, it was also expected that a runaway move would not happen. Over the past four trading sessions, the markets traded precisely on...
READ MORE
MEMBERS ONLY
S&P 500 Flashes Major Topping Signals
by David Keller,
President and Chief Strategist, Sierra Alpha Research
KEY TAKEAWAYS
* The weekly RSI has signaled an exit from overbought conditions, but the weekly PPO has not yet indicated a bearish reversal.
* A break below the 200-day moving average would validate the weekly sell signals, and align with previous market tops since the 2009 market bottom.
Toward the bottom...
READ MORE
MEMBERS ONLY
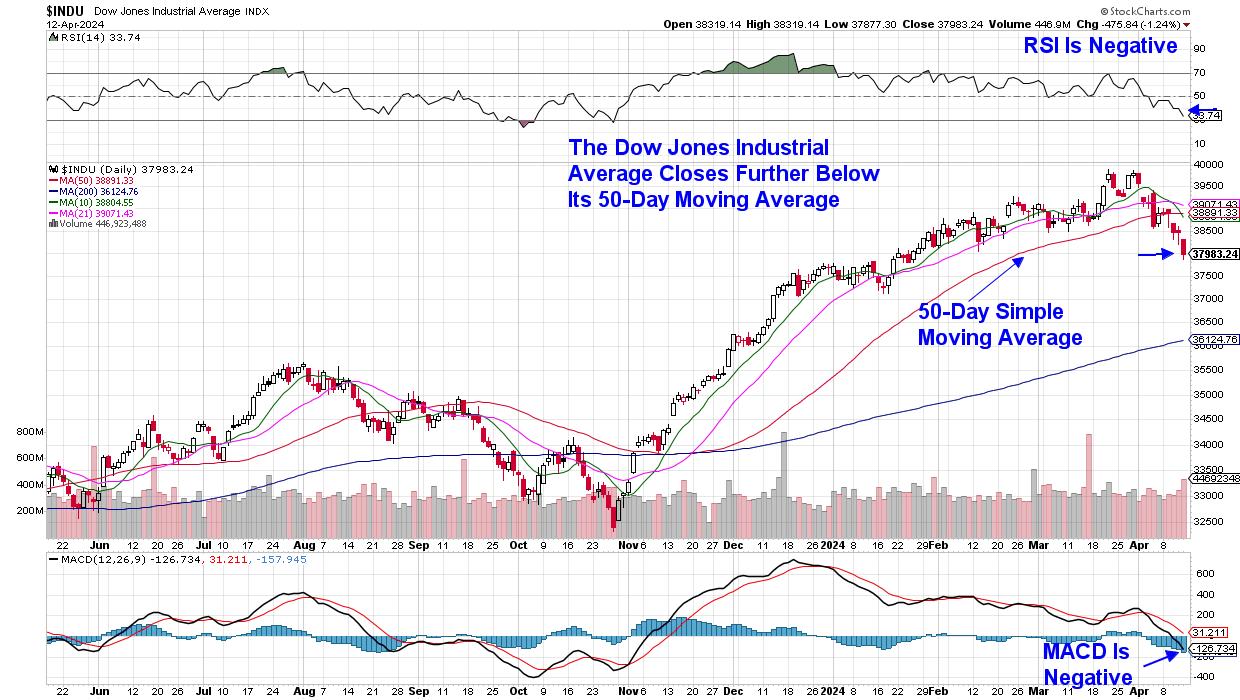
Keeping Up With The Jones - How Weakness in This Index May Foretell a Broader Market Correction
by Mary Ellen McGonagle,
President, MEM Investment Research
The Dow Jones Industrial Average fell 2.4% last week in a move that pushes this index further below its key 50-day simple moving average. While not the most widely followed index, the Dow has continued to evolve so that its 30 components more closely represent the current economy. Amazon&...
READ MORE
MEMBERS ONLY
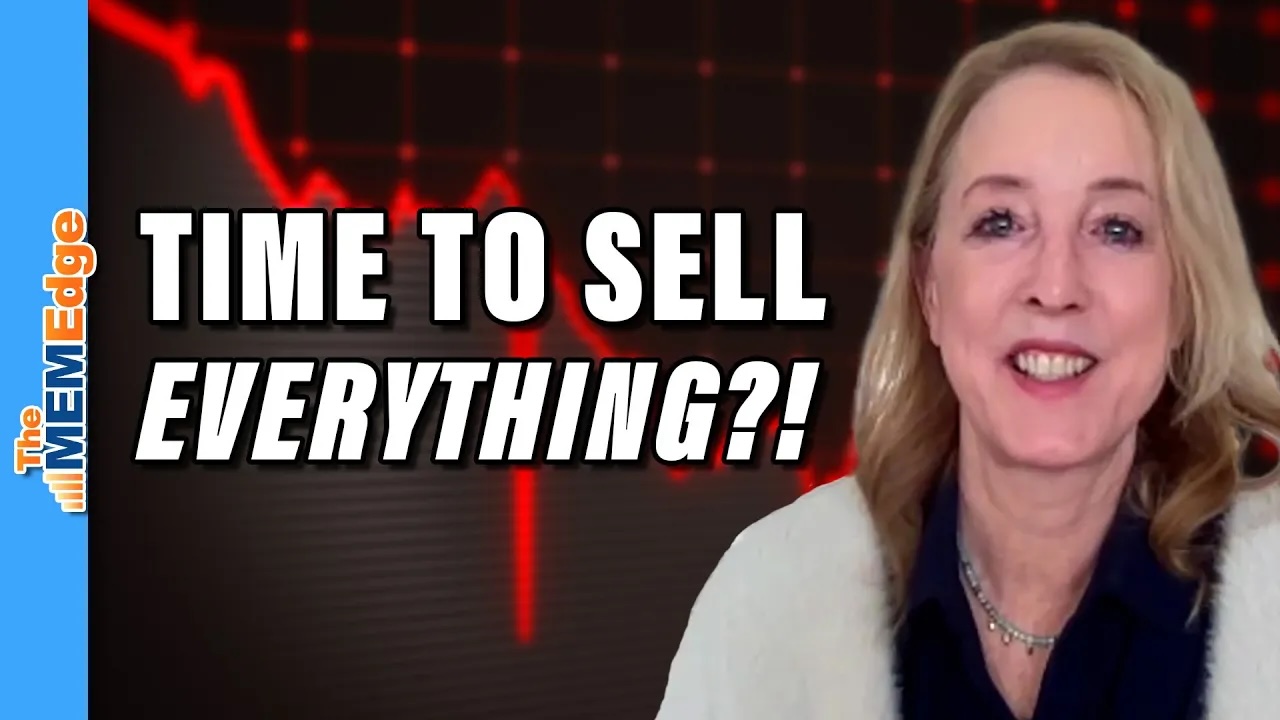
MEM TV: Time To SELL EVERYTHING?!
by Mary Ellen McGonagle,
President, MEM Investment Research
In this episode of StockCharts TV'sThe MEM Edge, Mary Ellen shares key signals that it's time to sell a stock, using INTC as an example. She also reviews a key area of support for the markets, and new sectors that have entered a downtrend. She finishes...
READ MORE
MEMBERS ONLY
Stock Market Indexes Plunge After Hitting Resistance -- Support Levels You Need to Watch
by Jayanthi Gopalakrishnan,
Director of Site Content, StockCharts.com
KEY TAKEAWAYS
* Dow Jones Industrial Average, S&P 500, and Nasdaq Composite dropped
* Gold keeps hitting new highs
* The VIX spiked above 18 but closed at 17.31
Now that earnings season has begun, what can you expect the stock market to do, especially after its stellar Q1 run?...
READ MORE
MEMBERS ONLY

The Day the Yields Broke Out
by Martin Pring,
President, Pring Research
Wednesday brought an unexpected firming up of the inflation figures, causing analysts and commentators to trim the number of times they expect interest rates to be cut this year. Whenever it is that the questions turn away from whether to when and by how much, as was the case until...
READ MORE
MEMBERS ONLY
Using Outsized Moves to Identify Trend Reversals - Checking in on Housing and Semis
by Arthur Hill,
Chief Technical Strategist, TrendInvestorPro.com
KEY TAKEAWAYS
* Outsized Moves Can Jump Start Trends
* Chartists can use ATR-SAR to Identify Outsized Moves
* Housing and Retail are Leading Lower with Outsized Declines
Trends often start with outsized moves. But how do we measure and identify such moves? Chartists can measure moves in Average True Range (ATR) terms...
READ MORE
MEMBERS ONLY

RRG Indicates That Non-Mega Cap Technology Stocks are Improving

by Julius de Kempenaer,
Senior Technical Analyst, StockCharts.com
KEY TAKEAWAYS
* The energy sector remains on a very strong rotational path
* A completed top formation in Healthcare opens up significant downside risk
* Smaller Technology stocks are taking over from mega-cap names
A Sector Rotation Summary
A quick assessment of current sector rotation on the weekly Relative Rotation Graph:
XLB:...
READ MORE
MEMBERS ONLY
Master Market Entry with This RSI Strategy!
by Joe Rabil,
President, Rabil Stock Research
On this week's edition of Stock Talk with Joe Rabil, Joe explains how to use the RSI along with the MACD and ADX indicators. RSI is used as a timing tool when things are lined up. Joe goes through some of the key elements he looks for when...
READ MORE
MEMBERS ONLY
Market Research and Analysis - Part 5: Drawdown Analysis
by Greg Morris,
Veteran Technical Analyst, Investor, and Author
Note to the reader: This is the sixteenth in a series of articles I'm publishing here taken from my book, "Investing with the Trend." Hopefully, you will find this content useful. Market myths are generally perpetuated by repetition, misleading symbolic connections, and the complete ignorance of...
READ MORE
MEMBERS ONLY
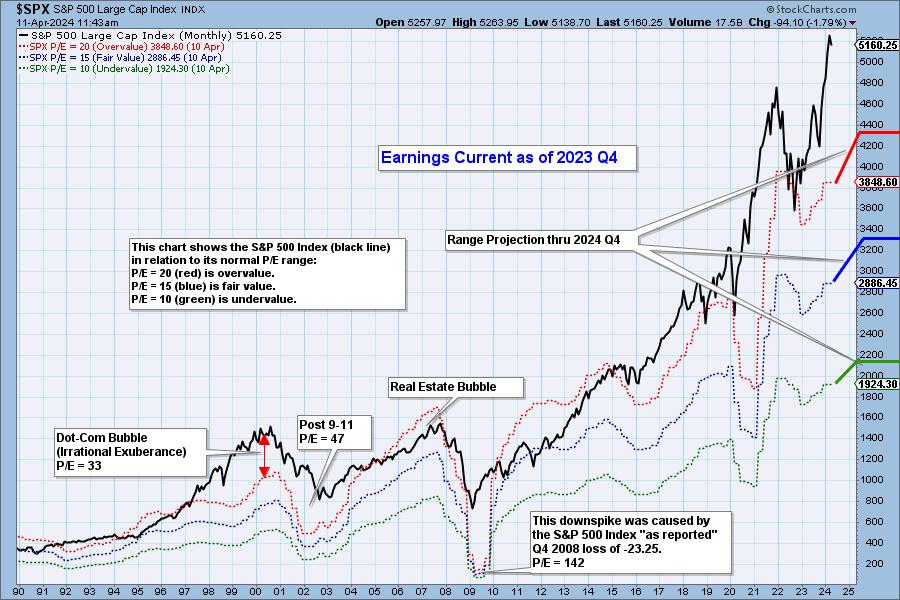
2023 Q4 Earnings Analysis and Projections Through 2024 Q4
by Carl Swenlin,
President and Founder, DecisionPoint.com
S&P 500 earnings are in for 2023 Q4, and here is our valuation analysis.
The following chart shows the normal value range of the S&P 500 Index, indicating where the S&P 500 would have to be in order to have an overvalued P/E...
READ MORE
MEMBERS ONLY

Is the Banking System on the Verge of Systemic Implosion? What to Look Out For

by Karl Montevirgen,
The StockCharts Insider
KEY TAKEAWAYS
* A few fringe economists are sounding the alarm on a looming series of banking collapses
* With bank holdings of government debt now underwater, some claim that banks are virtually insolvent as a result
* Whether any of this takes place, even partially, technical levels on the charts can help...
READ MORE
MEMBERS ONLY

This Sector is Breaking Up and Down Simultaneously
by Martin Pring,
President, Pring Research
This may seem like a contradiction, but it is possible for two different things to be true at the same time.
What I am referring to is the fact that the health care sector (XLV) recently broke out from a consolidation reverse head-and-shoulders pattern, as we can see from the...
READ MORE
MEMBERS ONLY

Despite Stable Markets, Breadth Says Danger
by David Keller,
President and Chief Strategist, Sierra Alpha Research
In this edition of StockCharts TV'sThe Final Bar, Dave drops a market update, with a focus on Bitcoin's rebound above 70K, deteriorating short-term breadth conditions, and stocks still making new highs despite the market consolidation phase.
This video originally premiered on April 8, 2024. Watch on...
READ MORE
MEMBERS ONLY
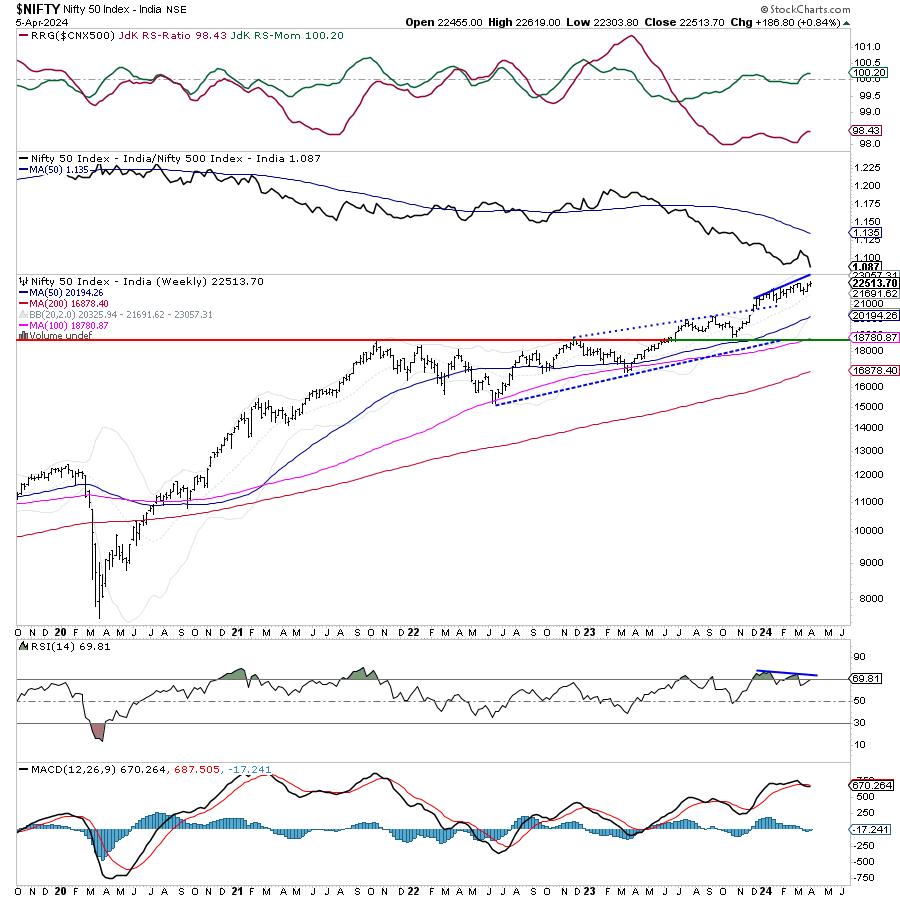
Week Ahead: NIFTY May Continue Finding Resistance at Higher Levels; These Sectors May Relatively Outperform
by Milan Vaishnav,
Founder and Technical Analyst, EquityResearch.asia and ChartWizard.ae
In the previous technical note, it was categorically mentioned that, while the markets may attempt to inch higher, they may not form anything beyond minor incremental highs and could largely continue to stay under consolidation. In line with the analysis, the Nifty did form a new lifetime high, but eventually...
READ MORE
MEMBERS ONLY

MEM TV: Is It Safe To Reenter The Markets?
by Mary Ellen McGonagle,
President, MEM Investment Research
In this episode of StockCharts TV'sThe MEM Edge, Mary Ellen shares what to be on the lookout for to tell if it's safe to put new money to work. She also shares the weakness in select sectors and which areas she suggests to underweight. Last up,...
READ MORE
MEMBERS ONLY
Double Top Forming in Growth vs. Value?
by David Keller,
President and Chief Strategist, Sierra Alpha Research
In this edition of StockCharts TV'sThe Final Bar, Dave answers questions from The Final Bar Mailbag. Today he talks about how to use the ADX indicator, how growth vs. value may have formed a double top pattern, how to use VWAP for intraday and historical analysis, and what...
READ MORE
MEMBERS ONLY
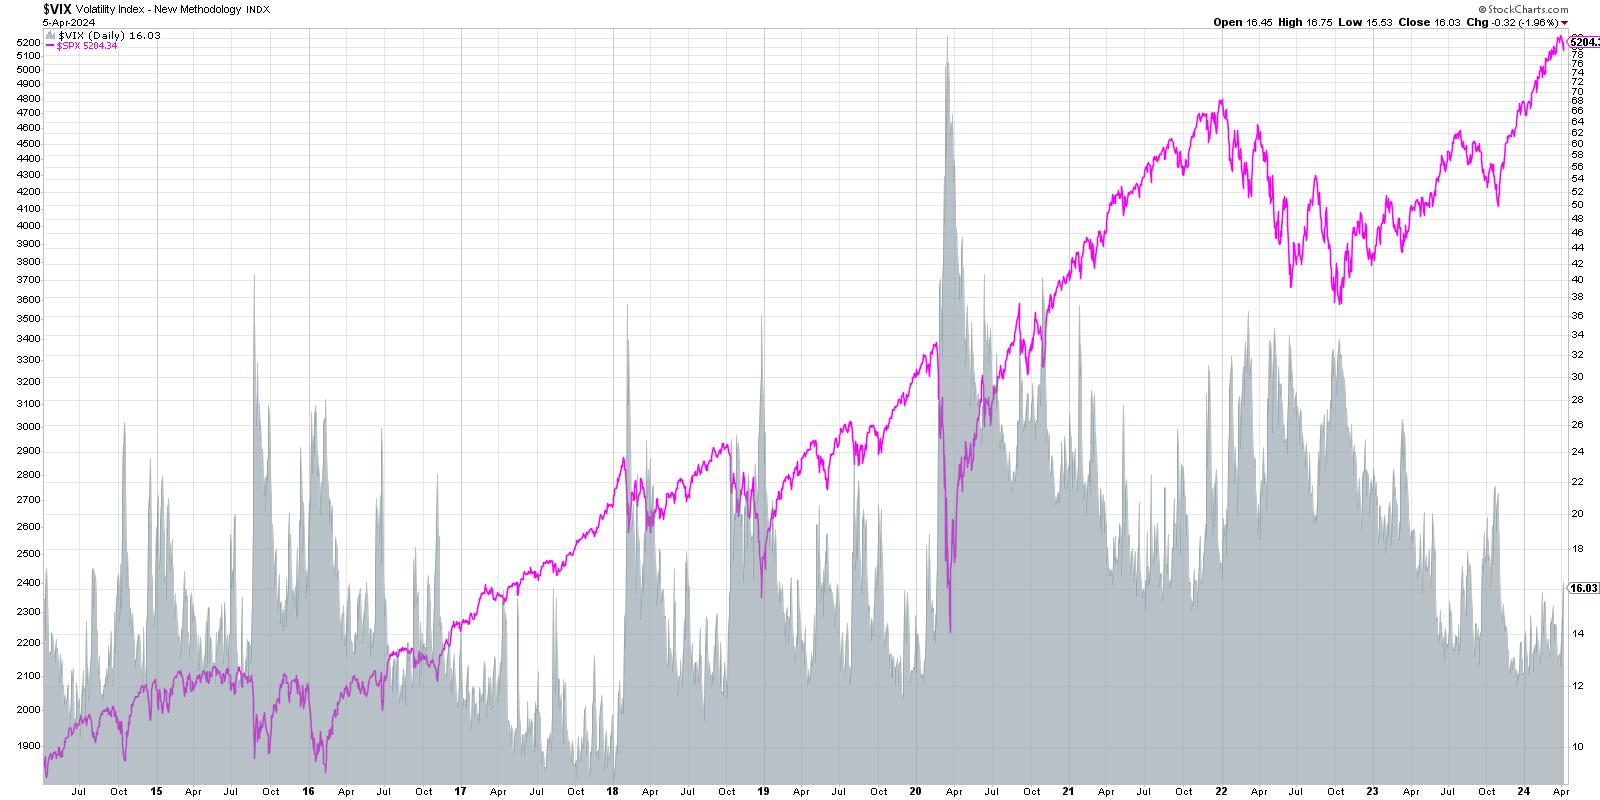
VIX Spikes Above 16 - Is This the End?
by David Keller,
President and Chief Strategist, Sierra Alpha Research
The VIX ended the week just above 16, bringing it to its highest level in 2024. What does this tell us about investor sentiment, and how does this compare to previous market cycles?
Let's take a quick tour of market history through the lens of the VIX, focusing...
READ MORE
MEMBERS ONLY

Jobs In the Spotlight: Stock Market Reverses Course After Massive Selloff
by Jayanthi Gopalakrishnan,
Director of Site Content, StockCharts.com
KEY TAKEAWAYS
* A stronger-than-expected jobs report sent the stock market higher
* Several stocks and ETFs hit new all-time highs today
* Commodity prices continue to rise
One day doesn't make a trend—that's one lesson we learned from this week's stock market action.
The March...
READ MORE
MEMBERS ONLY
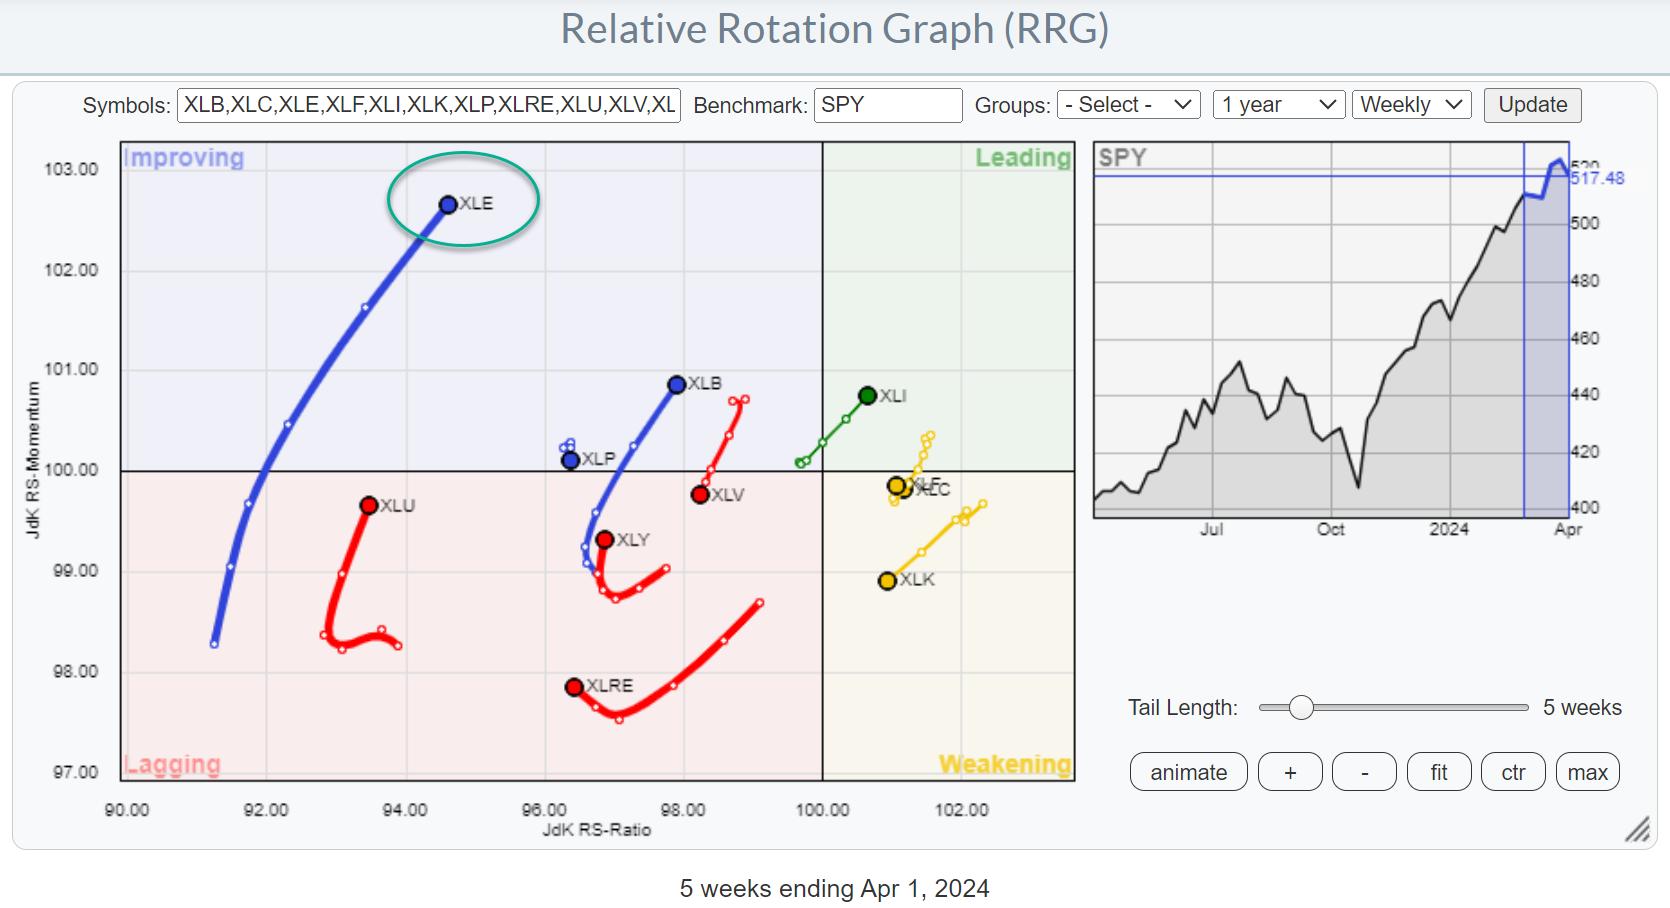
Energy is on Fire
by Julius de Kempenaer,
Senior Technical Analyst, StockCharts.com
KEY TAKEAWAYS
* Energy sector is breaking higher on price chart
* XLE's RRG tail is continuing to pick up steam
* The exploration & production industry is leading inside the energy sector
Strong Rotation on the Weekly RRG
For a few weeks now, the improvement in the energy sector (XLE)...
READ MORE
MEMBERS ONLY

Trifecta of Trouble

by Bruce Fraser,
Industry-leading "Wyckoffian"
The Markup Phase of a Bull Market is glorious to behold and participate in. But they do ebb and flow. The bullish run in the major stock indexes has been persistent in 2024. We often discuss the quarter-end effect for stock index trends and the upward trend has persisted into...
READ MORE