MEMBERS ONLY

Week Ahead: Broader Markets Set to Relatively Underperform; Watch These Nifty Levels Closely

by Milan Vaishnav,
Founder and Technical Analyst, EquityResearch.asia and ChartWizard.ae
In the previous technical note, during our analysis of the patterns of the NIFTY's weekly chart, it was mentioned that the Index has achieved a full throwback. This occurs when the instrument gives up the breakout gains entirely and retests the original breakout point which acts as a...
READ MORE
MEMBERS ONLY
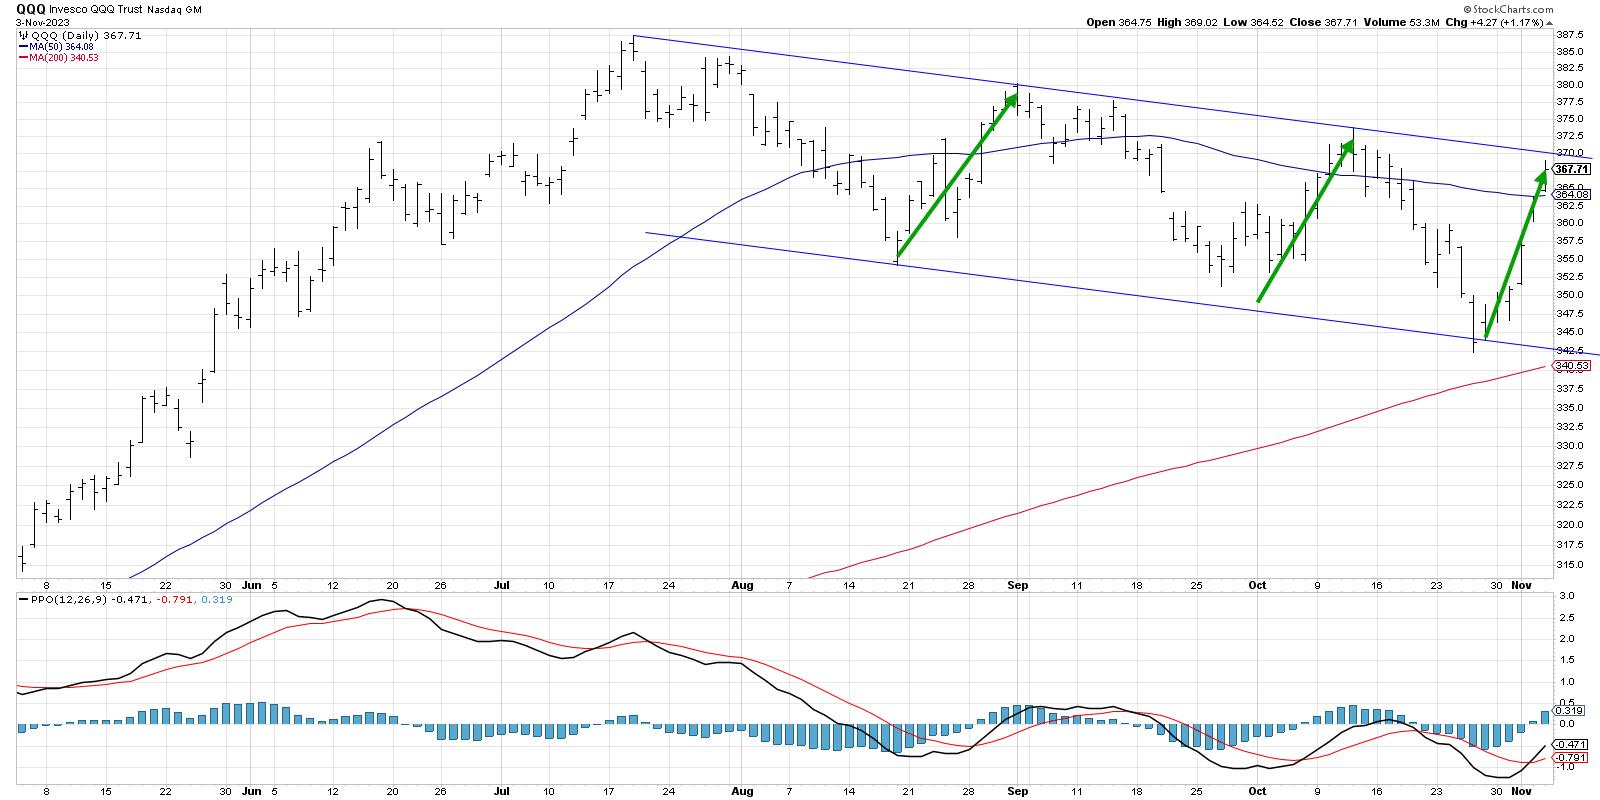
Trading the QQQ in Three Timeframes

by David Keller,
President and Chief Strategist, Sierra Alpha Research
KEY TAKEAWAYS
* The short-term trend for the QQQ is positive after this week's rally, but price is now at the upper edge of a downtrend channel.
* On the medium-term timeframe, the downtrend channel is still intact, and the momentum reading is still in line with a bearish phase....
READ MORE
MEMBERS ONLY

GNG TV: S&P Rallies Back to 4300 - Is It a Go?

by Alex Cole,
Co-founder, GoNoGo Charts®

by Tyler Wood,
Co-founder, GoNoGo Charts®
In this edition of the GoNoGo Charts show, as equities rally right on seasonal cue, Alex and Tyler take a look across asset classes, sectors and review a few of the magnificent 7 that are holding up the broad cap-weighted indices. All that can be determined from this week'...
READ MORE
MEMBERS ONLY
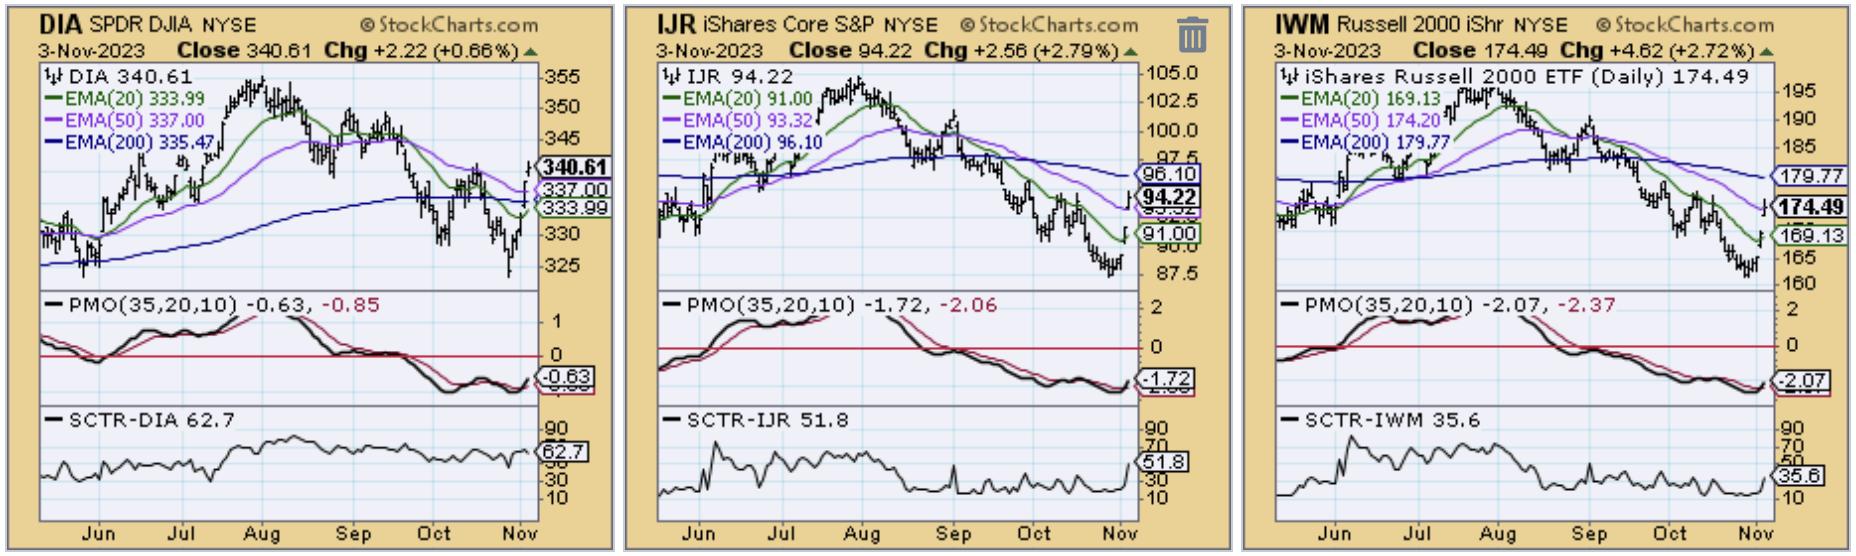
New PMO Crossover BUY Signals Across All Major Indexes

by Erin Swenlin,
Vice President, DecisionPoint.com
Yesterday, the SPX (SPY), OEX (OEF) and Dow Industrials (DIA) all saw new PMO Crossover BUY Signals. Today, they were joined by the remainder of the major indexes. The market is clicking; now we need to determine how long this rally will stick around.
Seeing so many oversold PMO BUY...
READ MORE
MEMBERS ONLY

MEM TV: New BULLISH THRUST in the S&P 500

by Mary Ellen McGonagle,
President, MEM Investment Research
In this episode of StockCharts TV'sThe MEM Edge, Mary Ellen reviews the new uptrend in the markets and the areas that are best positioned to benefit. She also highlights how to use different timeframe charts to tell if a stock will continue to trend higher after gapping up...
READ MORE
MEMBERS ONLY
Top Ten Charts to Watch in November 2023
by David Keller,
President and Chief Strategist, Sierra Alpha Research

by Grayson Roze,
Chief Strategist, StockCharts.com
In this edition of StockCharts TV'sThe Final Bar, join Dave and Grayson as they break down the trends for the top ten stocks and ETF charts for November 2023. Watch as they identify key levels and signals to keep an eye out for using the power of StockCharts&...
READ MORE
MEMBERS ONLY

An Incredible Stock Market Rally Closes the Week on a Strong Note: The Best Week This Year, So Far

by Jayanthi Gopalakrishnan,
Director of Site Content, StockCharts.com
KEY TAKEAWAYS
* The Dow Jones Industrial Average, S&P 500, and Nasdaq Composite rally into the close
* Fed Chairman Jerome Powell's comments eased investor fears of further interest rate hikes
* Lower Treasury yields helped the banks, including regional banks
Five up days in a row for the...
READ MORE
MEMBERS ONLY
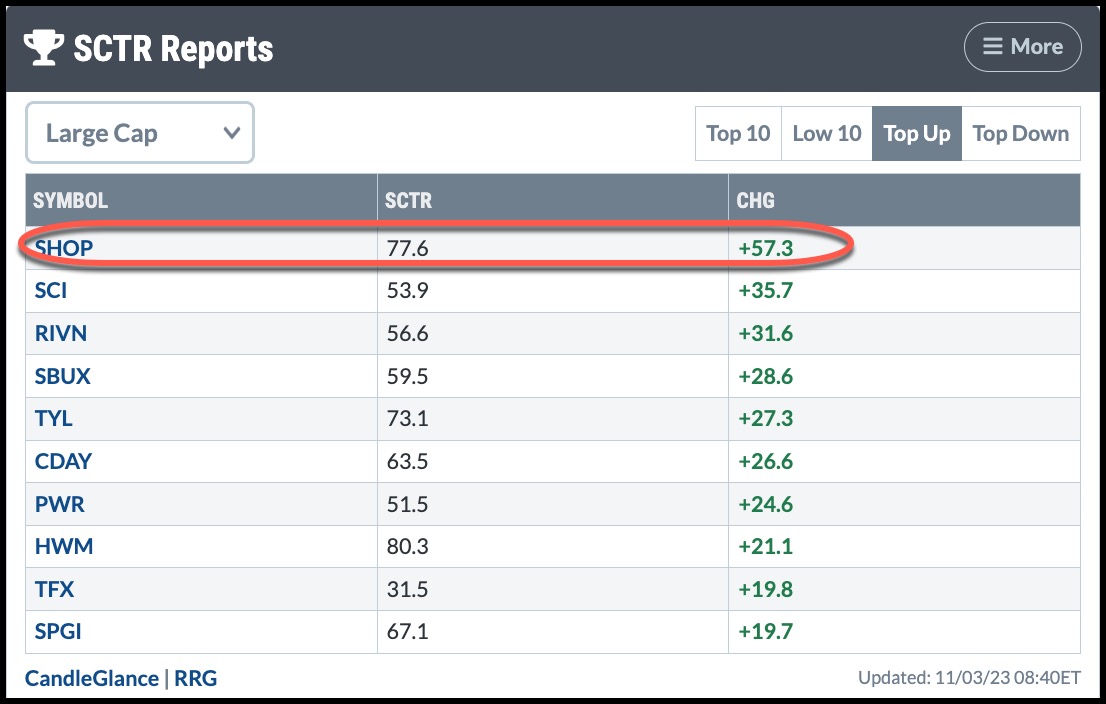
Shopify Stock Shatters Expectations: What You Need to Know About Its Rise

by Karl Montevirgen,
The StockCharts Insider
KEY TAKEAWAYS
* Shopify saw a significant surge of over 20% following a robust earnings report and guidance
* The daily price chart shows a breakaway gap from a prevailing near-term downtrend
* Breakaway gaps don't often fill, so if you are considering entering a position the stock has room to...
READ MORE
MEMBERS ONLY
What Can the VIX Reveal To Us In November 2023?
by David Keller,
President and Chief Strategist, Sierra Alpha Research
In this edition of StockCharts TV'sThe Final Bar, Tim Hayes of Ned Davis Research shares an outlook for interest rates in 2024, and explains why a VIX over 28.5 could mean disaster for risk assets. Host David Keller, CMT updates charts of stocks reporting earnings including SBUX,...
READ MORE
MEMBERS ONLY

Start Trading Like a Pro with These RSI Divergence Signals!

by Joe Rabil,
President, Rabil Stock Research
On this week's edition of Stock Talk with Joe Rabil, Joe presents a few examples in different timeframes of how to use the RSI indicator for divergences. He explains what to look for when finding counter trend plays, as well as divergence with the trend. Joe then analyses...
READ MORE
MEMBERS ONLY
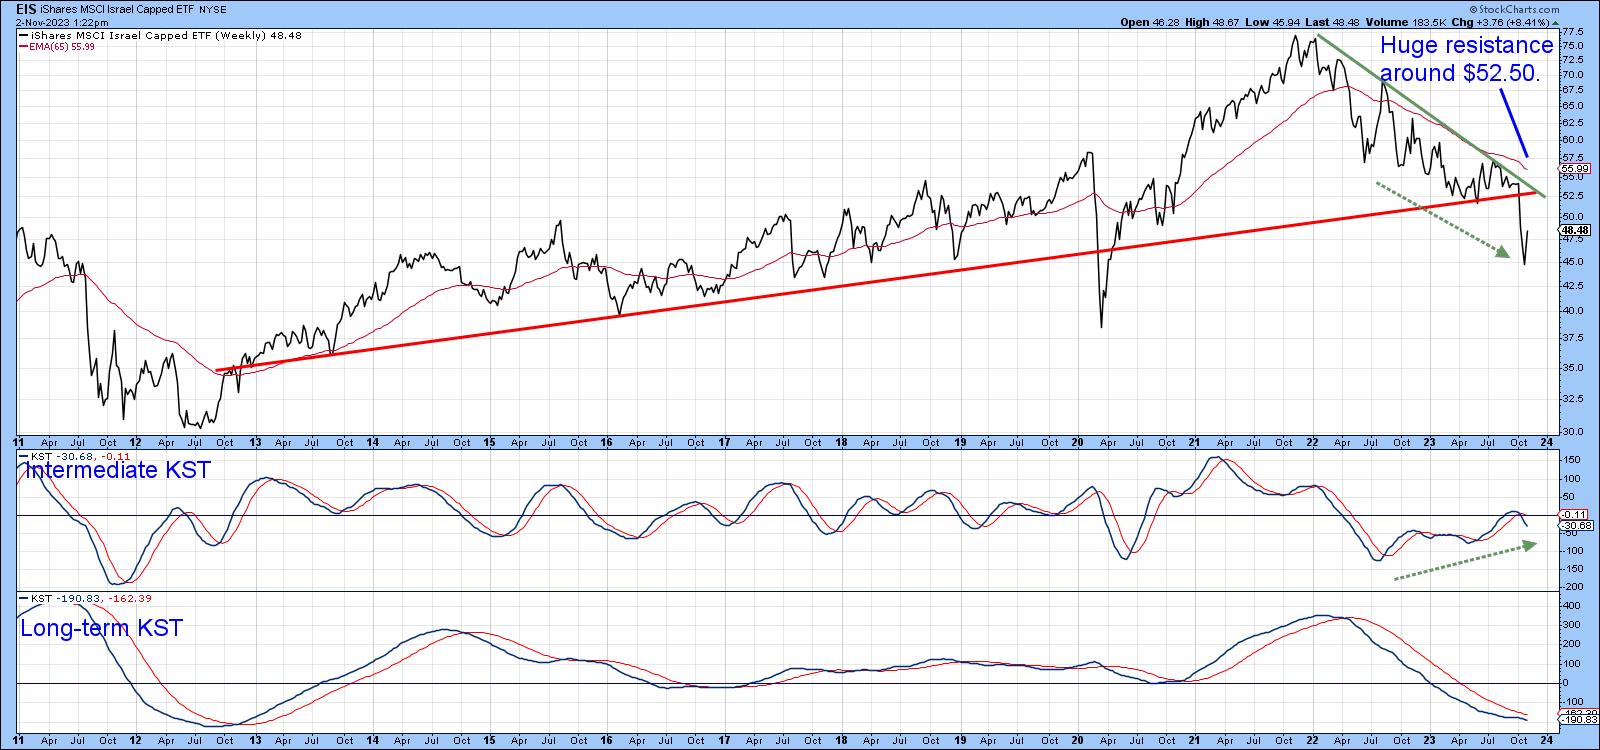
This Country ETF Rallies Sharply After War Breaks Out

by Martin Pring,
President, Pring Research
Understandably, most Middle Eastern country ETFs have performed poorly since the war broke out, but there is one noticeable exception, which I will get to later.
Israel
First, as might be expected, the iShares Israel ETF (EIS) has moved lower and completed what looks to be a massive top. The...
READ MORE
MEMBERS ONLY

Sector Spotlight: Monthly Charts Suggest Downside Risk is Limited

by Julius de Kempenaer,
Senior Technical Analyst, StockCharts.com
On this episode of StockCharts TV's Sector Spotlight, I address the completed monthly charts for October and assess the condition of the long term trends, along with whether they are still in play or have shifted. As usual, I start with the long-term rotation and trends in asset...
READ MORE
MEMBERS ONLY

Signs of Top in Rates As Fed Says NO CHANGE
by David Keller,
President and Chief Strategist, Sierra Alpha Research
In this edition of StockCharts TV'sThe Final Bar, Katie Stockton, CMT of Fairlead Strategies shares her weekly charts of the S&P 500, VIX, and XLK and identifies three areas of opportunity through year-end 2023. Dave breaks down this week's Fed meeting from a technical...
READ MORE
MEMBERS ONLY

Focus on Stocks: November 2023

by Larry Williams,
Veteran Investor and Author
The Million Dollar Stock Market Bet
Warren Buffett proved his point in 2016 when he bet $1,000,000 that the S&P 500 Stock Index would outperform hedge funds. His bet was that active investment management by professionals would under-perform the returns of people who were passively investing....
READ MORE
MEMBERS ONLY
Stock Market Hinges on the Ten Year Interest Rate
by David Keller,
President and Chief Strategist, Sierra Alpha Research
In this edition of StockCharts TV'sThe Final Bar, Tony Dwyer of Canaccord Genuity breaks down four charts that speak to a potential tactical rally for the S&P 500, and explains why this market is still all about interest rates. Meanwhile, Dave charts the downtrend channel for...
READ MORE
MEMBERS ONLY

The Halftime Show: Harness The Strength of Power Gauge on ACP Platform

by Pete Carmasino,
Chief Market Strategist, Chaikin Analytics
On this week's edition of StockCharts TV'sHalftime, Pete starts the show with a review of the Chaikin Power Gauge and demonstrates how to access to the tool on the ACP platform. Pete then reviews a few names that are moving big today, like Amgen (AMGN) and...
READ MORE
MEMBERS ONLY
Sector Spotlight: Seasonality is Dropping Big Bomb on Real Estate Sector
by Julius de Kempenaer,
Senior Technical Analyst, StockCharts.com
On this episode of StockCharts TV's Sector Spotlight, I address the seasonality patterns that are likely to affect stock market and sector performance in the coming month. November is one of the strongest months in the year based on seasonality, but the Real Estate Sector looks to be...
READ MORE
MEMBERS ONLY
Countertrend Rally in the Works for SPX? What the Charts Reveal
by David Keller,
President and Chief Strategist, Sierra Alpha Research
In this edition of StockCharts TV'sThe Final Bar, Dave discusses implications for this week's earnings releases, the November Fed meeting, and geopolitical events. He answers live viewer questions on volume-based indicators, downside targets for the S&P 500 chart, possibilities for a countertrend rally for...
READ MORE
MEMBERS ONLY

DP Trading Room: Bad News for Buyers Weighing Hefty Mortgage Rates
by Erin Swenlin,
Vice President, DecisionPoint.com

by Carl Swenlin,
President and Founder, DecisionPoint.com
In this week's edition of The DecisionPoint Trading Room, Carl opens the show with a look at a very bearish market BIAS Table. He examines how the latest mortgage rates are squeezing buyers and sellers alike by comparing today's mortgage payments versus payments at the lows;...
READ MORE
MEMBERS ONLY
MEM TV: Are the Magnificent Seven Ready to Rally?
by Mary Ellen McGonagle,
President, MEM Investment Research
In this episode of StockCharts TV'sThe MEM Edge, Mary Ellen reviews last week's negative price action in the markets while sharing key areas of possible support for the Nasdaq and S&P 500. She also highlights the relative strength in defensive areas of the market...
READ MORE
MEMBERS ONLY
My Downside Targets for the S&P 500
by David Keller,
President and Chief Strategist, Sierra Alpha Research
KEY TAKEAWAYS
* The S&P 500 has almost reached the minimum downside objective based on the head and shoulders topping pattern.
* SPX 3800 would mean represent a 38.2% retracement level of the March 2020 to January 2022 bull market phase.
If you've been fighting the mounting...
READ MORE
MEMBERS ONLY

29 MUST SEE Charts You Can Start Using Today!
by Grayson Roze,
Chief Strategist, StockCharts.com
On this week's edition of StockCharts TV'sStockCharts in Focus, Grayson gives viewers 29 of the most important charts straight out of his own personal account. He'll review his weekly "Market Evaluation" ChartList and discuss all of the advanced charts within. This entire...
READ MORE
MEMBERS ONLY

Where to Find Stock Opportunities in Bear Territory
by David Keller,
President and Chief Strategist, Sierra Alpha Research
In this edition of StockCharts TV'sThe Final Bar, host Dave wraps a bearish week with a discussion on downtrend conditions, trendline resistance, deteriorating breadth, and finding opportunities in a bearish landscape. He answers viewer questions on inverted yield curves, recessionary periods, and leading vs. lagging technical indicators.
This...
READ MORE
MEMBERS ONLY
GNG TV: Charts Flash Warning Signs of Further Risk to the Downside
by Alex Cole,
Co-founder, GoNoGo Charts®
In this edition of the GoNoGo Charts show, with US Equities delivering a streak of daily gains this week, Alex takes a top down approach to see what the GoNoGo Charts are saying about markets. With U.S. domestic equities in a "NoGo" trend, the charts warn that...
READ MORE
MEMBERS ONLY

Stock Market Indexes Shatter Critical Support Levels. Watch the March Lows.
by Jayanthi Gopalakrishnan,
Director of Site Content, StockCharts.com
KEY TAKEAWAYS
* The Dow, S&P 500, and Nasdaq Composite are trading below their 200-day moving averages
* US Treasury yields are taking a breather now but their near-term action could impact equities, especially big tech stocks
* Investors are anxiously awaiting to hear if Fed Chairman Jerome Powell will lean...
READ MORE
MEMBERS ONLY

Bonds Now Beating Stocks While NVDA Goes into Tailspin
by Julius de Kempenaer,
Senior Technical Analyst, StockCharts.com
KEY TAKEAWAYS
* The Stock/Bond ratio is changing course
* SPY:IEF complets top formation
* NVDA completes large H&S formation unlocking 20% downside risk
SPY:IEF completes top formation
One of the metrics I keep a close eye on is the ratio between stocks and bonds. Most of the...
READ MORE
MEMBERS ONLY
The Halftime Show: Watch the Unemployment Rate - It Could Change Everything!
by Pete Carmasino,
Chief Market Strategist, Chaikin Analytics
On this week's edition of StockCharts TV'sHalftime, Pete explains how his TLT call from 10/10 was spot-on! But that could all change based on the unemployment rate. Pete believes that rates will fallifthe unemployment rate spikes higher, likely to the 4.25-4.5% level. Until...
READ MORE
MEMBERS ONLY

Is the Bear Back?
by Carl Swenlin,
President and Founder, DecisionPoint.com
The S&P 500 (SPY) has fallen about 10 percent from the July top, and the last two weeks has been pretty rough, so should we be looking for the Bear to take charge again?
First, looking at a weekly chart, it is not clear that the Bear actually...
READ MORE
MEMBERS ONLY
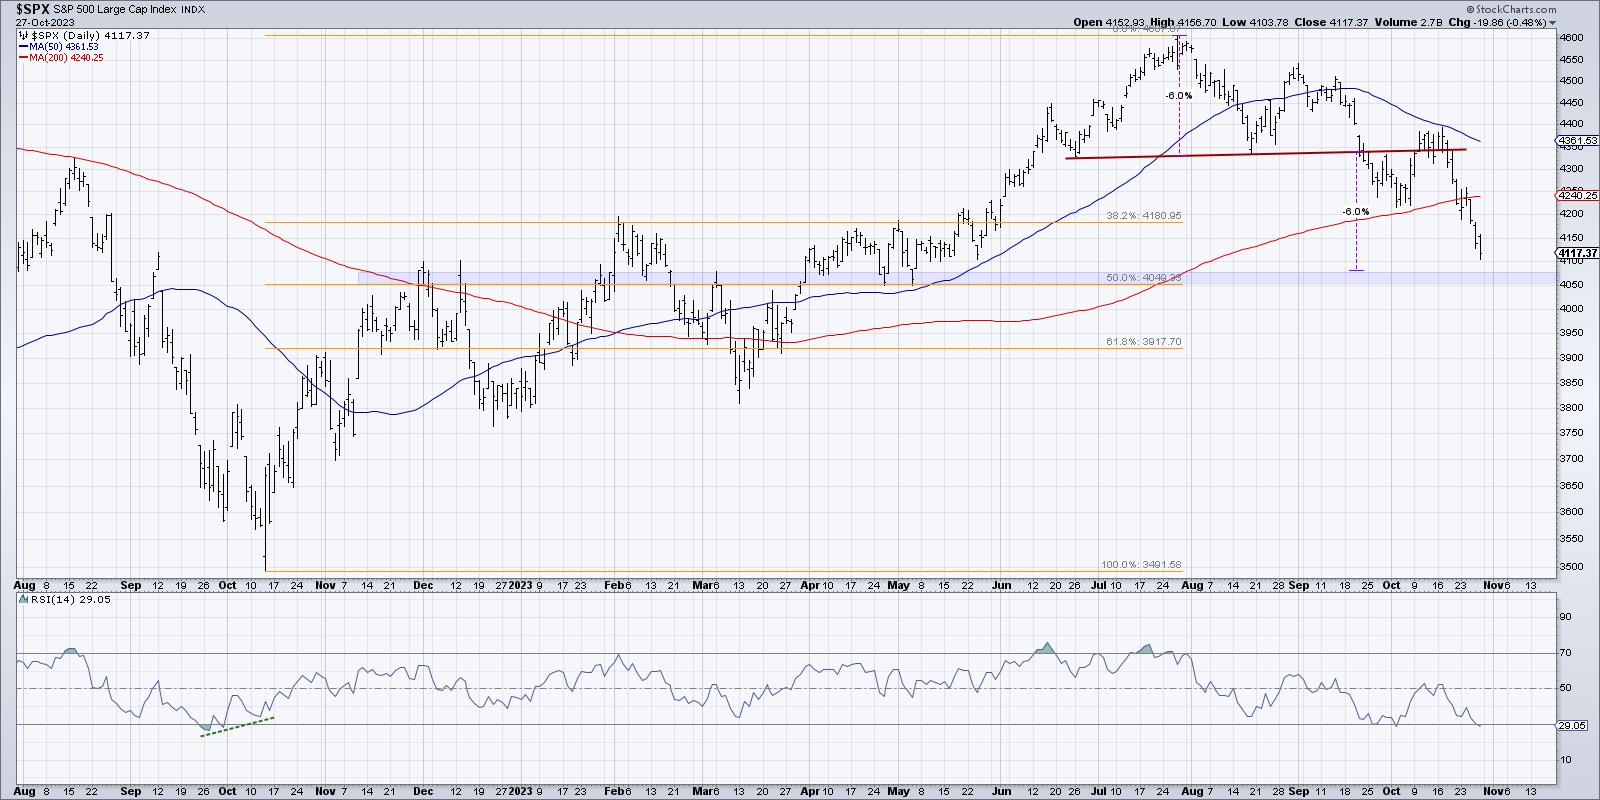
Late-Hour Selloff Confirms Downtrend Phase!
by David Keller,
President and Chief Strategist, Sierra Alpha Research
In this edition of StockCharts TV'sThe Final Bar, guest Tom Bowley of EarningsBeats shares his chart of key ratios illustrating how growth still has held its ground relative to value stocks. Host David Keller, CMT focuses in on distribution in the last hour of trading and highlights one...
READ MORE
MEMBERS ONLY

Market's At RISK in The Mega Cap Bloodbath!

by TG Watkins,
Director of Stocks, Simpler Trading
In this week's edition of Moxie Indicator Minutes, TG discusses how breadth continues to be abysmal, and now that some of the mega caps are reporting earnings, they are getting whacked hard. If they can't hold up, most of the market is at risk of moving...
READ MORE
MEMBERS ONLY
This Powerful MACD/ADX Screener Generates Valuable Ideas
by Joe Rabil,
President, Rabil Stock Research
On this week's edition of Stock Talk with Joe Rabil, Joe shows an intraday trade setup in the SPY that took place this week. He uses the MACD and ADX in multiple timeframes to explain in detail how they can help with our entry and timing. He discusses...
READ MORE
MEMBERS ONLY
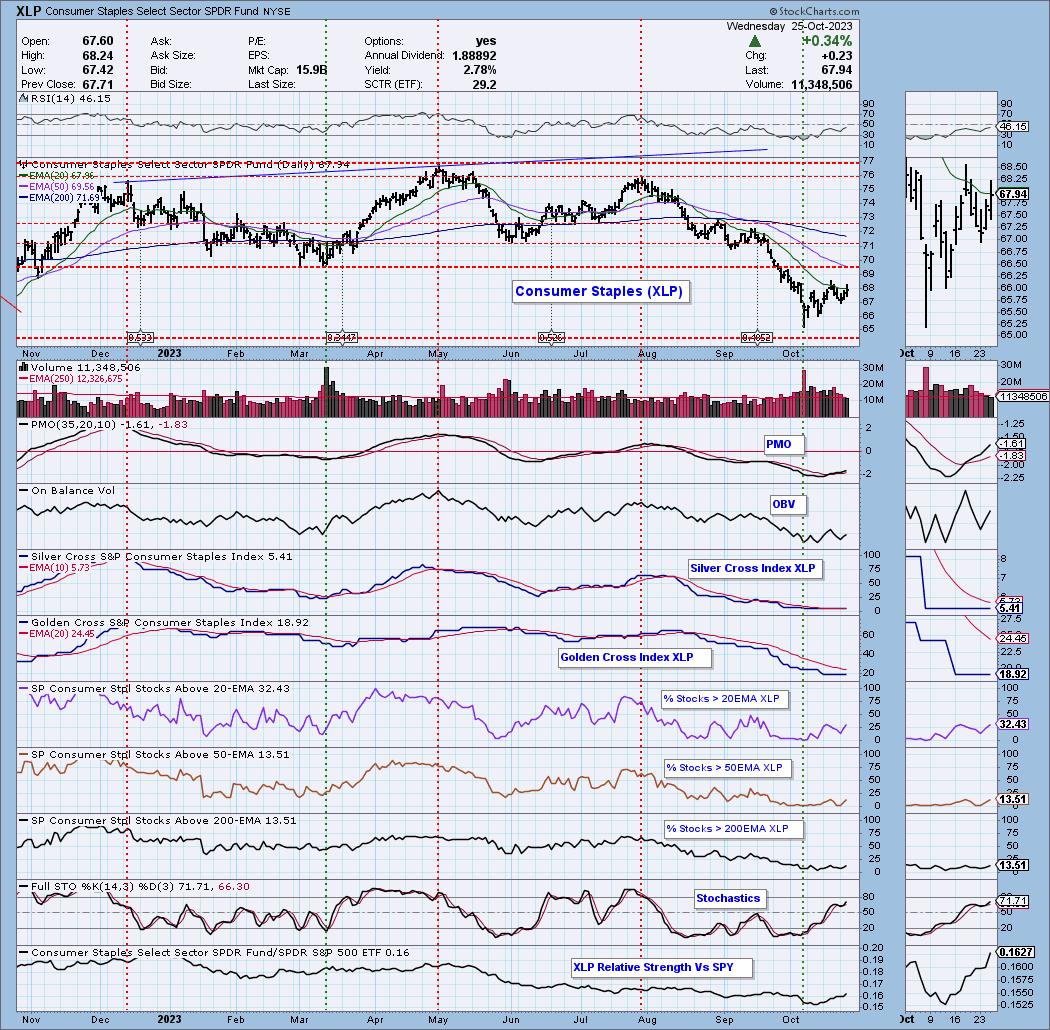
Two Defensive Sectors are Outperforming - What Does This Mean?
by Erin Swenlin,
Vice President, DecisionPoint.com
The only two sectors to close higher on Wednesday were in the defensive category, Consumer Staples (XLP) and Utilities (XLU).
We were already watching XLP as it established a short-term rising trend. What we aren't seeing is healthy participation...yet. We are seeing some expansion in stocks above...
READ MORE
MEMBERS ONLY
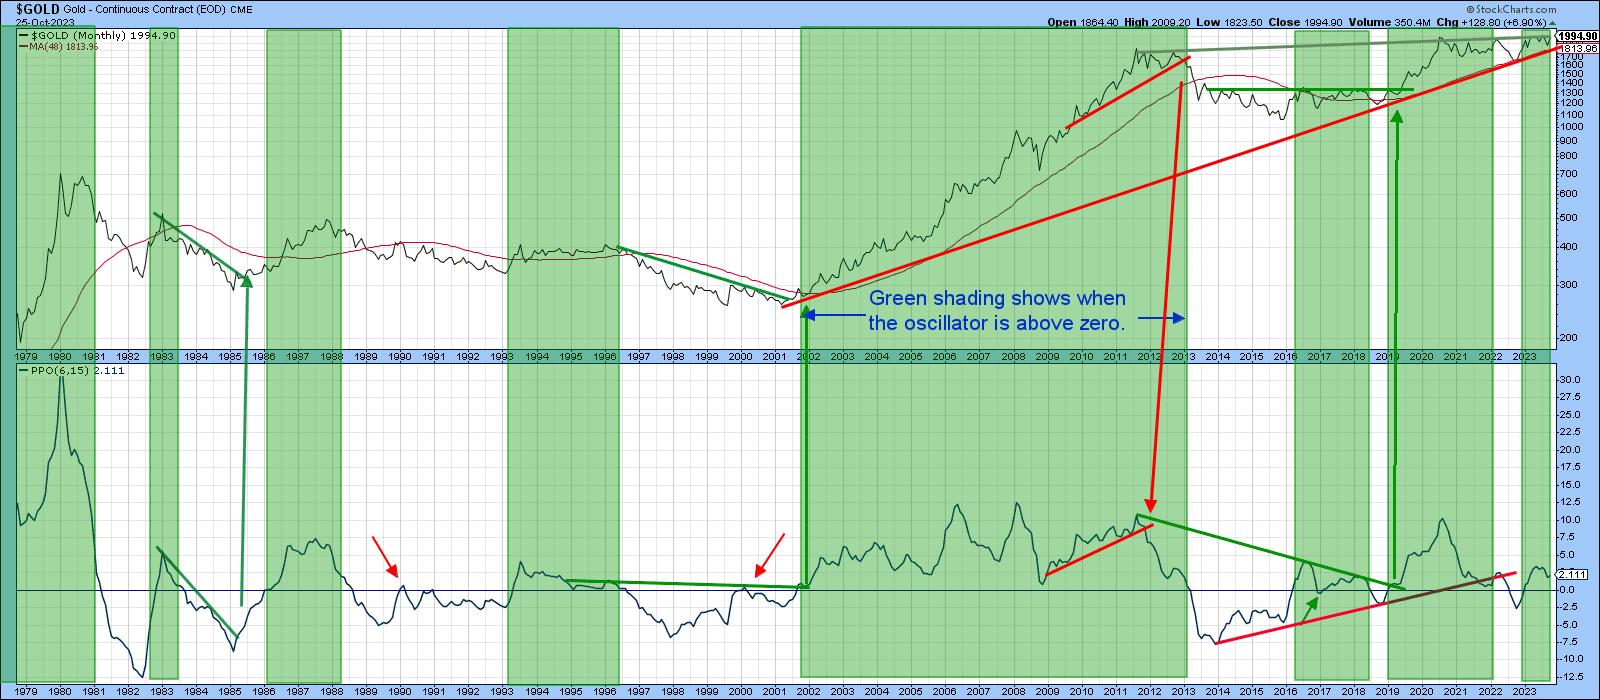
Some Gold Indicators Approach Critical Chart Points
by Martin Pring,
President, Pring Research
When Anwar Sadat, President of Egypt was assassinated in 1981, gold rallied sharply over the near-term, but the advance soon petered out. The reason was that gold was in a primary bear market, so the advance merely represented a counter-cyclical move. Gold has rallied sharply since the Middle East crisis...
READ MORE
MEMBERS ONLY
NASDAQ NOSEDIVES, Down Over 2% At The Close!
by David Keller,
President and Chief Strategist, Sierra Alpha Research
In this edition of StockCharts TV'sThe Final Bar, guest Mary Ellen McGonagle of MEM Investment Research shares three stocks showing promise during a period of severe market distribution. Dave focuses in on the S&P 500 testing Fibonacci support and breaks down earnings for Microsoft, Alphabet, Spotify,...
READ MORE
MEMBERS ONLY
Key Market Relationships for the Next Big Move
First off, we are heading out of town to New York where I will be visiting in studio several media channels and hosts.
Then, we are off to Orlando for the MoneyShow.
On November 1st, Keith and I go on vacation until the middle of the month.
This is the...
READ MORE
MEMBERS ONLY
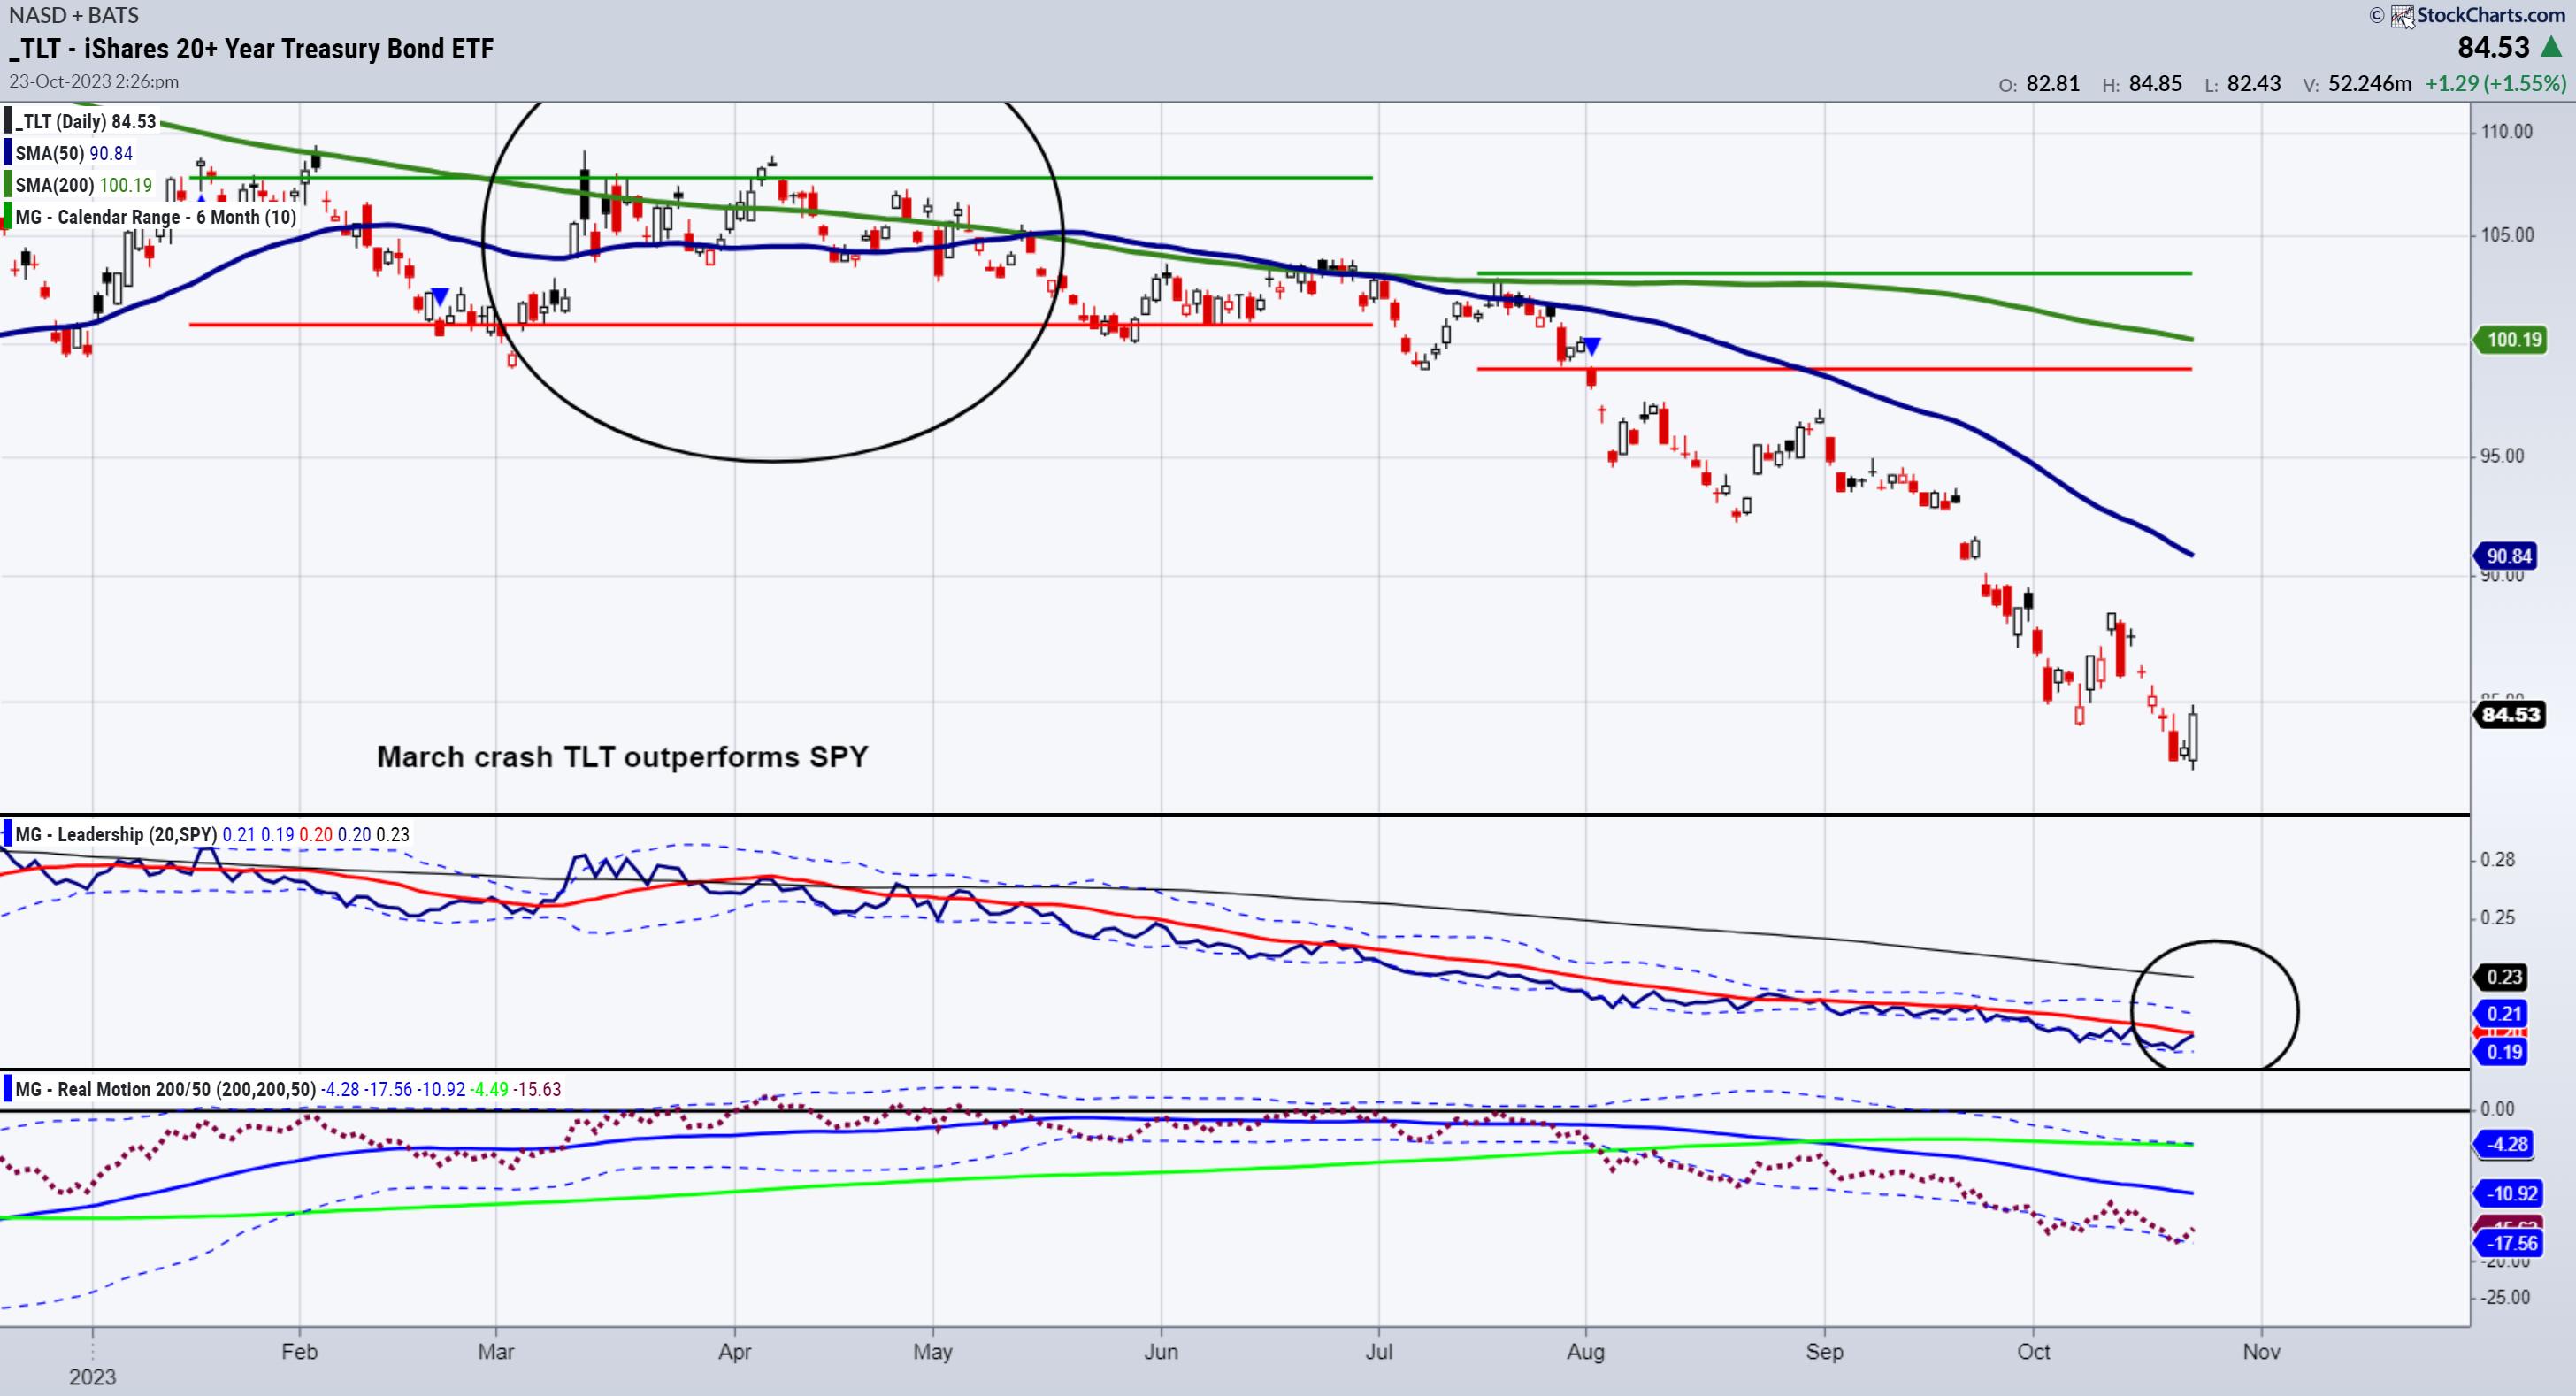
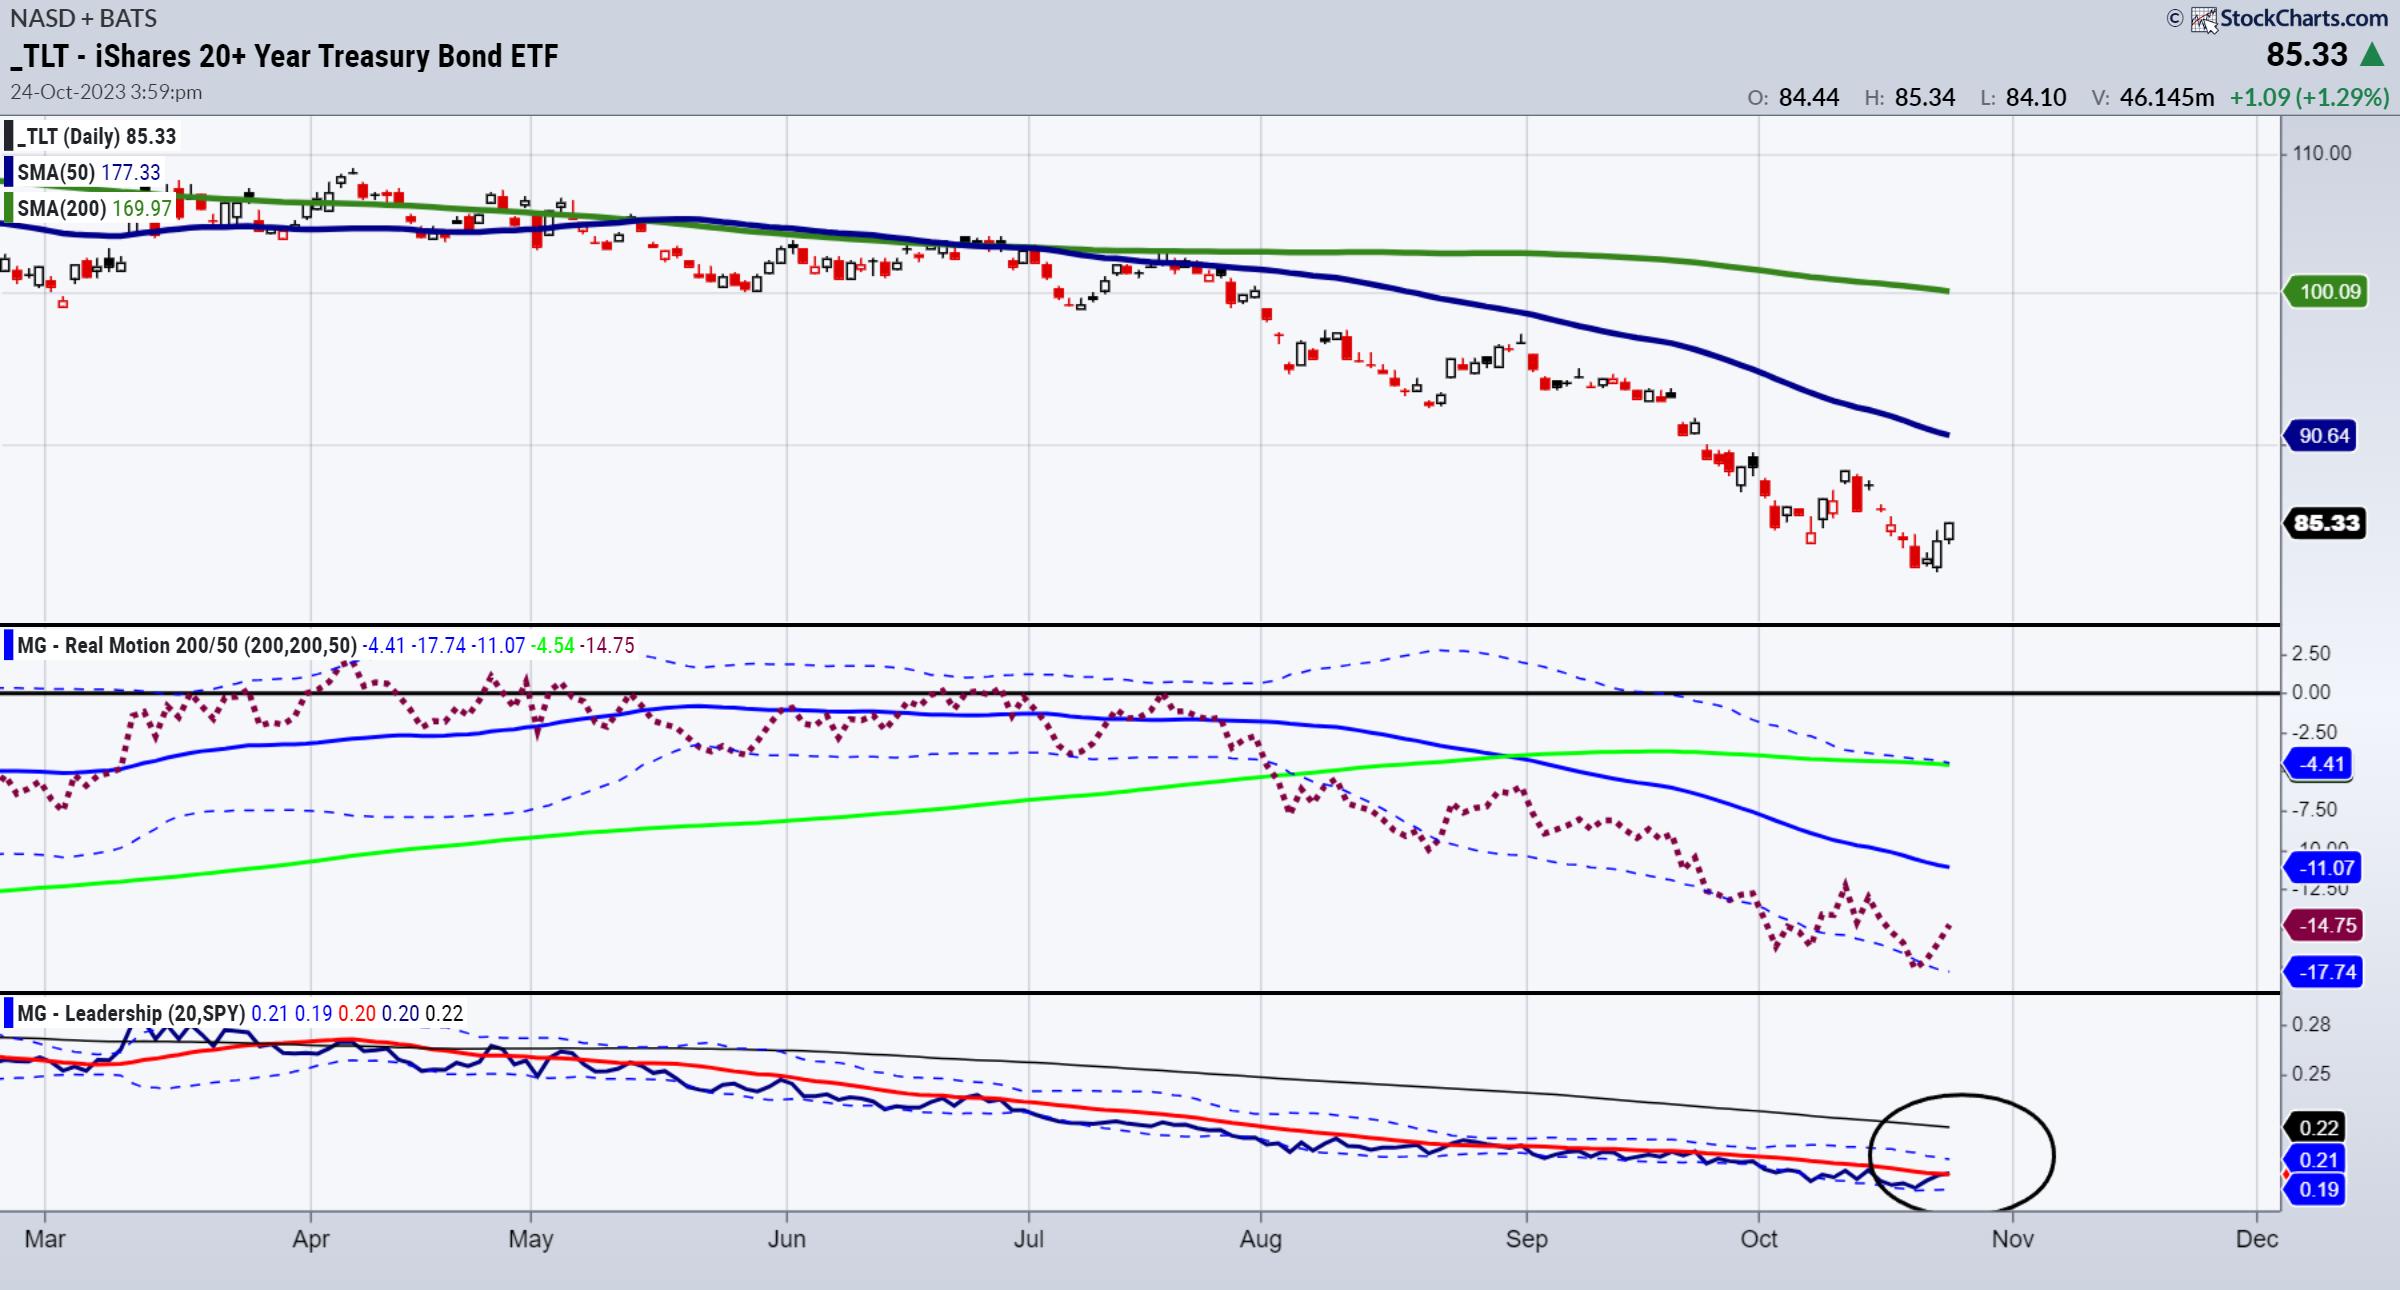
It's All About Risk and the Long Bonds
Monday, after a lot of spooky headlines, the SPDR S&P 500 ETF (SPY) touched its 23-month moving average (MA) or the two-year biz cycle breakout point right around 417.
Plus, the iShares 20+ Year Treasury Bond ETF (TLT)flashed green as didIWM,the small caps.
The big question...
READ MORE
MEMBERS ONLY

Week Ahead: NIFTY May Have Limited Upsides In The Truncated Monthly Expiry Week; Watch These Key Levels
by Milan Vaishnav,
Founder and Technical Analyst, EquityResearch.asia and ChartWizard.ae
The markets wore a largely corrective undertone throughout the past five sessions; it oscillated within a similar range as the previous week and closed on a negative note. The volatility remained on the lower side; as the volatility has been low, the bands contracted as well. As compared to the...
READ MORE
MEMBERS ONLY

Larry's "Family Gathering" October 20, 2023 Recording
by Larry Williams,
Veteran Investor and Author
October is a significant month in the stock market, and in this pre-election year, there's a lot of uncertainty among investors, which makes the stock market more volatile. In this video, Larry discusses the October Seasonality and talks about stocks that generally perform well during the month. You&...
READ MORE
MEMBERS ONLY

Complimentary Edition of the DecisionPoint "Weekly Wrap"
by Carl Swenlin,
President and Founder, DecisionPoint.com
by Erin Swenlin,
Vice President, DecisionPoint.com
KEY TAKEAWAYS
* Golden Cross BUY Signal for Gold
* Death Cross SELL Signal for NYSE Composite
* Death Cross SELL Signal for Materials (XLB)
Gold (GLD) has been strong this month and today its 50-day EMA crossed up through its 200-day EMA (Golden Cross), generating an LT Trend Model BUY Signal. You...
READ MORE
MEMBERS ONLY
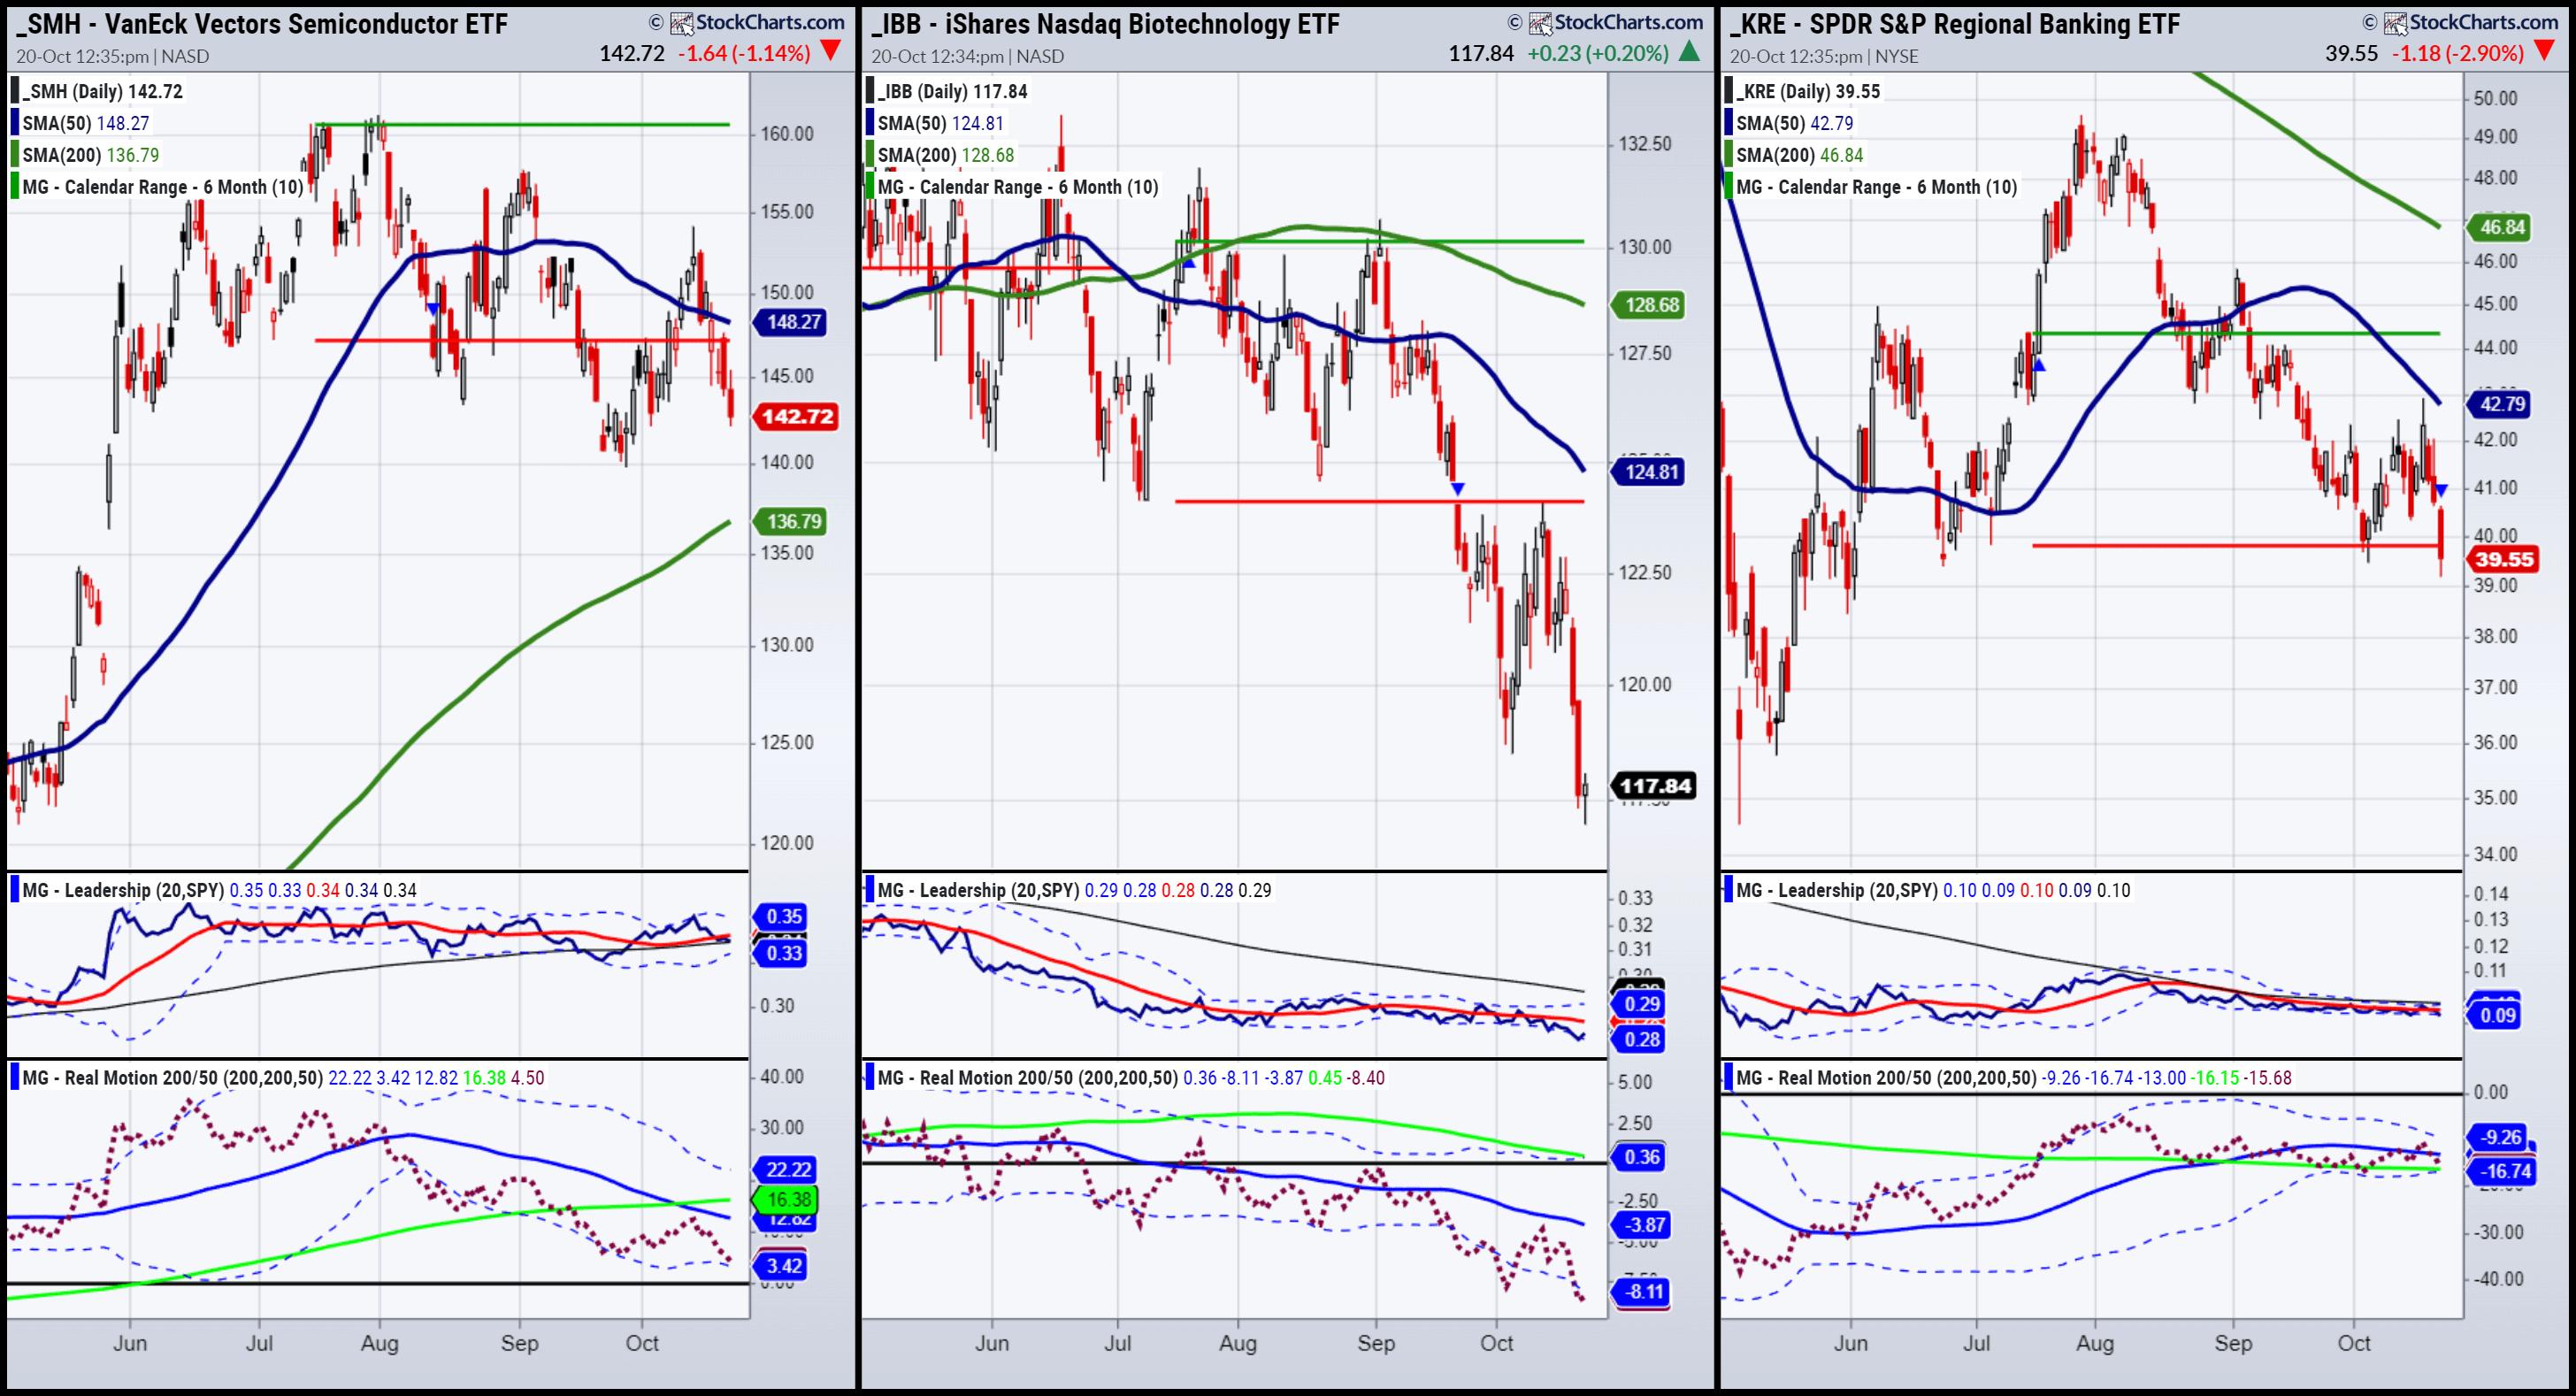
The Kids: Semiconductors, Biotechnology, Regional Banks
Most of you know our Big Viewproduct since I often discuss our risk gauges.
I can report to you that our risk gauges show three out of the five with risk off.
Most interestingly, the SPY continues to outperform the long bonds, risk-on.
And junk bonds continue to outperform long...
READ MORE
