MEMBERS ONLY

BIG DROP IN OIL BOOSTS AIRLINES AND MARKET -- PHARMA HOLDERS ARE TOP ETF -- INTEL PULLS SOX HIGHER -- MAY LEADS RETAIL BOUNCE -- DOW HITS THREE-YEAR HIGH

by John Murphy,
Chief Technical Analyst, StockCharts.com
DRUGS ARE LEADING MARKET HIGHER... In a continuation of yesterday's rebound in the big drug stocks, the Pharm Holders are the day's top sector ETF. Chart 1 shows them rebounding smartly off their 50-day moving average. Pfizer continues to lead the rebound with others that I&...
READ MORE
MEMBERS ONLY

REVIEW OF NBR CONSUMER STAPLE AND DRUG STOCK PICKS -- SHORT TERM OVERBOUGHT BUT LONGER TERM BULLISH
by John Murphy,
Chief Technical Analyst, StockCharts.com
ABBOTT LABS IS SHORT-TERM OVERBOUGHT ... During my TV appearance on the Nightly Business Report last Friday evening, I gave five stock recommendations. All five were in the consumer staple and drug groups and had been shown here over the previous week. As I was mentioning the stocks, NBR showed the...
READ MORE
MEMBERS ONLY

SANTA CLAUS RALLY MAY BE STARTING -- PFIZER BOUNCE HELPS THE DRUGS AND THE DOW -- INTEL REBOUND SHOULD HELP THE SOX
by John Murphy,
Chief Technical Analyst, StockCharts.com
LAST FIVE DAYS OF THE YEAR... The traditional Santa Claus rally may be starting. According to the Stock Traders Almanac, the Santa Claus rally is a "short, sweet, respectable rally within the last five (trading) days of the year and the first two in January". The Almanac points...
READ MORE
MEMBERS ONLY

NBR INTERVIEW TONIGHT -- DOW AND NASDAQ ARE TESTING OIL HIGHS -- BE CAREFUL HERE
by John Murphy,
Chief Technical Analyst, StockCharts.com
TV INTERVIEW TONIGHT ON CHANNEL 13 ... I'll be doing an interview with Paul Kangas on the Nightly Business Report this evening. The shows airs on Channel 13 and runs from 6:30 to 7:00 pm (NYT). The guest is usually interviewed in the second half of the...
READ MORE
MEMBERS ONLY

WHY BOND YIELDS HAVE STAYED SO LOW FOR SO LONG -- AND WHY THEY SHOULD START RISING -- RISING RATES AND OIL COULD CAUSE MARKET PROBLEMS IN THE NEW YEAR
by John Murphy,
Chief Technical Analyst, StockCharts.com
RATES SHOULD BE MOVING HIGHER... This time last year I wrote about my expectation for long-term interest rates to start moving higher during 2004. I got it only half right. They moved higher during the first half, but then fell back during the second half. It looks like bond yields...
READ MORE
MEMBERS ONLY

PLUNGE IN PFIZER UNSETTLES DRUG ETFS -- BUT MOST DRUG LEADERS ARE HOLDING UP OK
by John Murphy,
Chief Technical Analyst, StockCharts.com
PFIZER PLUNGES 14%... Today's news that Pfizer's drug Celebrex may increase the risk of heart attacks took the stock -- and the drug group -- completely by surprise this morning. Chart 1 shows today's plunge to a new low by Pfizer. Several other drug...
READ MORE
MEMBERS ONLY

ABBOTT LABS AND SCHERING PLOUGH ALSO HIT 52-WEEK HIGHS IN STRONG DRUG GROUP --- BRISTOL MYERS SQUIBB BREAKS OUT OF BASE
by John Murphy,
Chief Technical Analyst, StockCharts.com
MORE DRUG LEADERS ... In my earlier market message, I showed today's explosive upmove in the pharmaceutical group -- spearheaded by Johnson & Johnson. I mentioned, however, these next two stocks who also qualify as drug leaders. The weekly bars in Chart 1 show Abbott Labs trading over 45...
READ MORE
MEMBERS ONLY

BIG JUMP IN PHARMACEUTICALS IS PULLING HEALTHCARE SECTOR HIGHER -- JOHNSON & JOHNSON IS STAR OF THE DAY.
by John Murphy,
Chief Technical Analyst, StockCharts.com
HEALTHCARE IS TOP SECTOR... I've been writing recently about the revival in the Healthcare sector. Today it looks like the healthiest part of the market. On Tuesday I showed the Health Care Select Sector SPDR (XLV) closing over its 200-day average for the first time since June, and...
READ MORE
MEMBERS ONLY

DOLLAR DROP BOOSTS GOLD AND OIL -- DOLLAR HURT BY DROP IN PURCHASES OF U.S. ASSETS
by John Murphy,
Chief Technical Analyst, StockCharts.com
FOREIGN PURCHASES OF US ASSETS ARE SLOWING... The recent bounce in the dollar -- and the pullback in foreign currencies -- didn't last long. The dollar is falling sharply again today and foreign currencies are jumping. Chart 1 shows the Euro having bounced off initial support at its...
READ MORE
MEMBERS ONLY
WHY IT'S TIME FOR CONSUMER STAPLES TO START SHOWING LEADERSHIP -- THEY FOLLOW ENERGY -- HEALTHCARE IS ALSO TURNING UP
by John Murphy,
Chief Technical Analyst, StockCharts.com
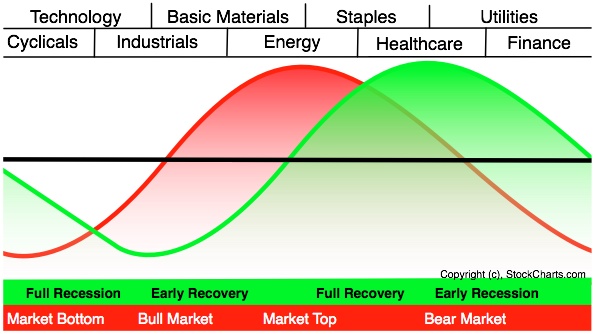
ENERGY AND THEN STAPLES... Market sectors have a tendency to show market leadership in a certain order. They don't always follow the order exactly, but there is a strong tendency not to get too far out of line. Chart 1 shows the "ideal" order during an...
READ MORE
MEMBERS ONLY

OIL IS RETESTING LONG-TERM SUPPORT AT $40 -- COMMODITIES TESTING MOVING AVERAGE SUPPORT
by John Murphy,
Chief Technical Analyst, StockCharts.com
CRUDE OIL TESTING $40 SUPPORT... Last week's price drop has pushed crude oil within a dollar of potential long-term support around $40. I've written a few times about my belief that $40 would be the new floor under the oil market. That belief is being tested....
READ MORE
MEMBERS ONLY

CAMPBELL SOUP, GILLETTE, AND SARA LEE ARE ALSO CONSUMER LEADERS.-- GE SHOWING MARKET LEADERSHIP -- P&F CHARTS OF MAJOR STOCK INDEXES -- RUSSELL 2000 MAY BE STARTING FOURTH WAVE CONSOLIDATION
by John Murphy,
Chief Technical Analyst, StockCharts.com
CAMPBELL SOUP IS HEATING UP ... I wrote yesterday about new buying in the consumer staple group and showed a handful of recent stock leaders. With all the recent attention being given to basic material, gold, oil, and technology stocks, it's possible that a lot of investors may be...
READ MORE
MEMBERS ONLY

ANSWERS TO QUESTIONS ON SEMICONDUCTORS
by John Murphy,
Chief Technical Analyst, StockCharts.com
WHAT ABOUT THE 50-DAY AVERAGE?... I received several questions about my piece on the short-term breakdown in the Semiconductor (SOX) Index yesterday. One asked if it wasn't too soon to abandon semiconductors since the SOX was still over its 50-day average. I totally agree. And I wasn'...
READ MORE
MEMBERS ONLY

IS DECEMBER BUYING OF CONSUMER STAPLES SENDING A CAUTION SIGNAL FOR THE MARKET?
by John Murphy,
Chief Technical Analyst, StockCharts.com
NEW SIGNS OF STRENGTH ... Yesterday I wrote about how the healthcare sector was starting to move up in the relative strength rankings. I mentioned that over the previous week, HC had moved into third place behind technology and consumer staples. One of our readers asked if new buying in HC...
READ MORE
MEMBERS ONLY

ALTERA AND XILINX PULL SOX LOWER -- SEMICONDUCTOR HOLDERS GIVE SHORT-TERM SELL
by John Murphy,
Chief Technical Analyst, StockCharts.com
ALTERA AND XILINX FALL HARD ... Both chip stocks cut earnings forecasts and are falling heavily today on rising volume. Charts 1 and 2 show the chart damage being done. Both stocks have gapped beneath moving average lines and previous breakout points along thier September/October highs. With the trading day...
READ MORE
MEMBERS ONLY

BIOTECHS HELP BOOST HEALTHCARE SECTOR -- AMGEN IS MOVING HIGHER -- BIOGEN IDEC BREAKS OUT -- HEALTCHARE IS GETTING BETTER
by John Murphy,
Chief Technical Analyst, StockCharts.com
BIOTECHS ARE DAY'S STRONGEST GROUP ... Biotech stocks are not only helping the healthcare sector today; they're also the day's strongest industry group. And their charts are starting to look more promising. Chart 1 shows the Biotechnology Index in an apparent "ascending triangle"...
READ MORE
MEMBERS ONLY

JUMP IN OVERSOLD DOLLAR CAUSES BIG DROP IN GOLD -- RECENT DROP IN GOLD SHARES WERE EARLY WARNING -- AUSTRALIA AND CANADIAN ETFs ARE ALSO DROPPING ON COMMODITY SELLOFF
by John Murphy,
Chief Technical Analyst, StockCharts.com
FOREIGN CURRENCIES ARE FALLING ... A sharp rebound in an oversold dollar is causing heavy selling on foreign currencies. Chart 1 shows the Euro gapping down to 132 today and nearing a test of its 20-day moving average. The Japanese yen has already broken that initial support line and is headed...
READ MORE
MEMBERS ONLY

BASIC MATERIALS LEAD MARKET LOWER -- PROFIT-TAKING HITS NASDAQ -- CISCO BREAKOUT ATTEMPT FAILS -- SAME WITH THE SEMIS
by John Murphy,
Chief Technical Analyst, StockCharts.com
COMMODITY STOCKS ARE FALLING ... Almost anything related to commodities fell hard today. Gold stocks have been falling for a week. And so have oil stocks. Another big drop in crude today pushed the Energy Select Sector SPDR ( XLE) under its 50-day moving average for the first time in three months...
READ MORE
MEMBERS ONLY

NETWORKERS STILL SHOWING LEADERSHIP BUT ARE UP AGAINST SOME RESISTANCE -- NASDAQ COMPOSITE IS ALSO TESTING EARLY 2004 HIGH
by John Murphy,
Chief Technical Analyst, StockCharts.com
REVISITING NETWORKERS... Back in mid-November, I wrote about the Network iShares (IGN) breaking through their 200-day moving average (see red circle) and starting to move from technology laggards to leaders November 15, 2004. That leadership is continuing today. In fact, the IGN is the day's strongest sector ETF....
READ MORE
MEMBERS ONLY

INTEL PUSHES SOX OVER 200-DAY AVERAGE -- MAJOR HEAD AND SHOULDER BOTTOMS? P&F CHART OF SEMICONDUCTOR HOLDERS
by John Murphy,
Chief Technical Analyst, StockCharts.com
INTEL TRYING TO HOLD GAP AREA... I'm going to take a close look at Intel because of its importance in the Semiconductor (SOX) Index and the Nasdaq market (not to mention the Dow and the S&P 500). A bullish report last Thursday caused Intel to gap...
READ MORE
MEMBERS ONLY

APPLYING POINT & FIGURE SIGNALS TO MAJOR STOCK INDICES -- UPTRENDS ARE STILL INTACT -- HOLDING ON WITH PROTECTIVE STOPS
by John Murphy,
Chief Technical Analyst, StockCharts.com
P&F CHART OF NASDAQ 100 ... The main benefit of point & figure charts is that they give precise buy and sell signals. A buy signal occurs when a column of x's exceeds a previous x column. A sell doesn't occur until a column of...
READ MORE
MEMBERS ONLY

OCTOBER TOP IN OIL IS NORMAL -- FALLING CRUDE IS FUELING FOURTH QUARTER MARKET RALLY -- WHY $40 SHOULD BE NEW FLOOR UNDER CRUDE OIL
by John Murphy,
Chief Technical Analyst, StockCharts.com
OCTOBER TOP IS NORMAL... Since the direction of crude oil is so important to the stock market, and because I've received so many questions on the energy sector this week, I'd like to spend more time on the subject. Before doing so, however, I'd...
READ MORE
MEMBERS ONLY

WHAT TO DO WITH ENERGY NOW -- THE NEED FOR SOME TECHNICAL READING
by John Murphy,
Chief Technical Analyst, StockCharts.com
LONG-TERM CHART OF OIH ... Once again, I need to clarify the difference between short and long-term market action. A reader recently asked where the next upside target for the OIH was. I showed the following chart with an upside target near 98. That was a long-term projection. Obviously, this week&...
READ MORE
MEMBERS ONLY

OIL FALLS EVEN FURTHER -- GOLD STOCKS ARE TURNING DOWN -- BIOTECHS AND DRUGS BOOST HEALTHCARE -- ASIAN ETFS ARE BOUNCING -- CANADA IS CORRECTING WITH COMMODITIES
by John Murphy,
Chief Technical Analyst, StockCharts.com
ENERGY CONTINUES TO CORRECT ... With crude oil falling another dollar today, energy stocks remain on the defensive. The weakest part of the energy sector -- oil service -- is falling the hardest. Chart 1 shows the Oil Service Holders (OIH) breaking their 50-day average. A further drop to the early...
READ MORE
MEMBERS ONLY

HUGE OIL PLUNGE PUSHES MARKET TO NEW HIGHS -- AIRLINES BREAKOUT -- SOX CLOSES OVER 200-DAY AVERAGE -- NASDAQ COMPOSITE NEARS 2004 HIGH -- FOURTH QUARTER RALLY RESUMES
by John Murphy,
Chief Technical Analyst, StockCharts.com
CRUDE DROPS $3.64 ON THE DAY ... Crude oil plunged over $3 today (-7.4%) and is on the verge of undercutting its mid-November low. That took place after crude had recovered half of its recent price drop from $55 to $45, and suggests the likelihood that it will now...
READ MORE
MEMBERS ONLY

DROP IN OIL AND RISE IN SOX BOOSTS MARKET -- AIRLINES LEAD TRANSPORTS HIGHER -- RISING RATES HURTS UTILITIES
by John Murphy,
Chief Technical Analyst, StockCharts.com
DROP IN OIL HURTS OSX -- SOX IS RETESTING 200-DAY LINE ... The market is reacting very positively to today's big drop in the price of crude. As a result, Energy is one of the few sectors in the red today (along with Utilities. More on the utility selling...
READ MORE
MEMBERS ONLY

GATEWAYS SOARS -- RETAILERS GETTING MARKED DOWN -- NEWMONT SELLS OFF ON VOLUME -- DOLLAR NEARS MAJOR SUPPORT
by John Murphy,
Chief Technical Analyst, StockCharts.com
GATEWAY HITS 52-WEEK HIGH ... Even on a relatively flat market day, there's always something going up. Today it was Gateway. The stock was the biggest percentage gainer in the S&P 500. And its daily bars in Chart 1 pretty much speak for themselves. GTW broke through...
READ MORE
MEMBERS ONLY

WAL-MART SINKS RETAILERS WHICH WEIGH ON MARKET -- JUMP IN BOND YIELDS HASN'T CHANGED MARKET'S TREND BUT DOES RAISE THE RISK LEVEL
by John Murphy,
Chief Technical Analyst, StockCharts.com
STOCK PLUNGES 3.4% ... Retailers are the day's weakest stock market group. The main reason is today's 3.4% plunge in the stock of Wal-Mart which is the world's largest retailer. In so doing, the stock is suffering some serious chart damage. Just recently,...
READ MORE
MEMBERS ONLY

TEN-YEAR T NOTE YIELD HITS THREE MONTH HIGH ON FEAR OF LESS FOREIGN BUYING -- THAT COULD HURT RATE-SENSITIVE STOCKS, BUT COULD LEAD TO BOUNCE IN AN OVERSOLD DOLLAR
by John Murphy,
Chief Technical Analyst, StockCharts.com
FEAR OF LESS FOREIGN BUYING ... Not too long ago I wrote that there were two main side-effects that would flow from a falling dollar. One was, of course, higher commodity prices. The other was the flow of funds into foreign markets. Money tends to flow from countries with falling currencies...
READ MORE
MEMBERS ONLY

LARGE CAP VALUE INDEX HITS NEW HIGH -- EXXON MOBIL PROVIDES A LOT OF VALUE -- NEXT UPSIDE TARGET FOR OIL SERVICE HOLDERS -- INTERNATIONAL PAPER LEAD PAPERS HIGHER -- HAPPY THANKSIVING
by John Murphy,
Chief Technical Analyst, StockCharts.com
TURKEY BOUNCE STILL FAVORS VALUE... The market enjoyed its traditional pre-Thanksgiving bounce. All the major averages ended the day in plus territory with the the S&P 500 closing up nearly 5 points. The hourly bars in Chart 1 show, however, that the S&P 500 is still...
READ MORE
MEMBERS ONLY

DOLLAR DECLINE NEARS SUPPORT AT 1995 LOW -- GOLD STOCKS ARE STARTING TO SLIP WHICH WARNS OF PULLBACK IN BULLION
by John Murphy,
Chief Technical Analyst, StockCharts.com
BE CAREFUL WITH THE DOLLAR... If you've been reading my commentary for any length of time, you'll know that I've been bearish on the dollar for more than two years. My book on Intermarket Analysis, which was written last year, devoted a lot of...
READ MORE
MEMBERS ONLY

SMALL CAPS STILL LEAD LARGE CAPS -- LARGE CAP VALUE BEATING GROWTH -- IT'S THE DIVIDENDS
by John Murphy,
Chief Technical Analyst, StockCharts.com
SMALL CAPS STILL LEAD LARGE CAPS ... Small caps have been the best performers by size this year. The Russell 2000 Small Cap Index has gained 11% this year versus 6% for the large cap Russell 1000 Index and the S&P 500 Large Cap Index. Midcaps came in second...
READ MORE
MEMBERS ONLY

INFLATION PROTECTED SECURITIES (OR TIPS) ARE ONE WAY TO HOLD BONDS WITH SOME PROTECTION AGAINST INFLATION -- THEY'RE ALSO THE STRONGEST BOND CATEGORY
by John Murphy,
Chief Technical Analyst, StockCharts.com
TIPS ARE INFLATION PROTECTED BONDS... With all the talk about protecting oneself against rising inflation pressures resulting from higher commodities and a falling dollar, it's worth considering Inflation Protected Securities (or TIPS). These are Treasury bonds that are indexed to the rate of inflation as measured by the...
READ MORE
MEMBERS ONLY

HOW TO PLAY HARD ASSETS WITH STOCKS , ETFS AND MUTUAL FUNDS -- NEW GOLD ETF IS LAUNCHED
by John Murphy,
Chief Technical Analyst, StockCharts.com
ANOTHER LOOK AT THE CRB/SPX RATIO ... One of our newer readers expressed puzzlement at the ratio of the CRB/S&P 500 chart that I showed on Friday. The chart is a ratio of the CRB Index (representing commodities). The point of the chart was simply to show...
READ MORE
MEMBERS ONLY

RESPONSES TO QUESTIONS ON THE S&P 500
by John Murphy,
Chief Technical Analyst, StockCharts.com
A CORRECTION ... In my Friday evening message, I mentioned that the 1140 level for the S&P 500 was important because it represented a couple of percentage retracement levels. One of our readers pointed out, however, that one of the numbers was incorrect. Here are the right numbers. Chart...
READ MORE
MEMBERS ONLY

FALLING DOLLAR, RISING RATES AND RISING OIL CAUSE STOCK SELLING -- BARRICK GOLD HITS 5 YEAR HIGH -- BAKER HUGHES HAS BULLISH TRIANGLE -- A DECADE FOR HARD ASSETS
by John Murphy,
Chief Technical Analyst, StockCharts.com
ANOTHER LOOK AT RSI AND ADX ... It looks like I got a little too cute with my short-term reading of the RSI and ADX lines. Since I've gotten several questions on them, and given today's stock selling, I need to do some more explaining (and a...
READ MORE
MEMBERS ONLY

GREENSPAN SPEECH PUSHES DOLLAR TO FOUR-YEAR LOW AGAINST THE YEN -- THAT'S BOOSTING GOLD AND GOLD STOCKS -- JUMP IN OIL AND BOND YIELDS CAUSE PROFIT-TAKING IN STOCKS
by John Murphy,
Chief Technical Analyst, StockCharts.com
DOLLAR PLUNGES AGAINST THE YEN ... In a speech today, Mr. Greenspan expressed concern that foreign investors might tire of financing the big U.S. trade deficit unless they were rewarded with higher interest rates. He also showed no enthusiasm for stopping the dollar slide which is accelerating to the downside....
READ MORE
MEMBERS ONLY

OIL SECTOR NEARS UPSIDE BREAKOUT -- DUPONT PLAYS CATCH UP WITH CHEMICAL RALLY -- APPLIED MATERIALS UPSIDE TURNAROUND HELPS PUT SOX OVER 200-DAY LINE -- NASDAQ 100 HITS NEW HIGH -- WEEKLY CHART SHOWS FIFTH WAVE TARGET
by John Murphy,
Chief Technical Analyst, StockCharts.com
ENERGY SECTOR IS RISING AFTER ALL ... With crude oil trying to stabilize in the $46-47 dollar range (and in an oversold condition), energy stocks are starting to climb again. In fact, Energy was the day's top market sector. Chart 1 shows the Energy Select Sector SPDR surviving another...
READ MORE
MEMBERS ONLY

RISING SOX IS PULLING ASIA HIGHER -- YOU CAN BUY THE TAIWAN ETF OR TAIWAN SEMICONDUCTOR -- BUYING JAPANESE STOCKS AND THE YEN WITH ONE ETF -- GLOBAL RALLY IS GOOD FOR US
by John Murphy,
Chief Technical Analyst, StockCharts.com
SOX IS CHALLENGING 200-DAY LINE... A strong technology sector is leading the market into a broad-based rally today with the major stock indexes resuming their fourth quarter uptrends. Good news from Hewlett Packard and Kmart's purchase of Sears helped light the fuse. The strongest technology group, however, is...
READ MORE
MEMBERS ONLY

PRODUCER INFLATION JUMPS SHARPLY -- THAT'S BAD FOR BONDS AND EVENTUALLY FOR STOCKS -- BUT GOOD FOR GOLD -- SIMILARITIES TO THE 1970'S
by John Murphy,
Chief Technical Analyst, StockCharts.com
PPI HITS 14-YEAR HIGH ... The latest Producer Price Index (PPI) report saw a shocking jump of 1.7%, which is the biggest monthly jump in fourteen years. Most of the gain came from rising food and energy prices, but it can't be ignored. That also puts producer price...
READ MORE