MEMBERS ONLY

BANKS AND FINANCIALS HAVE A STRONG DAY -- RUSSELL 2000 ISHARES HIT 7-MONTH HIGHS

by John Murphy,
Chief Technical Analyst, StockCharts.com
FINANCIAL SPDR TRIES TO CLEAR 200-DAY LINE... Higher bond yields and a steeper yield curve usually benefit financial stocks and banks in particular. Which helps explain why financials are starting to attract new buying. Chart 1 shows the Financial SPDR (XLF) trading above its 200-day moving average today for the...
READ MORE
MEMBERS ONLY

BOND YIELDS TOUCH FOUR-MONTH HIGH - THAT'S HELPING FINANCIAL SHARES -- AND VALUE CYCLICAL STOCKS IN GENERAL -- SMALL CAPS SHOW SOME LEADERSHIP
by John Murphy,
Chief Technical Analyst, StockCharts.com
BOND YIELDS TOUCH FOUR-MONTH HIGH... Treasury bond yields continue their rise that started a week ago. And they're overcoming some resistance levels. Chart 1 shows the 30-Year Treasury Yield rising above its late August high to reach the highest level since June. It's also testing its...
READ MORE
MEMBERS ONLY

STOCKS END VOLATILE FRIDAY IN THE RED -- BUT GAIN ON THE WEEK -- TECH STOCKS WEAKENED ON FRIDAY WHILE CYCLICAL SECTORS GAINED -- REITS AND UTILITIES LED WEEK'S GAINS -- BOND YIELDS ALSO ROSE
by John Murphy,
Chief Technical Analyst, StockCharts.com
STOCKS END VOLATILE FRIDAY LOWER... Stocks opened sharply lower on Friday on news that President Trump and the First Lady had tested positive for the coronavirus. Then news of some possible fiscal stimulus helped them make back some of their earlier losses. By the end of the day, however, all...
READ MORE
MEMBERS ONLY
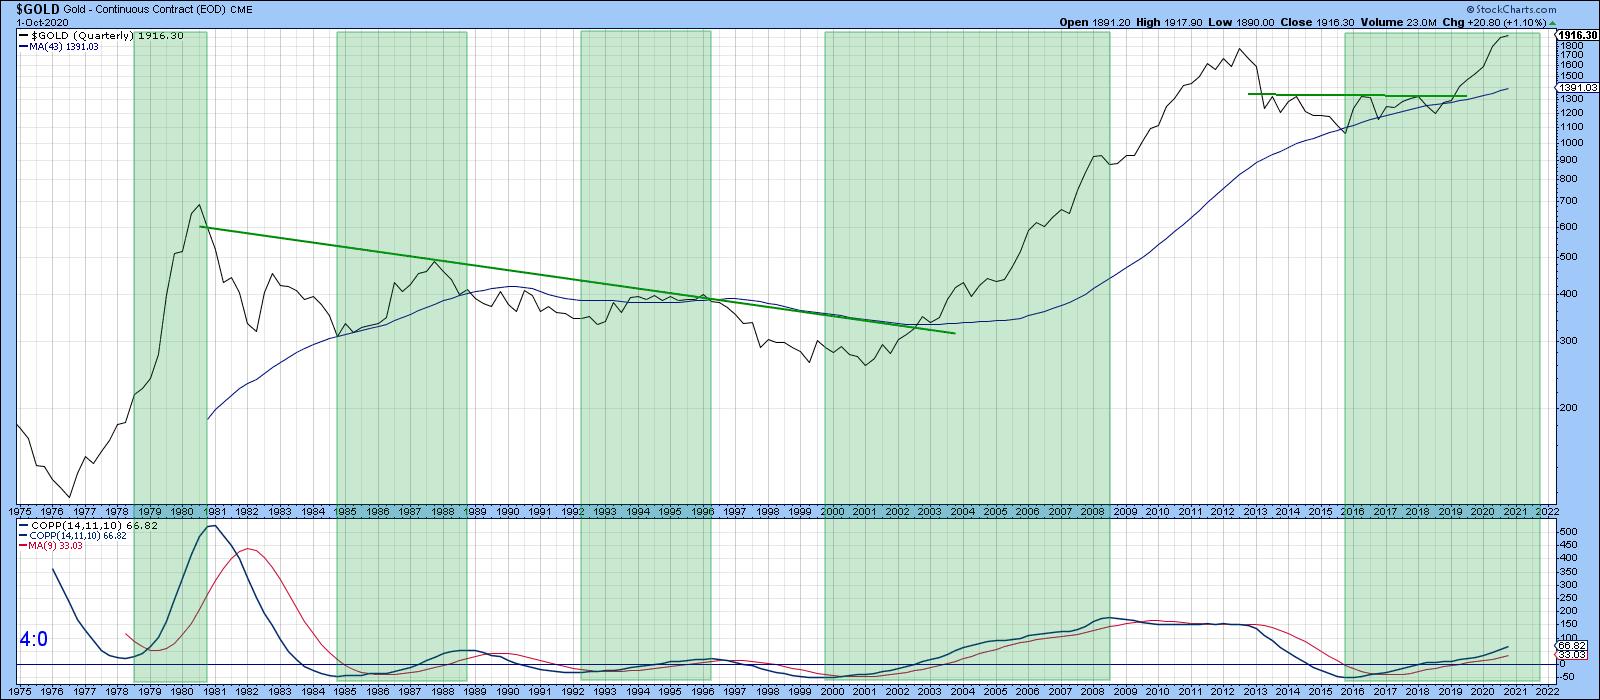
The Gold Bull Market is Likely to Extend Once the Correction Runs its Course

by Martin Pring,
President, Pring Research
* Coppock Indicator Using Quarterly Data is Bullish
* Monthly-Based Gold Model is a Long Way from a Sell Signal
* Inflation-Adjusted Gold at Mega Resistance
* When Will the Correction Have Run its Course?
Coppock Indicator Using Quarterly Data is Bullish
Long-term Charts show that gold is in a firm uptrend. Take Chart...
READ MORE
MEMBERS ONLY

The Next Market Low and Election Rally

by Larry Williams,
Veteran Investor and Author
On this special episode of Real Trading with Larry Williams, Larry is back to give a follow-up on his last special regarding Chinese stocks, with an aside for Korea. He then discusses the "Uncle Sam" index and his exclusive ACP Plug-In indicators, followed by an overview of who...
READ MORE
MEMBERS ONLY

STOCKS HAVE ANOTHER STRONG DAY -- BOND YIELDS ARE ALSO CLIMBING
by John Murphy,
Chief Technical Analyst, StockCharts.com
STOCKS INDEXES GAIN MORE GROUND... Stocks are building on their earlier gains from Monday and are trading above their 50-day lines as shown on the three following charts. Chart 1 shows that the next test of overhead resistance for the Dow Industrials could come at at 28,400 which was...
READ MORE
MEMBERS ONLY

MAJOR STOCK INDEXES TRADE ABOVE THEIR 50-DAY AVERAGES -- ALL ELEVEN SECTORS ARE IN THE GREEN -- SMALL CAPS AND TRANSPORTS ARE STRONG
by John Murphy,
Chief Technical Analyst, StockCharts.com
STOCK INDEXES REGAIN THEIR 50-DAY LINES... Global stocks are starting the week on a strong note. The three major stock indexes shown below are all trading above their 50-day moving average lines. That strengthens their short-term trend and puts them in position to regain some ground lost during the month...
READ MORE
MEMBERS ONLY

APPLYING MOVING AVERAGES TO THE THREE MAJOR STOCK INDEXES
by John Murphy,
Chief Technical Analyst, StockCharts.com
DOW AND S&P 500 TRY TO STABILIZE NEAR MOVING AVERAGE LINES... A lot more attention is being paid to moving average lines this month because they help determine where potential support and resistance levels may lie. Two that have been mentioned quite a bit lately are the 50-...
READ MORE
MEMBERS ONLY

STRONGER DOLLAR HURTS PRECIOUS METALS -- STOCK INDEXES BACK OFF FROM 50-DAY AVERAGES AND BROKEN SUPPORT
by John Murphy,
Chief Technical Analyst, StockCharts.com
RISING DOLLAR PUSHES PRECIOUS METALS LOWER... With global stocks on the defensive over the last week, some money has flowed into the relative safety of the U.S. dollar. Chart 1 shows the Invesco Dollar Index (UUP) climbing to the highest level in two months. As usually happens when the...
READ MORE
MEMBERS ONLY

S&P Performance Relative to the World Reaches a Crucial Juncture
by Martin Pring,
President, Pring Research
For many years, the S&P Composite (SPY) has outperformed the MSCI World Stock ETF (ACWI). The benefit of the doubt continues to move in favor of the US, but this relationship has reached a crucial juncture point and needs to bounce; otherwise, some serious technical damage will transpire....
READ MORE
MEMBERS ONLY

GLOBAL STOCKS SELL OFF -- DOW AND S&P 500 APPEAR HEADED TOWARD THEIR 200-DAY MOVING AVERAGES
by John Murphy,
Chief Technical Analyst, StockCharts.com
DOW AND S&P 500 HEADING TOWARD 200-DAY LINES... Stocks are selling off all over the world today. With 50-day moving averages having already been broken, 200-day averages are now in play. Chart 1 shows the Dow Industrials approaching their 200-day line (red arrow) which isn't that...
READ MORE
MEMBERS ONLY

NASDAQ 100 BREAKS SHORT-TERM SUPPORT AS 50-DAY AVERAGES GIVE WAY -- S&P 500 ALSO TURNS DOWN
by John Murphy,
Chief Technical Analyst, StockCharts.com
NASDAQ 100 TURNS DOWN... The daily bars in Chart 1 show the QQQ breaking last week's short-term support and falling further below its 50-day moving average today. The two upper boxes in Chart 1 also show its RSI and MACD lines continuing to decline. That suggests more selling...
READ MORE
MEMBERS ONLY

Some Sectors Starting to Rotate from their Post-March Pattern
by Martin Pring,
President, Pring Research
From time to time, I like to review the various sectors to see which ones are in a positive or negative relative trend and which might be in a position to change. To do this, I use what I call my Nirvana Template or, in StockCharts-speak, Nirvana Chart Style. It...
READ MORE
MEMBERS ONLY

NASDAQ LEADS TODAY'S RETREAT -- LAST WEEK'S LOWS ARE BEING RETESTED -- SO ARE 50-DAY AVERAGES
by John Murphy,
Chief Technical Analyst, StockCharts.com
MAJOR STOCK INDEXES RETEST LAST WEEK'S LOW... Stocks are under pressure and are retesting lows formed late last week. And are putting 50-day moving averages in jeopardy on daily charts. The tech-driven Nasdaq is leading today's retreat. The hourly bars in Chart 1 show the Invesco...
READ MORE
MEMBERS ONLY

DOW TRANSPORTS NEAR NEW RECORD -- FEDEX IS THE DAY'S BIGGEST WINNER -- AIRLINES ARE STARTING TO HELP -- SOUTHWEST AIRLINES TESTING JUNE HIGH
by John Murphy,
Chief Technical Analyst, StockCharts.com
DOW TRANSPORTS NEAR RECORD TERRITORY...The weekly bars in Chart 1 show the Dow Transports rising above their late 2019 peak and challenging their 2018 intra-day peak at 11623. A close above that level would put the Dow Transports in record territory. Their relative strength ratio in the upper box...
READ MORE
MEMBERS ONLY

MATERIALS SPDR HITS NEW RECORD -- AVERY DENNISON AND WESTROCK ACHIEVE BULLISH BREAKOUTS -- DOW HOLDINGS HEADING TOWARD 2019 HIGH
by John Murphy,
Chief Technical Analyst, StockCharts.com
MATERIALS SPDR HITS NEW RECORD... Stocks are trading higher today with ten of eleven sectors in the green. The only one to hit a new record is shown below. Chart 1 shows the Materials SPDR (XLB) trading at a new record high. Its relative strength line in the upper box...
READ MORE
MEMBERS ONLY

VALUE STOCKS CONTINUE TO LAG BEHIND GROWTH STOCKS -- FINANCIALS ARE HOLDING VALUE BACK -- RATIOS SHOW GROWTH STILL IN THE LEAD
by John Murphy,
Chief Technical Analyst, StockCharts.com
S&P 500 GROWTH ISHARES HOLD 50-DAY LINE... A lot has been written about the relationship between growth and value shares. During last week's pullback in technology shares, cheaper value stocks held up better which raised questions about whether a rotation was starting from growth into value...
READ MORE
MEMBERS ONLY

A NUMBER OF NEGATIVE DIVERGENCES SUGGEST MORE VOLATILITY AHEAD
by John Murphy,
Chief Technical Analyst, StockCharts.com
TECHNICAL DIVERGENCES WARN OF MORE VOLATILITY... We're all focused on the meaning and severity of the recent selloff in stocks and trying to determine if this is a short-term pullback or something more serious. A number of technical divergences that have appeared on price charts suggest that the...
READ MORE
MEMBERS ONLY

If it's a Bull Market Correction, What Should We Look for to Signal the All-Clear?
by Martin Pring,
President, Pring Research
* Some Indicators Have Moved to Levels Consistent with a Low
* Others Suggest the Likelihood of More Corrective Activity
* Indicators that Should Be Monitored for a Possible Upside Reversal
Some Indicators Have Moved to Levels Consistent with a Low
Most corrections in a bull market fall in the 5-10% range. So...
READ MORE
MEMBERS ONLY

AN HOURLY LOOK AT QQQ REBOUND
by John Murphy,
Chief Technical Analyst, StockCharts.com
HOURLY CHART SHOWS OVERHEAD RESISTANCE... The hourly price bars in Chart 1 show the Invesco QQQ Trust which measures the Nasdaq 100 Index trying to build on yesterday's bounce off its 50-day moving average. The big question is whether a bottom has been seen, or whether more testing...
READ MORE
MEMBERS ONLY

NASDAQ CONTINUES TO LEAD STOCKS LOWER -- AND IS TESTING ITS 50-DAY MOVING AVERAGE
by John Murphy,
Chief Technical Analyst, StockCharts.com
NASDAQ COMPOSITE IS TESTING ITS 50-DAY AVERAGE.. The tech-driven Nasdaq market continues to lead the market lower. Chart 1 shows the Nasdaq Composite Index in the process of testing its 50-day average. That's an important test for it and the rest of the market. Chart 2 shows the...
READ MORE
MEMBERS ONLY

STRONG JOBS REPORT BOOSTS BOND YIELDS -- THAT'S HELPING LIFT FINANCIALS -- SOME MONEY MAY ALSO BE ROTATING OUT OF TECH STOCKS INTO CHEAPER FINANCIALS
by John Murphy,
Chief Technical Analyst, StockCharts.com
STRONG JOBS REPORT BOOSTS BOND YIELDS...This morning's strong jobs report saw a bigger than expected jump in nonfarm payrolls during August and a bigger than expected drop in the unemployment report to 8.4%. That strong combination helped contribute to today's rebound in bond yields....
READ MORE
MEMBERS ONLY
September 3, 1929 was the Peak; September 3, 2020 sees the NASDAQ Lose Almost 5%
by Martin Pring,
President, Pring Research
I don't think there is a connection between 1929 and 2020, but the headline seemed too good to pass up. Late last week, I mentioned that September is the weakest month of the year for stocks while October is prone to crashes. "Welcome to the bearish season,...
READ MORE
MEMBERS ONLY

STOCKS HAVE WORST DAY SINCE JUNE 11 -- QQQ IS LEADING IT LOWER ON RISING VOLUME
by John Murphy,
Chief Technical Analyst, StockCharts.com
NASDAQ 100 LEADS MARKET LOWER... The tech-dominated Nasdaq is leading the market lower today for the worst drop since June 11. Today's negative combination of falling prices and rising volume suggests that there's more selling to come. The Candlevolume bars in Chart 1 show the Invesco...
READ MORE
MEMBERS ONLY

OVERBOUGHT TECHNOLOGY SECTOR STARTS TO WEAKEN -- TODAY'S TECH SELLING IS HAVING A NEGATIVE IMPACT ON THE REST OF THE MARKET
by John Murphy,
Chief Technical Analyst, StockCharts.com
NASDAQ PULLS BACK FROM OVERBOUGHT TERRITORY... It shouldn't come as surprise to read that the Nasdaq has been in overbought territory. So is the technology sector. And both are leading the market lower today. The top box in Chart 1 shows the 14-day RSI line for the Technology...
READ MORE
MEMBERS ONLY

TWITTER MAY BE BREAKING OUT -- VERIZON NEARS NEW RECORD
by John Murphy,
Chief Technical Analyst, StockCharts.com
TWITTER CLEARS RESISTANCE... My August 26 message showed our first chart today with the caption that Twitter might be breaking out. Today's action suggests that upside breakout may finally be taking place. Chart 1 shows Twitter (TWTR) climbing more than 2% and trading at the highest level in...
READ MORE
MEMBERS ONLY

CHEMICALS HELP LEAD MATERIALS HIGHER -- ALBEMARLE AND DOW HOLDINGS HIT SIX MONTH HIGHS -- ALCOA AND NUCOR GAIN MORE GROUND
by John Murphy,
Chief Technical Analyst, StockCharts.com
MATERIALS LEAD MARKET HIGHER... On a strong market day, six sectors are in the black with materials in the lead. Chart 1 shows the Materials Sector SPDR (XLB) gaining 2% today to hit a new record. Its relative strength line in the upper box is bouncing as well after declining...
READ MORE
MEMBERS ONLY

AGRICULURAL COMMODITIES JOIN COMMODITY RALLY -- COFFEE AND SOYBEANS NEAR UPSIDE BREAKOUTS -- LUMBER SETS NEW RECORD
by John Murphy,
Chief Technical Analyst, StockCharts.com
COMMODITY RALLY CONTINUES... Previous messages have pointed out that a two-year low in the U.S. Dollar Index was helping to lift commodity prices. And that's still the case. Chart 1 shows the Invesco Commodity Index (DBC) moving further above its 200-day moving average. Most of those messages,...
READ MORE
MEMBERS ONLY

PRECIOUS METALS BOUNCE BACK FROM YESTERDAY'S SELLING -- AND REMAIN ABOVE SUPPORT LEVELS -- THE FED'S NEW PATIENCE ON INFLATION SHOULD BE GOOD FOR GOLD AND SILVER
by John Murphy,
Chief Technical Analyst, StockCharts.com
GOLD SPDR HOLDS SUPPORT... My Wednesday message showed precious metals and their miners pulling back to underlying support levels within major uptrends. That's still the case. My message from yesterday described profit-taking in those same precious metals following an upside spike in bond yields after the head of...
READ MORE
MEMBERS ONLY

Eight Charts I Am Watching Closely Right Now
by Martin Pring,
President, Pring Research
* Strong Bull Market Indications
* Short-Term Vulnerability?
Strong Bull Market Indications
We are all aware of the Shakespearian saying "Beware of the Ides of March," which didn't go so well for Julius Caesar. In market folklore, October is the season for crashes and September is the worst-performing...
READ MORE
MEMBERS ONLY

10-YEAR YIELD AT TWO-MONTH HIGH -- RISE IN YIELDS BOOSTS FINANCIALS -- BUT MAY BE WEIGHING ON PRECIOUS METALS
by John Murphy,
Chief Technical Analyst, StockCharts.com
TEN-YEAR TREASURY YIELD REACHES TWO-MONTH HIGH...Bond yields are climbing today. That may be a reaction to Mr. Powell's speech suggesting that the Fed was relaxing its attitude toward the possibility of rising inflation. Treasury bonds are being sold as a result which is boosting bond yields. The...
READ MORE
MEMBERS ONLY

GOLD AND SILVER ETFS TEST UNDERLYING SUPPORTS WITHIN MAJOR UPTRENDS -- SO DO THEIR MINERS
by John Murphy,
Chief Technical Analyst, StockCharts.com
GOLD ETF AND ITS MINERS TEST UNDERLYING SUPPORT... Precious metals have spend most of August pulling back from their recent strong advances which has enabled them to work off some short-term overbought conditions. And they're testing underlying support levels. Chart 1 shows the Gold SPDR (GLD) testing a...
READ MORE
MEMBERS ONLY

FACEBOOK AND NETFLIX LEAD COMMUNICATIONS HIGHER -- TWITTER MAY BE BREAKING OUT
by John Murphy,
Chief Technical Analyst, StockCharts.com
COMMUNICATION SERVICES LEAD MARKET HIGHER... Chart 1 shows the Communication Services SPDR (XLC) climbing nearly 2% today to a new record. It's relative strength line in the upper box is breaking out as well. It's two biggest percentage gainers are Netflix and Facebook. Chart 2 shows...
READ MORE
MEMBERS ONLY

GAP AND GENERAL MOTORS HELP LEAD XLY HIGHER TODAY -- REBOUND IN TRAVEL & TOURISM STOCKS BOOSTS EXPEDIA
by John Murphy,
Chief Technical Analyst, StockCharts.com
GAP AND GENERAL MOTORS HELP LEAD CYCLICALS HIGHER... My weekend message showed the Consumer Discretionary SPDR (XLY) setting new records. It's hitting another one today led higher by cruise lines, clothing, travel & tourism, gambling, and apparel retailers. Two stocks in particular show up on today's...
READ MORE
MEMBERS ONLY

S&P 500 ENDS WEEK AT NEW RECORD -- TECHNOLOGY STOCKS CONTINUE TO LEAD -- SO DO CONSUMER DISCRETIONARY STOCKS -- ESPECIALLY STOCKS TIED TO HOUSING
by John Murphy,
Chief Technical Analyst, StockCharts.com
S&P 500 HITS NEW RECORD ON FRIDAY... The S&P 500 hit a record close on Tuesday and on Friday exceeded its February intra-day peak at 3393 to confirm a new all-time high as shown by the weekly bars in Chart 1. The Nasdaq hit another record...
READ MORE
MEMBERS ONLY

TESTING PROCESS CONTINUES FOR S&P 500 -- ANOTHER LOOK AT BOLLINGER BANDS
by John Murphy,
Chief Technical Analyst, StockCharts.com
S&P 500 STILL HASN'T CLEARED FEBRUARY INTRA-DAY HIGH... The news media has been quick to declare a new record high in the S&P 500. However, we may not be there just yet. The SPX did hit a new closing high. The February intra-day high,...
READ MORE
MEMBERS ONLY

Dollar Bear to Take a Breather?
by Martin Pring,
President, Pring Research
* The Bear Market Case
* Time for a Counter-Cyclical Rally?
The Bear Market Case
By most methods and approaches, the Dollar Index is in a bear market. Take Chart 1, for instance, which compares the Index to its long-term KST. The pink-shaded areas tell us when it is below its 12-month...
READ MORE
MEMBERS ONLY

FALLING DOLLAR BOOSTS COMMODITIES -- PRECIOUS METALS REBOUND -- COPPER CONTINUES TO GAIN -- COMMODITY INDEX CLEARS 200-DAY AVERAGE
by John Murphy,
Chief Technical Analyst, StockCharts.com
DOLLAR INDEX HITS ANOTHER LOW... The greenback continues its decline to the lowest level in nearly two years. Chart 1 shows the Invesco US Dollar Bullish Fund (UUP) falling to another multi-year low today. And it's falling against all of its major trading partners. As is normally the...
READ MORE
MEMBERS ONLY

S&P 500 TESTING ITS FEBRUARY HIGH -- USING BOLLINGER BANDS FOR GUIDANCE
by John Murphy,
Chief Technical Analyst, StockCharts.com
S&P 500 IS TESTING ITS FEBRUARY HIGH... The most important test going on at the moment is the S&P 500 challenging its February high. Its highest intra-day value shown in Chart 1 is 3393.52. The SPX closing high for February was 3386.15. Although the...
READ MORE
MEMBERS ONLY

WEAK DOLLAR ALSO BOOSTS EMERGING MARKET ETFS -- SOUTH KOREA ETF IS BREAKING OUT -- TAIWAN IS ALREADY IN RECORD TERRITORY
by John Murphy,
Chief Technical Analyst, StockCharts.com
EMERGING MARKET ETFS ALSO BENEFIT FROM WEAKER DOLLAR... My earlier message today made the point that a weaker dollar is benefiting foreign stock ETFs that are quoted in dollars. The message showed the rising euro benefiting eurozone ETFs with Germany on the verge of a bullish breakout. The same principle...
READ MORE