MEMBERS ONLY

Market Hits Resistance, So What's Next?

by Martin Pring,
President, Pring Research
* Averages Reach Resistance
* Selected Emerging Markets Starting to Look Interesting
Last week, I wrote that, while my view on the primary trend remained bearish, I thought the lows established a couple of weeks or so ago stood a good chance of holding for a while. That view was based on...
READ MORE
MEMBERS ONLY

RATIO ANALYSIS SHOWS A MAJOR SHIFT OUT OF STOCKS AND INTO BONDS -- ALL BOND CATEGORIES OUTPERFORMED STOCKS SINCE OCTOBER -- TREASURIES ARE DOING BETTER THAN INVESTMENT GRADE CORPORATES -- WHILE HIGH YIELD JUNK BONDS ARE THE WEAKEST BOND CATEGORY

by John Murphy,
Chief Technical Analyst, StockCharts.com
COMPARISON OF TWO VANGUARD FUNDS SHOWS BONDS IN THE LEAD ... In good times when investors are confident about the economy, they usually favor stocks over bonds. One of the ways we can tell when investors are starting to lose confidence is when they start favoring bond holdings over stocks. And...
READ MORE
MEMBERS ONLY

DOLLAR INDEX FALLS TO THREE-MONTH LOW -- THAT'S BOOSTING COMMODITY PRICES WITH GOLD IN THE LEAD -- A WEAK DOLLAR IS ALSO BOOSTING RELATIVE PERFORMANCE OF FOREIGN SHARES -- ESPECIALLY EMERGING MARKETS
by John Murphy,
Chief Technical Analyst, StockCharts.com
DOLLAR INDEX FALLS TO THREE MONTH LOW... The U.S. dollar has come under heavy selling pressure. Chart 1 shows the Dollar Index Fund (UUP) tumbing to the lowest level since last October. That's giving a boost to foreign currencies which are gaining ground today. That includes both...
READ MORE
MEMBERS ONLY

An Intermediate Oversold Condition Suggests That The December Low Is Likely To Hold For Several Months
by Martin Pring,
President, Pring Research
* Short/Intermediate Oversold Condition
* High-Low Data Reaches an Extreme
* The Bear is Still With Us Until It Isn’t
As we all know, markets have a strong tendency to swing from excessive optimism to extremes of pessimism. During the last month, we have certainly seen a substantial amount of pessimism...
READ MORE
MEMBERS ONLY

STOCK REBOUND CONTINUES -- PRICES RECOVER SOME LOSSES SUFFERED OVER THE LAST THREE MONTHS BUT REMAIN IN DOWNTRENDS -- STOCK INDEXES APPROACH POTENTIAL OVERHEAD RESISTANCE BARRIERS
by John Murphy,
Chief Technical Analyst, StockCharts.com
U.S. STOCK INDEXES CONTINUE JANUARY REBOUND ... Stock prices are trending higher again this morning which continues the rebound that started right after Christmas. Today's three price charts reflect that short-term improvement, while keeping them in a longer-range perspective. The main point of the charts is that all...
READ MORE
MEMBERS ONLY

APPLE PLUNGES ON SALES WARNING -- STOCK INDEXES ARE FAILING AT OVERHEAD RESISTANCE LEVELS -- TREASURY YIELD FALLS TO LOWEST LEVEL IN A YEAR AS BOND PRICES SURGE -- GOLD AND YEN BENEFIT FROM SAFE HAVEN BUYING
by John Murphy,
Chief Technical Analyst, StockCharts.com
APPLE PLUNGES ON FIRST QUARTER WARNING ... The price of Apple is plunging today after issuing a sales warning for the first quarter. The stock was already in trouble before that announcement. The weekly bars in Chart 1 show Apple (AAPL) falling today to the lowest level since the middle of...
READ MORE
MEMBERS ONLY
January 2019 Market Roundup with Martin Pring
by Martin Pring,
President, Pring Research
The Market Roundup Video For January is now available.
Good luck and good charting,
Martin J. Pring
The views expressed in this article are those of the author and do not necessarily reflect the position or opinion ofPring Turner Capital Groupof Walnut Creek or its affiliates....
READ MORE
MEMBERS ONLY

Could Gold Be The Big Winner In 2019?
by Martin Pring,
President, Pring Research
* Two Failed Outside Bars
* Long-Term Indicators Tipping to the Bullish Side
* Gold and the Shares Perking Up Against Equities in General
* Silver Setting Up for a Possible Major Breakout
Just before Christmas, I pointed out that the gold price, especially the shares, had experienced an outside day. Going by that...
READ MORE
MEMBERS ONLY

PREVIOUS INSTANCES OF FED TIGHTENING ACCOMPANIED RISING COMMODITY PRICES -- THE FED IS RAISING RATES NOW WHILE COMMODITIES ARE PLUNGING -- WEAK CHINESE MARKET IS PULLING COMMODITIES LOWER -- AND REFLECTS A SLOWING GLOBAL ECONOMY
by John Murphy,
Chief Technical Analyst, StockCharts.com
LAST TWO YIELD CURVE INVERSION RESULTED FROM RISING COMMODITY PRICES ... My Wednesday morning message suggested that a sharp drop in the price of oil and other commodities argued for a more dovish tone from the Fed. That message also explained that previous Fed tightening cycles were usually done to combat...
READ MORE
MEMBERS ONLY

The Fed Unnerves Gold Market
by Martin Pring,
President, Pring Research
In my December Market Roundup webinar, I touched on the idea that the economy had begun to seriously slow down. Wednesday’s Fed action, actual and potential for next year, will amplify that process. The equity markets are obviously paying attention, but the increased probability of higher rates and a...
READ MORE
MEMBERS ONLY

THE FED CAN'T AFFORD TO MAKE A MISTAKE TODAY -- HIGHER SHORT-TERM RATES RISK AN INVERTED YIELD CURVE -- WHILE PLUNGING OIL PRICE SHOWS WEAKER INFLATION -- AND U.S. STOCKS ARE UNDERGOING A MAJOR TEST OF THEIR EARLY 2018 LOWS
by John Murphy,
Chief Technical Analyst, StockCharts.com
TODAY IS A BIG DAY FOR THE FED -- AND FOR THE MARKETS ... Today is one of the most important Fed days in recent memory. That's because there's a lot riding on what it does this afternoon; or doesn't do. It's widely...
READ MORE
MEMBERS ONLY

Catch A Falling Knife?
by Martin Pring,
President, Pring Research
* The Market Remains Oversold
* More Trend Damage Triggered
* Key Ratios Have Just Broken to New Lows
As a kid, I used to love building sand castles and defending them against the ensuing wave action. If the tide was coming in, however, it always proved to be a fool’s errand...
READ MORE
MEMBERS ONLY

LONGER-RANGE INDICATORS REMAIN BEARISH FOR U.S. STOCKS -- RETEST OF EARLY 2018 LOWS SHOULD DETERMINE IF STOCKS ARE IN A BEAR MARKET -- STOCKS OFF TO BAD DECEMBER START -- FAILURE OF SANTA CLAUS RALLY TO SHOW WOULD BE A BAD SIGN FOR THE NEW YEAR
by John Murphy,
Chief Technical Analyst, StockCharts.com
WEEKLY S&P 500 CHART CONTINUES TO LOOK TOPPY... There's a reason why every short-term rally attempt over the past couple of months has failed. That's because longer-range indicators have turned bearish and remain so. It's more difficult for bounces on daily charts...
READ MORE
MEMBERS ONLY

HEAVY SELLING PUSHES U.S. STOCK INDEXES NEAR DECEMBER LOWS -- EARLY 2018 LOWS ARE NEXT -- RUSSELL 2000 SMALL CAP INDEX AND THE DOW TRANSPORTS FALL TO 52-WEEK LOWS -- SO DOES THE S&P RETAIL SPDR -- THAT'S A BAD SIGN FOR THE STOCK MARKET AND THE ECONOMY
by John Murphy,
Chief Technical Analyst, StockCharts.com
HEADING BACK TO EARLY 2018 LOWS... After a unimpressive bounce this week, stock prices are ending week under heavy selling pressure. The first three charts show the Dow Industrials, the S&P 500, and the Nasdaq Composite nearing new lows for the month of December, which puts them on...
READ MORE
MEMBERS ONLY

STOCKS ARE GOING BACK ON THE DEFENSIVE
by John Murphy,
Chief Technical Analyst, StockCharts.com
SHORT-TERM BOUNCE HAS RUN ITS COURSE ... This week's modest rebound in stocks has been unimpressive and appears to have run its course. Lack of upside volume and weak breadth also show that investors have stayed on the sidelines, or have sold into this week's rebound. Sector...
READ MORE
MEMBERS ONLY

MONDAY'S UPSIDE REVERSAL DAY MAY HAVE SIGNALLED SHORT-TERM BOTTOM -- THAT COULD LEAD TO DECEMBER REBOUND TO OVERHEAD RESISTANCE -- A STUDY OF SMALLER OR EQUAL WEIGHTED INDEXES SUGGESTS A RETEST OF EARLY 2018 LOWS MAY HAVE ALREADY TAKEN PLACE
by John Murphy,
Chief Technical Analyst, StockCharts.com
S&P 500 MAY BE FORMING SHORT-TERM BOTTOM... My message from last Friday suggested that the S&P 500 was likely to drop below its October low, which could lead to a retest of its early 2018 lows (more on that last point shortly). Chart 1 shows Monday&...
READ MORE
MEMBERS ONLY
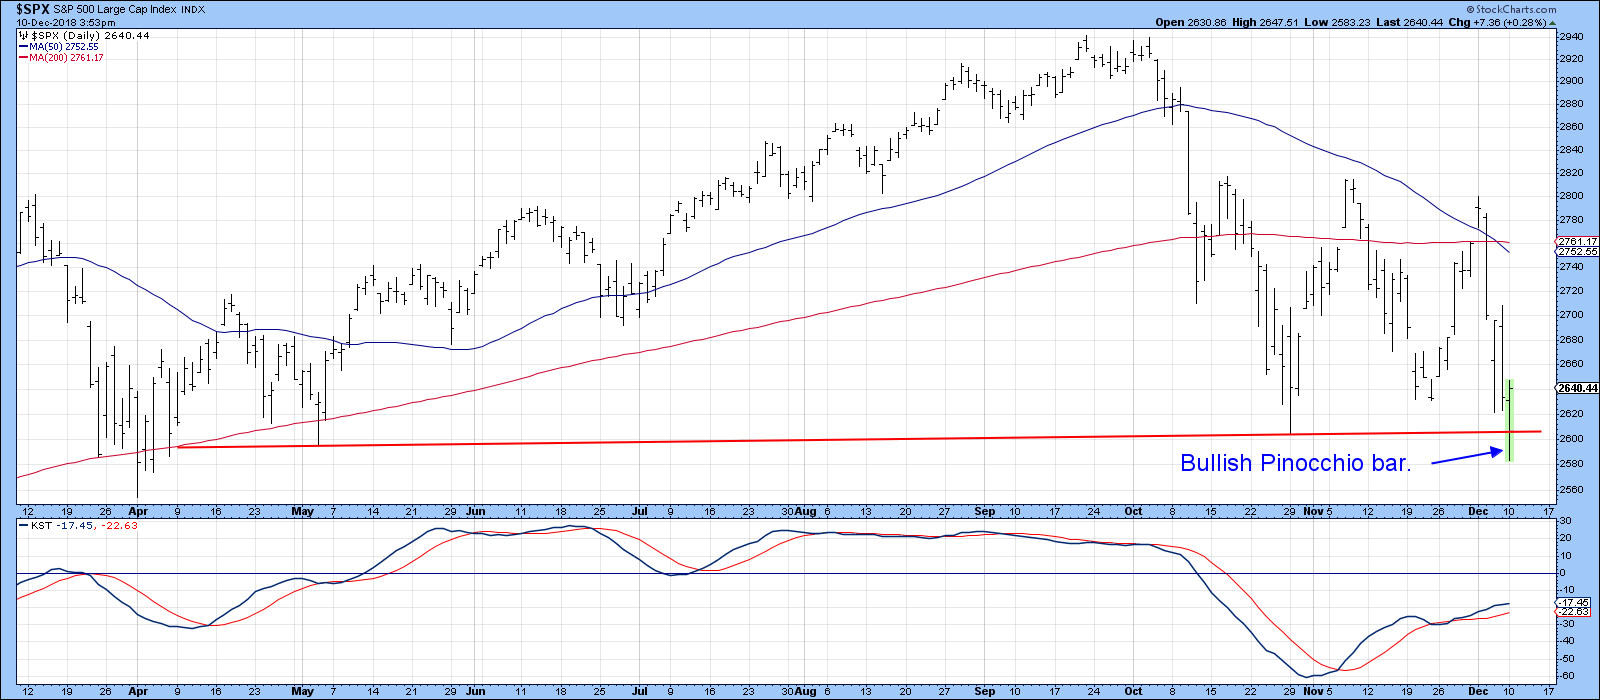
Year-End Rally Here We Come?
by Martin Pring,
President, Pring Research
* Pinocchio Lies
* Oversold Sentiment Indicators
* Oversold Oscillators
Pinocchio Lies
Monday’s action was what I call “scary bullish.” First, we saw prices sell-off sharply, only to then rebound as if nothing had happened. Well, something did happen - the formation of a bullish Pinocchio bar on several Indexes. Chart 1...
READ MORE
MEMBERS ONLY

OIL JUMPS ON OPEC CUTS -- THAT'S GIVING ENERGY SECTOR A BOOST -- FALLING OIL HAS WEIGHED ON BOND YIELDS -- WEAK ENERGY PATCH AND FALLING STOCK PRICES HAVE ALSO WEAKENED HIGH-YIELD BONDS -- S&P 500 APPEARS TO BE TRIANGULATING WHICH FAVORS LOWER PRICES
by John Murphy,
Chief Technical Analyst, StockCharts.com
LARGER THAN EXPECTED OPEC CUTS BOOST CRUDE OIL ... OPEC and Russia finally agreed to a larger-than-expected production cut of 1.2 million barrels a day of crude oil which is lifting the price of that commodity today. It remains to be seen, however, if that's enough to reverse...
READ MORE
MEMBERS ONLY
REVIEWING THE PHILOSOPHY OF TECHNICAL ANALYSIS -- CHARTS ACT AS LEADING INDICATORS OF FUNDAMENTAL INFORMATION -- THIS WEEK'S PLUNGE IN BOND YIELDS SUGGESTS ECONOMY WEAKENING -- FALLING STOCKS TOLD US THE SAME THING A MONTH AGO
by John Murphy,
Chief Technical Analyst, StockCharts.com
WHY WE LOOK AT CHARTS ... I've written several messages since the start of October about why the sharp stock market drop that month was most likely the start of a major topping process. Previous messages used Elliott Waves, the unusually old age of the current bull market (and...
READ MORE
MEMBERS ONLY

PLUNGING BOND YIELDS SEND SIGNAL OF ECONOMIC WEAKNESS -- S&P 500 FALLS BELOW 200-DAY AVERAGE AFTER FAILING TEST OF NOVEMBER HIGH -- BIGGEST LOSERS ARE BANKS, SMALL CAPS, SEMIS, AND TRANSPORTS -- UTILITIES HIT NEW HIGHS AND ARE THE ONLY WINNERS
by John Murphy,
Chief Technical Analyst, StockCharts.com
TEN-YEAR TREASURY YIELD PLUNGES BELOW ITS 200-DAY AVERAGE ... Chart 1 shows the 10-Year Treasury yield plunging to the lowest level in three months and falling below its 200-day average for the first time in more than a year. That means that investors are putting a lot of money into Treasury...
READ MORE
MEMBERS ONLY

A Funny Thing May Have Happened To The Secular Reversal In Rates
by Martin Pring,
President, Pring Research
* The Secular Bear Market in Yields
* Near-Term Indications of a Decline in Bond Yields
* Watch That Stock/Bond Relationship for an Important Signal
The Secular Bear Market in Yields
Please note that the comments in this article relate to bond yields with maturities of 3-years or longer. They do not...
READ MORE
MEMBERS ONLY
December 2018 Market Roundup with Martin Pring
by Martin Pring,
President, Pring Research
The Market Roundup Video For December is now available.
Good luck and good charting,
Martin J. Pring
The views expressed in this article are those of the author and do not necessarily reflect the position or opinion ofPring Turner Capital Groupof Walnut Creek or its affiliates....
READ MORE
MEMBERS ONLY

DAILY BOLLINGER BANDS SHOW SHORT-TERM STOCK TREND IMPROVING AND A POSSIBLE RETEST OF NOVEMBER HIGH -- WEEKLY AND MONTHLY BANDS ALSO SHOW SUPPORT -- BOLLINGER BAND WIDTH, HOWEVER, SHOWS THAT VOLATILITY REMAINS ELEVATED
by John Murphy,
Chief Technical Analyst, StockCharts.com
SHORT-TERM TREND IS IMPROVING ... There are lots of ways to determine the trend of the stock market. The placement of moving average lines is one of them. Bollinger bands (invented by John Bollinger) are another. Chart 1 applies both techniques to a daily chart of the S&P 500....
READ MORE
MEMBERS ONLY

STOCKS REBOUND ON DOVISH FED SPEECH -- RISKIER STOCKS LEAD WHILE SAFE HAVENS LAG -- DOW REGAINS 200-DAY LINE -- LOWER BOND YIELDS WEAKEN THE DOLLAR WHICH BOOSTS GOLD AND EMERGING MARKETS
by John Murphy,
Chief Technical Analyst, StockCharts.com
DOW REGAINS 200-DAY AVERAGE ... U.S. stock indexes reacted positively to today's noon speech by Fed chief Jerome Powell that was perceived to be more dovish than comments made at the start of October. Stocks all over the world are rallying as a result. Chart 1 shows the...
READ MORE
MEMBERS ONLY

The Trend Of Housing And NYSE Margin Debt Both Reverse To The Downside
by Martin Pring,
President, Pring Research
* Housing Starts are Rolling Over
* The Trend of Margin Debt is Bearish
The NYSE Margin and the housing sector do not have much in common beyond the fact that both gave sell signals in October. Neither development bodes well for the recovery of the stock market. Let’s take a...
READ MORE
MEMBERS ONLY

STOCKS BOUNCE OFF LATE OCTOBER LOW -- THIS WOULD BE A LOGICAL SPOT FOR A SEASONAL RALLY ATTEMPT -- HOW FAR IT CARRIES WILL BE VERY IMPORTANT -- NASDAQ 100 QQQ IS ALSO OVERSOLD ON ITS DAILY CHART -- ITS WEEKLY CHART, HOWEVER, SHOWS LONGER RANGE DAMAGE
by John Murphy,
Chief Technical Analyst, StockCharts.com
S&P 500 REBOUNDS OFF LATE OCTOBER LOW... Stocks are off to a good start to the post Thanksgiving trading week. And they have at least three things working in their favor. One is the proximity to their late October low. The other is a short-term oversold condition. The...
READ MORE
MEMBERS ONLY

AN EVENTUAL RETEST OF FIRST HALF LOWS STILL LOOKS LIKELY -- IN ORDER TO PREVENT THAT, OCTOBER LOWS HAVE TO HOLD -- FOR THAT TO HAPPEN, SOME SHORT-TERM CHART BARRIERS NEED TO BE OVERCOME --
by John Murphy,
Chief Technical Analyst, StockCharts.com
S&P 500 IS RETESTING ITS OCTOBER LOW ... Since the nearly nearly three year uptrend that started in stocks in early 2016 appears to have peaked, an eventual retest of early 2018 lows appears likely. That would mean an eventual retest of February/April lows on the S&...
READ MORE
MEMBERS ONLY

Confidence Is Eroding Just When It's Needed
by Martin Pring,
President, Pring Research
* Indexes on the Brink
* Confidence Relationships Starting to Break Down
* Watch the Stock/Bond Ratio
Indexes on the Brink
More than once a week, I make sure to check several ratios that tell me whether investors and traders are getting more or less confident. These relationships, which we will get...
READ MORE
MEMBERS ONLY

HEADLINE FROM OCTOBER 13: WEEKLY AND MONTHLY CHARTS ARE SENDING MORE SERIOUS WARNING SIGNS -- ELLIOTT WAVE ANALYSIS ALSO SUGGESTS THAT THE MARKET MAY HAVE COMPLETED ITS NINE-YEAR RUN
by John Murphy,
Chief Technical Analyst, StockCharts.com
CORRECTION: ... My message from last Wednesday showed negative readings on weekly and monthly stock charts, and referred back to an earlier message on that same topic. However, I incorrectly gave a date of May 13. The correct date of that earlier article is October 13, 2018. I also mentioned that...
READ MORE
MEMBERS ONLY

STOCK INDEXES STABILIZE BUT LOSE MORE GROUND -- DROP IN RETAILERS AND HOME IMPROVEMENT STOCKS MAKE CONSUMER CYCLICALS MARKET'S WEAKEST SECTOR -- WALMART, MACY'S AND HOME DEPOT FALL ON STRONG EARNINGS -- CONSUMER STAPLES CONTINUE TO OUTPERFORM
by John Murphy,
Chief Technical Analyst, StockCharts.com
DESPITE LATE REBOUND, STOCK INDEXES LOSE GROUND... Despite a rebound on Thursday and Friday, all major U.S. stock indexes lost ground this week. But very little changed on their respective chart patterns. Chart 1 shows an upside reversal on Thursday keeping the Dow Industrials above its 200-day average. But...
READ MORE
MEMBERS ONLY

STOCKS CONTINUE THEIR NOVEMBER SLIDE -- THE S&P 500 MAY RETEST ITS LATE OCTOBER LOW -- THE REASON SHORT-TERM RALLIES ARE FAILING IS BECAUSE WEEKLY CHARTS LOOK EVEN MORE NEGATIVE -- THE S&P 500 MONTHLY CHART ALSO SHOWS SIGNS OF WEAKENING
by John Murphy,
Chief Technical Analyst, StockCharts.com
SHORT-TERM STOCK TREND CONTINUES TO WEAKEN ... Today's higher open is giving way to more afternoon selling. We've seen that same pattern over the past week as stock prices have started to slide again. The daily bars in Chart 1 show the S&P 500 Index...
READ MORE
MEMBERS ONLY

Has Oil Hit A Temporary Bottom?
by Martin Pring,
President, Pring Research
* Commodities in General Remain in a Bear Market
* Oil is Also in a Primary Bear Market
* The Chart That Says That Some Kind of Bottom is at Hand
I last wrote about oil back in early August, in an article entitled More Evidence Of A Commodity Bear Market. Back then,...
READ MORE
MEMBERS ONLY

TECH STOCKS CONTINUE TO LEAD MARKET LOWER -- TECHNOLOGY SPDR SLIPS FURTHER BELOW ITS 200-DAY AVERAGE -- APPLE DROPS TOWARD ITS 200-DAY LINE AS MICROSOFT WEAKENS -- BROADCOM AND INTEL LEAD CHIP STOCKS SHARPLY LOWER -- S&P 500 IS BACK BELOW ITS 200-DAY LINE
by John Murphy,
Chief Technical Analyst, StockCharts.com
TECHNOLOGY SPDR FALLS FURTHER BELOW ITS 200-DAY AVERAGE ... Technology stocks continue to lead the stock market lower today. The Technology Sector SPDR (XLK) fell back below its 200-day average on Friday, and is falling further below it today (Chart 1). To get an idea of how much the techs have...
READ MORE
MEMBERS ONLY

ENERGY STOCKS FOLLOW CRUDE OIL LOWER -- RISING DOLLAR IS PUSHING COMMODITY PRICES LOWER -- DEFENSIVE SECTORS ARE STILL IN THE LEAD -- CYCLICALS RUN INTO RESISTANCE WHILE TECHOLOLOGY SECTOR WEAKENS
by John Murphy,
Chief Technical Analyst, StockCharts.com
CRUDE OIL ENTERS BEAR MARKET... Commodities as a group have been under a lot of selling pressure for several months. But the weakest part of that group over the past month has been energy. Chart 1 shows the price of WTIC Light Crude Oil (through yesterday) falling to the lowest...
READ MORE
MEMBERS ONLY

Several Indicators Point To A Test Of The October Lows
by Martin Pring,
President, Pring Research
* Indexes Reach Resistance and Retrace 61.8% of the Decline
* Hourly Charts Offer the First Domino
* Short-Term Breadth is Overstretched
* NASDAQ Sports a Series of Declining Peaks and Troughs
Indexes Reach Resistance and Retrace 61.8% of the Decline
The market has been on a tear for the last couple...
READ MORE
MEMBERS ONLY

THE DOW LEADS NOVEMBER REBOUND -- THE S&P 500 IS BACK ABOVE ITS 200-DAY LINE -- SO ARE THE QQQ AND XLK -- HEALTH CARE PROVIDERS LEAD THE XLV -- SO ARE ABBOTT LABS, JOHNSON & JOHNSON, AND MERCK
by John Murphy,
Chief Technical Analyst, StockCharts.com
THE DOW LEADS STOCK UPTURN ... Major stock indexes are building on their November gains on the day after the midterm elections. The Dow is leading on the upside. Chart 1 shows the Dow Industrials already trading above chart resistance at 25,800 and trying to clear its 50-day average. Chart...
READ MORE
MEMBERS ONLY

Last Chance For Gold To Rally?
by Martin Pring,
President, Pring Research
* The Long-Term Picture
* Price Action Characteristics are Bearish
* Gold Share Breadth is Negative
* The Now or Never Chart
The Long-Term Picture
Gold was in a secular bull market between 2001 and 2011. It then sold off into 2014 and has been essentially range bound ever since. Chart 1 shows that...
READ MORE
MEMBERS ONLY
November 2018 Market Roundup with Martin Pring
by Martin Pring,
President, Pring Research
The Market Roundup Video For November is now available.
Good luck and good charting,
Martin J. Pring
The views expressed in this article are those of the author and do not necessarily reflect the position or opinion ofPring Turner Capital Groupof Walnut Creek or its affiliates....
READ MORE
MEMBERS ONLY

BIG DROP IN APPLE HURTS TECH SECTOR AND THE NASDAQ WHICH ARE LEADING TODAY'S STOCK RETREAT -- BOTH MAY BE FAILING TESTS OF THEIR 200-DAY AVERAGES -- THE S&P 500 IS ALSO STALLING AT MOVING AVERAGE LINES -- HOURLY BARS SHOW OVERHEAD RESISTANCE BARRIERS
by John Murphy,
Chief Technical Analyst, StockCharts.com
APPLE FALLS ON GOOD NEWS ... It's usually not a good sign when the market's biggest stock takes a big hit. That's especially true when it happens the day after the company reported its fourth consecutive quarter of record revenue and profits. But that'...
READ MORE
MEMBERS ONLY

Comparing The Differences Between The February And October Declines
by Martin Pring,
President, Pring Research
* Key moving averages violated in October
* The world peaked in January
* What happened to sectors and breadth?
* February versus October conclusion
* Those pesky bonds
Key Moving Averages Violated in October
So far, 2018 has seen two sharp shakeouts in the market, specifically the ten-day special in early February and the...
READ MORE