MEMBERS ONLY

SHORT-TERM STOCK BOTTOM APPEARS TO BE IN PLACE -- SMALL AND MIDCAP INDEXES BOUNCE OFF FEBRUARY LOWS -- S&P 500 BOUNCES OFF SUPPORT -- AND MAY BE HEADING FOR A RETEST OF ITS 200-DAY AVERAGE

by John Murphy,
Chief Technical Analyst, StockCharts.com
SMALL AND MIDCAP STOCKS INDEXES BOUNCE OFF FEBRUARY LOWS... A lot of technical signs point to a short-term bottom in place for stocks. That suggests that major stock indexes will try to regain some of their October losses. The big question is how much of those losses. Before getting to...
READ MORE
MEMBERS ONLY
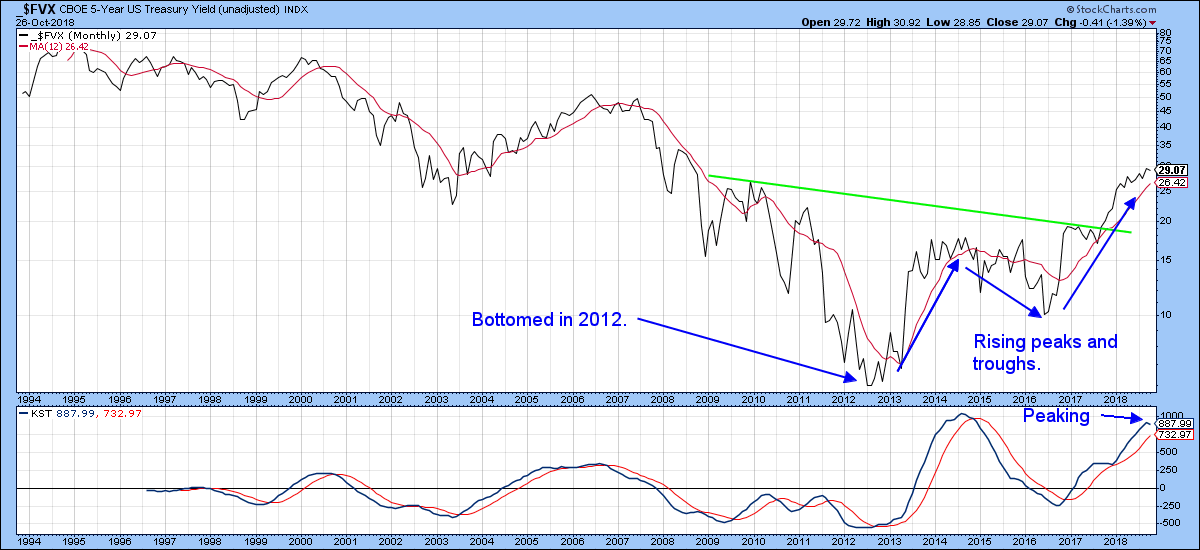
Tentative Signs That Bond Yields May Be Peaking

by Martin Pring,
President, Pring Research
* A few observations about the secular trend
* Short-term technical position
* Junk bonds peak out
* Credit spreads argue for lower government yields
A Few Observations About the Secular Trend
The 5-year yield, shown in Chart 1, has formed and broken out from a major base. It touched a low point in...
READ MORE
MEMBERS ONLY

S&P 500 APPEARS HEADED FOR TEST OF ITS EARLY 2018 LOWS -- THE BREAKING OF ITS THIRTY-MONTH SUPPORT LINE IS ANOTHER NEGATIVE SIGN -- THE LAST TWO MARKET PEAKS STARTED IN OCTOBER -- A PLUNGE IN ASSET MANAGERS MAY BE ANOTHER SIGN OF MARKET WEAKNESS
by John Murphy,
Chief Technical Analyst, StockCharts.com
S&P 500 HEADED FOR A RETEST OF EARLY 2018 LOWS ... I keep hearing on CNBC that stocks are down sharply but "off their lows". They never seem to mention that they're even further "off their highs". After losing nearly 4% over the...
READ MORE
MEMBERS ONLY

FOREIGN STOCKS ARE LEADING U.S. STOCKS LOWER -- EUROPE AND ASIA ARE ALREADY IN DOWNTRENDS -- THE ALL COUNTRY WORLD INDEX IS FALLING TO THE LOWEST LEVEL IN A YEAR -- THAT SUGGESTS THAT GLOBAL STOCKS ARE PEAKING -- THAT INCLUDES THE U.S.
by John Murphy,
Chief Technical Analyst, StockCharts.com
FOREIGN STOCKS ARE LEADING THE U.S. LOWER... U.S. stocks are under pressure for a lot of reasons that have been described in previous messages. There's been the rotation over the last month out of economically-sensitive stock groups like cyclicals, industrials, energy, materials, and technology into defensive...
READ MORE
MEMBERS ONLY

S&P 500 RETESTS 200-DAY MOVING AVERAGE AND TWO-YEAR SUPPORT LINE -- VOLUME PATTERN HASN'T BEEN ENCOURAGING -- SMALL CAPS CONTINUE TO DROP FASTER THAN LARGE CAPS -- A RATIO OF SMALL CAPS VERSUS LARGE CAPS IS NOW TESTING MAJOR SUPPORT
by John Murphy,
Chief Technical Analyst, StockCharts.com
S&P 500 CONTINUES TO TEST MAJOR SUPPORT LINES... After a rebound attempt on Tuesday, stocks ended the week pretty much where they started, but on the defensive. The daily bars in Chart 1 show the S&P 500 Large Cap Index closing Friday right on its 200-day...
READ MORE
MEMBERS ONLY

THE THREE DOW AVERAGES ARE GIVING BEARISH MESSAGES -- THE DOW TRANSPORTS ARE FALLING THE FASTEST -- WHILE THE UTILITIES ARE DOW LEADERS -- TRANSPORTATION/UTILITIES RATIO FALLS TO LOWEST LEVEL OF THE YEAR
by John Murphy,
Chief Technical Analyst, StockCharts.com
THE DOW RETESTS 200-DAY LINE... My last two messages spelled out a lot of technical reasons that are bearish for the stock market, and increase the odds that the nine-year bull run is ending. Besides the heavy selling that's taken place during October, my weekend message showed a...
READ MORE
MEMBERS ONLY
Four Areas To Watch For A Possible Bear Market Trigger
by Martin Pring,
President, Pring Research
* Internet bubble
* Credit spreads
* Rising interest rates
* Contagion from abroad
On Wednesday, I joined Tom and Erin on MarketWatchers LIVE and enjoyed a spirited discussion on what signs might foreshadow an extension to last week’s decline, or even signal a bear market. The four areas I cited were the...
READ MORE
MEMBERS ONLY

HEALTHCARE HAS BECOME THE YEAR' STRONGEST SECTOR -- AND IS BEING LED HIGHER BY DRUG STOCKS -- JOHNSON & JOHNSON IS THE DAY'S DRUG LEADER -- LILLY, MERCK, AND PFIZER NEAR NEW RECORDS
by John Murphy,
Chief Technical Analyst, StockCharts.com
DEFENSIVE HEALTHCARE SECTOR CONTINUES TO LEAD ... Healthcare has emerged as the market's strongest sector. Not only has healthcare been the market's strongest sector over the last month, the last three months, and the last six months. It's now the top performer for the year....
READ MORE
MEMBERS ONLY

FRIDAY'S REBOUND PREVENTS FURTHER STOCK DAMAGE -- BUT WEEKLY AND MONTHLY CHARTS ARE SENDING MORE SERIOUS WARNING SIGNS -- ELLIOTT WAVE ANALYSIS ALSO SUGGESTS THAT THE MARKET MAY HAVE COMPLETED ITS NINE-YEAR RUN -- BULL MARKETS MAY NOT DIE OF OLD AGE
by John Murphy,
Chief Technical Analyst, StockCharts.com
S&P 500 HOLDS 200-DAY AVERAGE ... A stock rebound on Friday prevented a more serious market breakdown. That's because it allowed the S&P 500, and some other market gauges, to hold at or above their 200-day moving averages (Chart 1). That included the Dow and...
READ MORE
MEMBERS ONLY

GROWTH AND VALUE STOCKS ARE BOTH WEAKENING -- CONSUMER DISCRETIONARY AND TECH SPDRS HAVE FALLEN TO THEIR 200-DAY AVERAGES TO LEAD MARKET LOWER -- FINANCIALS HAVE ALSO LOST GROUND -- BANK INDEX FALLS TO NEW 2018 LOW
by John Murphy,
Chief Technical Analyst, StockCharts.com
GROWTH AND VALUE STOCKS ARE BOTH FALLING... One of the explanations for this week's big selloff is that the upside breakout in bond yields is hurting growth stocks. That's been especially true of consumer discretionary and technology stocks which suffered the biggest losses this month. Chart...
READ MORE
MEMBERS ONLY

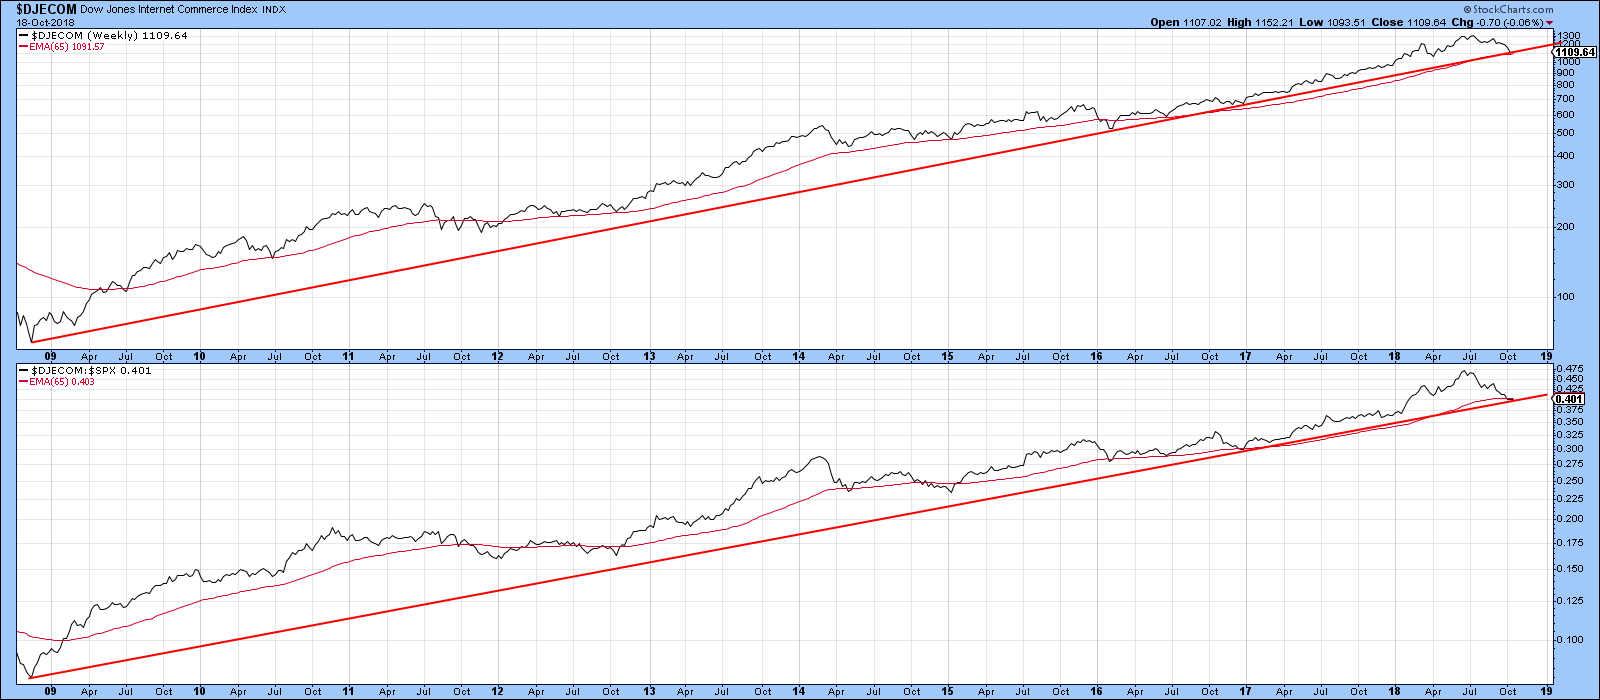
Global And US Equities Violate Major Up Trendlines: More Downside To Come
by Martin Pring,
President, Pring Research
* The big global picture
* US equities are violating key trend lines
* Financials experience false upside breakout
* Energy triggers a false positive
* Bubble-prone e-commerce on the verge of being pricked!
Last week, I wrote about the possibility of an October “surprise.” I pointed out that such an event is completely random...
READ MORE
MEMBERS ONLY

NASDAQ CONTINUES TO LEAD MARKET LOWER -- ALONG WITH WEAK TECHNOLOGY STOCKS -- SEMICONDUCTOR ISHARES FALL TO LOWEST LEVEL IN SIX MONTHS -- SMALL AND MIDCAP INDEXES SLIP BELOW 200-DAY AVERAGES -- S&P 500 FALLS BELOW 50-DAY AVERAGE
by John Murphy,
Chief Technical Analyst, StockCharts.com
THE NASDAQ 100 (QQQ) LEADS MARKET LOWER... Stock indexes are all under selling pressure again this morning. As has been the case of late, the technology-dominated Nasdaq market has been leading the rest of the market lower. Chart 1 shows the Invesco Nasdaq 100 QQQ Trust falling to the lowest...
READ MORE
MEMBERS ONLY

New Evidence Suggests A Change In Market Leadership Is Underway
by Martin Pring,
President, Pring Research
* The US market viewed from abroad
* Resource based sectors in general are under-performing
* Defensive sectors are generally improving
* Ratio between a late and early performing sector is at a critical juncture
Back in August I wrote an article pointing out that we might be in the early stages of a...
READ MORE
MEMBERS ONLY

HIGHER BOND YIELDS WEIGH ON STOCK PRICES -- CONSUMER CYCLICALS AND TECHNOLOGY CONTINUE TO LEAD THE MARKET LOWER -- THE QQQ FALLS BELOW ITS 50-DAY AVERAGE -- WHILE THE SOXX BREAKS ITS 200-DAY LINE
by John Murphy,
Chief Technical Analyst, StockCharts.com
A LOT OF MOVING AVERAGE LINES ARE BEING BROKEN... Stocks continue the retreat that began after bond yields reached multiyear highs at midweek. Bond yields are hitting new highs again today. As was the case yesterday, consumer cyclicals and technology are the two worst sector performers. Chart 1 shows the...
READ MORE
MEMBERS ONLY

What Are The Odds Of An October Surprise?
by Martin Pring,
President, Pring Research
* Conditions that feed a crash
* Rising rates
* Emerging markets could be the triggering mechanism
* Market breadth not so hot
* Is the e-commerce bubble bursting?
Conditions that feed a crash
October started off as just a continuation of September’s dull price activity. However, knowing that the month of October has...
READ MORE
MEMBERS ONLY

RETAILERS CONTINUE TO WEIGH ON CYCLICALS -- CONSUMER DISCRETIONARY SPDR FALLS BELOWS 50-DAY AVERAGE -- HOMEBUILDERS ARE ALSO WEIGHING ON CYCLICALS -- HOME CONSTRUCTION ETF FALLS TO LOWEST LEVEL IN A YEAR -- RISING BOND YIELDS ARE A BIG REASON WHY
by John Murphy,
Chief Technical Analyst, StockCharts.com
RETAILERS CONTINUE TO WEAKEN... Tuesday's message showed retail stocks under selling pressure. That selling is continuing today. Chart 1 shows the S&P Retail SPDR (XRT) nearing a test of its July/August lows and maybe even its 200-day moving average (red line). The Tuesday message also...
READ MORE
MEMBERS ONLY

TEN-YEAR TREASURY YIELD BREAKS OUT TO HIGHEST LEVEL SINCE 2011 ON STRONG ECONOMIC NEWS -- STOCKS RALLY WITH YIELDS AS BOND PRICES FALL -- THAT'S GIVING A LIFT TO BANKS AND OTHER FINANCIALS
by John Murphy,
Chief Technical Analyst, StockCharts.com
TEN-YEAR TREASURY YIELD ACHIEVES MAJOR BULLISH BREAKOUT... Treasury yields have finally achieved the upside breakout that many of us have been warning about. And it's doing it in pretty decisive fashion. The daily bars in Chart 1 show the 10-Year Treasury yield surging above its May peak near...
READ MORE
MEMBERS ONLY

RETAIL STOCKS HAVE A BAD CHART DAY -- THAT'S STARTING TO WEIGH ON RELATIVE PERFORMANCE OF THE CONSUMER DISCRETIONARY SECTOR WHICH APPEARS TO BE LOSING UPSIDE MOMENTUM -- CYCLICAL STOCKS ARE ALSO LOSING GROUND VERSUS DEFENSIVE CONSUMER STAPLES
by John Murphy,
Chief Technical Analyst, StockCharts.com
RETAIL SPDR TUMBLES TO TWO-MONTH LOW... Retail stocks are having a bad chart day. The daily bars in Chart 1 show the S&P Retail SPDR (XRT) falling to the lowest level in two months, and trading below its 50-day average (blue line) by the widest margin since March....
READ MORE
MEMBERS ONLY

Evidence Of A Major Upside Dollar Breakout Is Growing
by Martin Pring,
President, Pring Research
* Dollar Index experiences a false downside breakout
* Euro encounters a false upside breakout
* Yen completes a bearish multi-year continuation formation
* Swiss franc completes a broadening wedge
Back in mid-September, I wrote an article where I pointed out that the Dollar was on a knife edge. This view was based on...
READ MORE
MEMBERS ONLY
October 2018 Market Roundup With Martin Pring
by Martin Pring,
President, Pring Research
The Market Roundup Video For October is now available.
Good luck and good charting,
Martin J. Pring
The views expressed in this article are those of the author and do not necessarily reflect the position or opinion ofPring Turner Capital Groupof Walnut Creek or its affiliates....
READ MORE
MEMBERS ONLY

CONSUMER CYCLICALS AND TECHNOLOGY ARE THE YEAR'S STRONGEST SECTORS -- BUT HEALTHCARE HAS BECOME THE NEW MARKET LEADER -- AND REMAINS MUCH CHEAPER THAN THE OTHER SECTOR LEADERS
by John Murphy,
Chief Technical Analyst, StockCharts.com
HEALTHCARE HAS BECOME NEW SECTOR LEADER... The three strongest sector leaders since the start of this year have been consumer cyclicals, technology, and healthcare (in that order). But those numbers don't reflect the fact that healthcare has become the strongest market sector over the past three and six...
READ MORE
MEMBERS ONLY
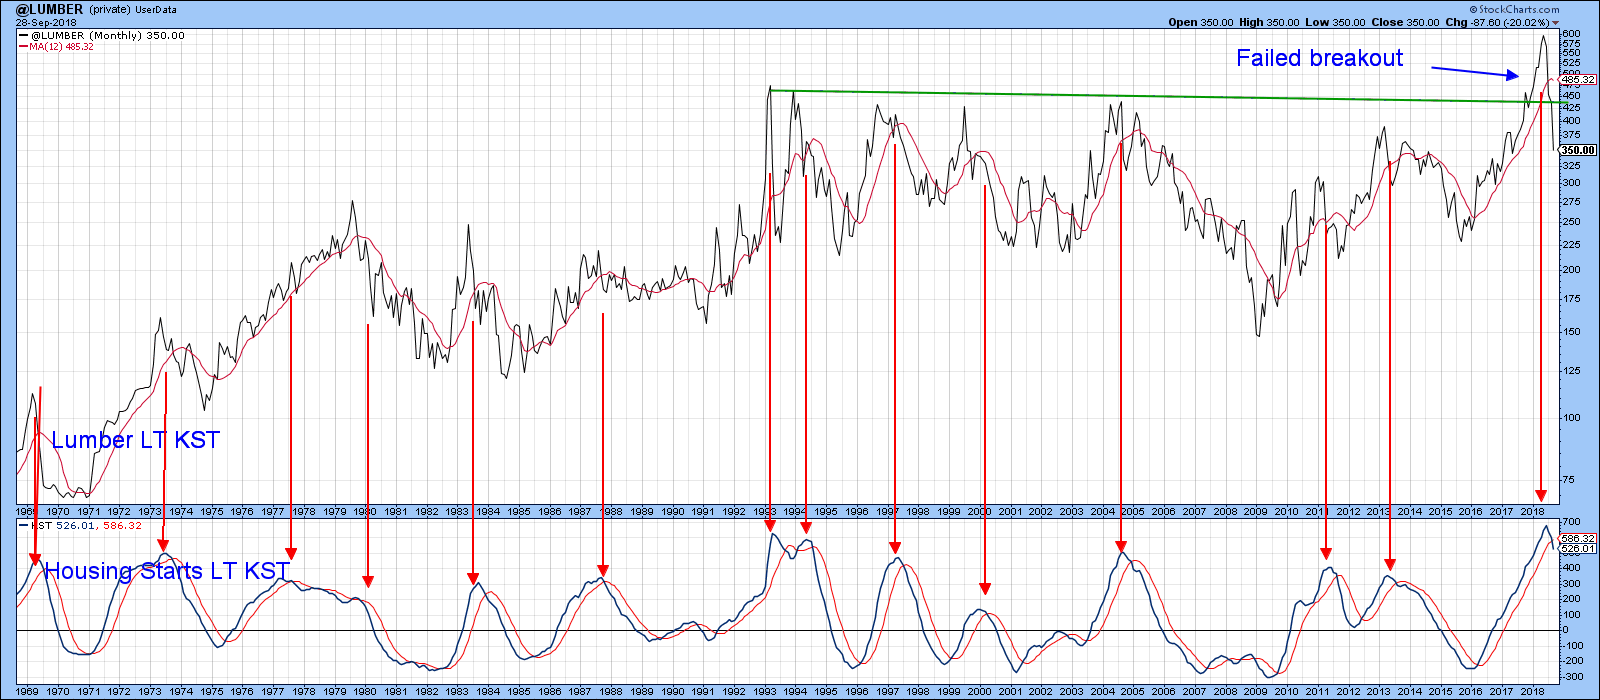
Recent Weak Lumber Prices Are Not A Good Sign For Housing Stocks
by Martin Pring,
President, Pring Research
* The connection between lumber and housing starts
* What the homebuilding ETF’s are saying
Nonfarm payrolls are an economic series that is widely followed by the investment community. However, it’s a coincident indicator, meaning it tells you what is going on now, not what might happen in the future....
READ MORE
MEMBERS ONLY

TEN-YEAR TREASURY IS TESTING ITS MAY HIGH -- A CLOSE ABOVE THAT LEVEL WOULD CONSTITUTE A MAJOR BULLISH BREAKOUT -- RISING TREASURY YIELDS ARE BEING SUPPORTED BY HIGHER FOREIGN YIELDS -- UK BOND YIELD HAS REACHED A TWO-YEAR HIGH
by John Murphy,
Chief Technical Analyst, StockCharts.com
TEN-YEAR TREASURY YIELD IS AT A CRUCIAL CHART POINT ... Treasury bond yields are going through an important test of overhead resistance. Chart 1 shows the 10-Year Treasury yield ($TNX) challenging its May 2018 intra high near 3.11%. After pulling back from its May high, the TNX entered a sideways...
READ MORE
MEMBERS ONLY

ENERGY PRICES RISE AS OPEC DOESN'T BOOST OUTPUT -- DB ENERGY FUND RISES TO THREE-YEAR HIGH -- ENERGY SECTOR SPDR RISES TO TWO-MONTH HIGH -- SO DOES THE S&P OIL & GAS EXPLORATION AND PRODUCTION SPDR -- MARATHON PETROLEUM HITS NEW RECORD
by John Murphy,
Chief Technical Analyst, StockCharts.com
INVESCO DB ENERGY FUND REACHES THREE-YEAR HIGH ... This past weekend's meeting between OPEC and Russia ended with no agreement to boost output to counter rising oil price. As a result, oil and other energy prices are rising sharply today. Chart 1 shows the Invesco DB Energy Fund (DBE)...
READ MORE
MEMBERS ONLY

WEEKLY RECAP SHOWS MATERIALS AND FINANCIALS LEADING MARKET HIGHER, WHILE TECHNOLOGY AND UTILITIES LAG BEHIND -- RECORD HIGH IN THE DOW MAY BE TIED TO EASING IN GLOBAL TENSIONS AND REBOUND IN FOREIGN CURRENCIES AND STOCKS
by John Murphy,
Chief Technical Analyst, StockCharts.com
MATERIALS AND FINANCIALS LEAD, TECHS AND UTES LAG: The Dow and S&P 500 hit new records this past week, while the Nasdaq lost some ground. A rebound in chemicals and copper stocks made materials the weekly leader. Financials benefited from a jump in bond yields. That also explains...
READ MORE
MEMBERS ONLY

UNITED STATES OIL FUND IS TESTING SUMMER HIGH -- WHILE ENERGY SPDR TESTS AUGUST HIGH -- ENERGY LEADERS INCLUDE CONOCOPHILLIPS, HESS, AND MARATHON OIL -- EXXON MOBIL AT EIGHT-MONTH HIGH
by John Murphy,
Chief Technical Analyst, StockCharts.com
UNITED STATES OIL FUND NEARS THREE-YEAR HIGH... The price of crude oil has reached a critical chart juncture. Chart 1 shows the United States Oil Fund (USO) in the process of testing its early July peak. A close through that barrier would put the USO at the highest level in...
READ MORE
MEMBERS ONLY

DOW AND S&P 500 HIT NEW RECORDS -- THE DOW IS THE LAST ONE TO CLEAR ITS JANUARY HIGH -- COMMODITY CHEMICALS HELP BOOST MATERIALS SPDR TO SIX MONTH HIGH -- SEMICONDUCTORS CONTINUE TO STABILIZE -- U.S. DOLLAR FALLS TO TWO-MONTH LOW
by John Murphy,
Chief Technical Analyst, StockCharts.com
THE DOW IS THE LAST TO CLEAR ITS JANUARY HIGH... Another day of rising stock prices has pushed the Dow and the S&P 500 to new records. In the case of the SPX (Chart 1), today's new high is enough to push it back above its...
READ MORE
MEMBERS ONLY

Dollar Index Is On A Knife Edge
by Martin Pring,
President, Pring Research
* Long-term dollar technical position
* Short-term picture bearish outcome
* Short-term picture bullish outcome
* Euro
* Yen
* Swiss franc
Long-term dollar technical position
I have been primary trend bullish on the dollar for several months. That opinion still stands because the Dollar Index is well above its 12-month MA and its long-term KST...
READ MORE
MEMBERS ONLY

FOUR-MONTH HIGH IN THE 10-YEAR TREASURY YIELD LIFTS FINANCIAL SPDR TO SIX-MONTH HIGH AND THE DAY'S STRONGEST SECTOR -- BUT MAKES UTILITIES THE DAY'S WEAKEST SECTOR
by John Murphy,
Chief Technical Analyst, StockCharts.com
RISING BOND YIELDS HELP FINANCIALS, BUT HURT UTILITIES... This morning's message suggested that this week's upside breakout in bond yields was helping financial stocks which were the day's strongest sector. The green bars on top of Chart 1 show the 10-Year Treasury yield surging...
READ MORE
MEMBERS ONLY

UPSIDE BREAKOUT IN BOND YIELDS IS BOOSTING FINANCIAL STOCKS -- CITIGROUP AND JP MORGAN NEAR UPSIDE BREAKOUTS -- INSURANCE ISHARES HIT SEVEN-MONTH HIGH TO LEAD XLF HIGHER -- PRUDENTIAL AND PRINCIPAL FINANCIAL GROUP ACHIEVE UPSIDE BREAKOUTS
by John Murphy,
Chief Technical Analyst, StockCharts.com
FINANCIALS GET A BOOST FROM RISING BOND YIELDS ... Yesterday's message showed the 10-Year Treasury yield rising to the highest level in four months. That probably explains why financials are leading the market higher today. Chart 1 shows the Financial Sector SPDR (XLF) bouncing sharply off its moving average...
READ MORE
MEMBERS ONLY

TEN-YEAR TREASURY YIELD EXCEEDS 3% -- 20-YEAR T-BOND ISHARES BREAK SUPPORT -- THE DOW NEARS ITS JANUARY HIGH -- BOEING AND CATERPILLAR CLEAR RESISTANCE -- QQQ HOLDS 50-DAY LINE -- SEMICONDUCTORS CONTINUE TO STABILIZE ABOVE 200-DAY AVERAGE
by John Murphy,
Chief Technical Analyst, StockCharts.com
TEN-YEAR TREASURY YIELD REACHES FOUR-MONTH HIGH ... Chart 1 shows the 10-Year Treasury Yield ($TNX) rising above its twin summer peaks near 3.00% and reaching the highest level in four months. That upside move breaks the TNX out of the three-month sideways pattern that it had been trading in; and...
READ MORE
MEMBERS ONLY

STOCKS LOSE SOME UPSIDE MOMENTUM --AMAZON AND MCDONALDS PULL CYCLICALS LOWER -- INDUSTRIALS CONTINUE TO RALLY -- LED BY FEDEX, HARRIS CORP, AND PACCAR -- TEN-YEAR YIELD TESTS 3% AGAIN
by John Murphy,
Chief Technical Analyst, StockCharts.com
SHORT-TERM SIGNS OF WEAKNESS ... The uptrend in U.S. stocks remains very much intact. However, upside momentum is weakening a bit. Chart 1, for example, shows the S&P 500 trading sideways over the past couple of weeks which is not unusual. The daily MACD lines (which are overlaid...
READ MORE
MEMBERS ONLY
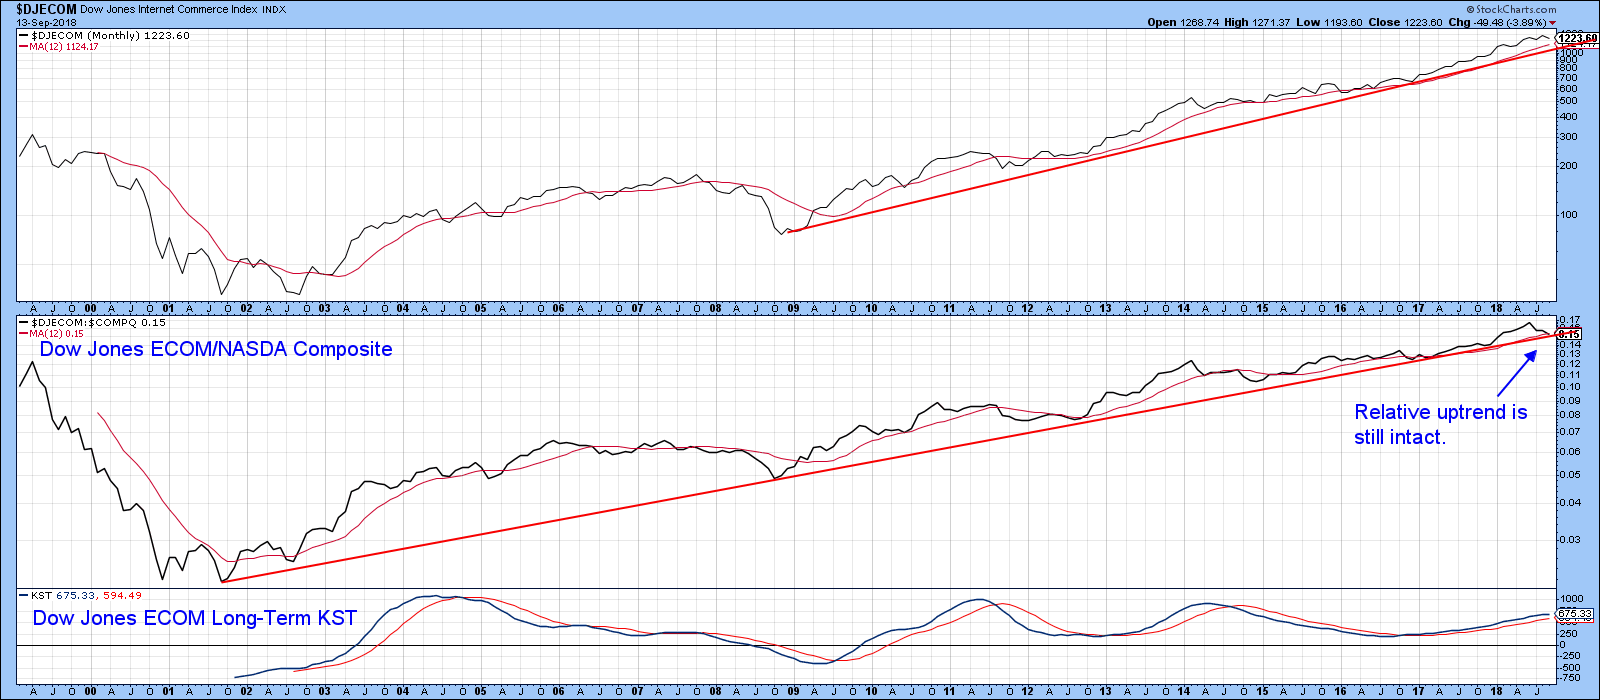
Is It A Bubble When ...
by Martin Pring,
President, Pring Research
* A few thoughts on bubbles
* Technical comments on the Dow Jones Internet Commerce Index
* China on the brink
A few thoughts on bubbles
Last week, I pointed out that most of the FAANG stocks remained in uptrends, with the possible exception of Netflix and the confirmed bear market in Facebook....
READ MORE
MEMBERS ONLY
Facebook Does An About Face, But What About The Other FAANG Stocks?
by Martin Pring,
President, Pring Research
* NASDAQ breadth data offers conflicting signals
* Bullish FAANG Stocks
* De-fanged stock
NASDAQ breadth data offering conflicting signals
We have seen some attention paid to tech stocks as they have corrected in the last week or so. The so called FAANG (Facebook, Apple, Amazon, Alphabet’s Google and Netflix) have been...
READ MORE
MEMBERS ONLY

CONSUMER DISRETIONARY SPDR IS YEAR'S STRONGEST SECTOR -- BUT IT MAY BE OVERSTATING SECTOR'S STRENGTH -- ITS EQUAL WEIGHTED ETF IS LAGGING THE XLY BY AN USUALLY WIDE GAP OF 11% -- OUTSIZED GAINS IN AMAZON AND NETFLIX MAY EXAGGERATING ITS 2018 PERFORMANCE
by John Murphy,
Chief Technical Analyst, StockCharts.com
CONSUMER DISCRETIONARY SPDR IS YEAR'S STRONGEST SECTOR ... Chart 1 shows the Consumer Discretionary SPDR (XLY) trading near a new record. Its 2018 gain of 18% makes it the year's strongest sector. That puts the XLY ahead of technology (16%) and healthcare (12%) for the year. In...
READ MORE
MEMBERS ONLY

TWITTER LEADS TECH STOCKS LOWER -- DEFENSIVE CONSUMER STAPLES, UTILITIES, AND REITS CONTINUE TO ATTRACT NEW MONEY -- NETFLIX WEIGHS ON CONSUMER DISCRETIONARY STOCKS -- AMAZON IS A QUARTER OF THE XLY AND MAY BE OVERSTATING THIS YEAR'S CYCLICAL LEADERSHIP
by John Murphy,
Chief Technical Analyst, StockCharts.com
OVERBOUGHT TECH SECTOR SEES SOME PROFIT-TAKING ... Chart 1 shows the Technology Sector SPDR (XLK) losing more than 1% today to lead the market lower. Its 9-day RSI line (top chart) had reached overbought territory above 70 suggesting that the XLK was due for a pullback. It's now testing...
READ MORE
MEMBERS ONLY
September 2018 Market Roundup With Martin Pring
by Martin Pring,
President, Pring Research
The MarketRoundup Video For September is now available.
Good luck and good charting,
Martin J. Pring
The views expressed in this article are those of the author and do not necessarily reflect the position or opinion ofPring Turner Capital Groupof Walnut Creek or its affiliates....
READ MORE
MEMBERS ONLY

US Stocks Take On Global Equities, Gold, Commodities And Bonds
by Martin Pring,
President, Pring Research
* US Equities versus the world
* Stocks versus Commodities
* Stocks and bonds
* Stocks compared to gold
There are lots of seasonal reasons to be bearish on the stock market, such as September being the weakest month and mid-term election years having a downward bias. However, if you compare the S&...
READ MORE
MEMBERS ONLY

U.S. STOCKS HAVE A STRONG AUGUST -- TECHNOLOGY, CONSUMER CYCLICALS, AND HEALTHCARE ARE SECTOR LEADERS -- U.S. STOCK UPTREND IS STRETCHED BUT STILL INTACT -- MEXICAN PESO STEADIES ON TRADE DEAL -- CANADIAN DOLLAR DROPS ON FRIDAY'S LACK OF AGREEMENT
by John Murphy,
Chief Technical Analyst, StockCharts.com
STOCKS HAVE A STRONG AUGUST ... U.S. stocks had a strong August with the Nasdaq, S&P 500, Russell 2000, and Dow Transports hitting record highs. Technology, Consumer Cyclicals, and Healthcare saw the biggest percentage gains and hit record highs. The three weakest sectors were Energy, Materials, and Industrials....
READ MORE
MEMBERS ONLY

LATE AUGUST REBOUND IN FOREIGN STOCKS HELPED PUSH U.S. STOCKS TO NEW RECORD -- AND CONTRIBUTED TO UPSIDE BREAKOUTS IN GLOBAL STOCK INDEXES -- THE DOW INDUSTRIALS ARE HEADED TOWARD THEIR JANUARY PEAK -- THE DOW TRANSPORTS HIT A NEW RECORD
by John Murphy,
Chief Technical Analyst, StockCharts.com
FOREIGN STOCK ETFS ARE FINALLY BOUNCING ... Before leaving on vacation on August 15, I expressed concern about the fact that foreign stock ETFs were lagging too far behind the U.S. which could threaten the uptrend in the S&P 500 which was nearing a test of its January...
READ MORE