MEMBERS ONLY

BOND YIELDS ARE STARTING TO WEAKEN FROM OVERBOUGHT CONDITION -- THAT'S GIVING A BOOST TO BOND PROXIES LIKE UTILITIES, REITS, AND TELECOM -- HIGH YIELD BONDS ARE BOUNCING BACK WHICH IS GOOD FOR STOCKS

by John Murphy,
Chief Technical Analyst, StockCharts.com
TEN-YEAR BOND YIELD IS WEAKENING ... The uptrend in bond yields is starting to weaken. The daily bar in Chart 1 show the 10-Year Treasury yield falling 5 basis points to 2.87%. More importantly, its 14-day RSI line overlaid over the price bars is falling to the lowest level since...
READ MORE
MEMBERS ONLY

Emerging From The Correction The Best And Worst Looking Sectors

by Martin Pring,
President, Pring Research
* General market thoughts
* Sectors under pressure
* Stronger looking sectors
General market thoughts
My thoughts on the recent correction is that we have likely seen the low, that more ranging action is likely, probably involving a test of that low, but that eventually US equities will see new bull market highs....
READ MORE
MEMBERS ONLY

STRONG TECH SECTOR CONTINUES TO SUPPORT MARKET -- FINANCIALS, CYCLICALS, AND INDUSTRIALS ARE ALSO LEADING -- SMALLS CAPS LOOK STRONGER -- AMERICAN AIRLINES AND KANSAS CITY SOUTHERN LEAD TRANPORTS HIGHER
by John Murphy,
Chief Technical Analyst, StockCharts.com
TECHNOLOGY SECTOR CONTINUES TO SUPPORT MARKET ... My last sentence from yesterday's message was that the stock market was unlikely to suffer any serious short-term damage as long as technology stocks kept rising. That's because technology is such a big part of the stock market. And they&...
READ MORE
MEMBERS ONLY

SEMICONDUCTORS LEAD THE NASDAQ AND TECHNOLOGY SECTOR HIGHER TODAY -- CHIP LEADERS INCLUDE APPLIED MATERIALS, KLA-TENCOR, AND LAM RESEARCH -- MOST OTHER SECTORS ARE IN THE RED -- DOW AND S&P 500 ARE STRUGGLING AT MOVING AVERAGE LINES
by John Murphy,
Chief Technical Analyst, StockCharts.com
SEMICONDUCTOR ISHARES HAVE A STRONG DAY... Semiconductor stocks are the strongest part of the market today. Chart 1 shows the PHLX Semiconductor iShares (SOXX) trading more than 2% higher today and moving further above its 50-day moving average. The SOXX has also risen above its 20-day moving average (green line)...
READ MORE
MEMBERS ONLY
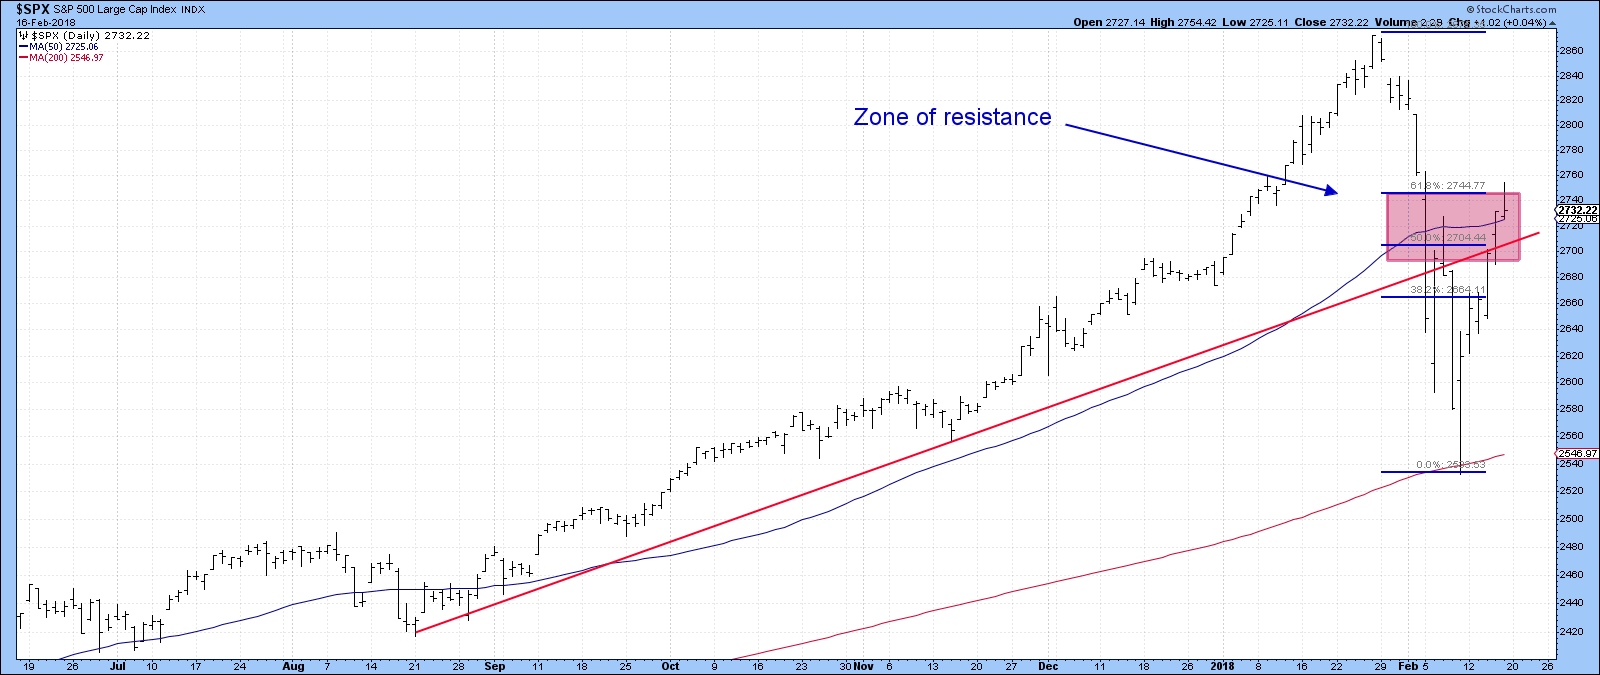
Some Equity Markets Showing Signs Of Long-term Vulnerability
by Martin Pring,
President, Pring Research
* Pinocchio argues for a test of the lows
* European equities are facing a big challenge
* Shanghai starting to look sick
Pinocchio argues for a test of the lows
Last week I suggested that the S&P had reached a resistance zone following its bounce from the early February panic...
READ MORE
MEMBERS ONLY

RECENT PULLBACK IN COMMODITIES IS LIKELY TIED TO STOCK CORRECTION -- COPPER AND OIL ARE STILL IN UPTRENDS -- AND GOLD MAY BE NEAR A BULLISH BREAKOUT -- GOLD MAY GET AN ADDITIONAL LIFT FROM THIS WEEK'S BULLISH BREAKOUT IN THE YEN TO A FIFTEEN MONTH HIGH
by John Murphy,
Chief Technical Analyst, StockCharts.com
COMMODITY PULLBACK IS TIED TO STOCKS... My January 27 message wrote about a bullish breakout in commodity prices to the highest level in two years. I took that as another sign that inflation pressures were starting to build. The weekly bars in Chart 1 show that bullish breakout taking place...
READ MORE
MEMBERS ONLY

Time For Some Temporary Grief In The Equity Market?
by Martin Pring,
President, Pring Research
* Path of recoveries from recent declines have been mixed
* S&P is at short-term resistance
* Some reliable short-term indicators not quite there yet
* Yen breaks out from a large base
Path of recoveries from recent declines have been mixed
After five straight up days since the February 9 intraday...
READ MORE
MEMBERS ONLY

STOCKS RECOVER FROM HIGHER INFLATION REPORT -- NASDAQ 100 IS FIRST INDEX TO REACH 50-DAY LINE -- BANK ETF GAINS MORE GROUND ON RISING YIELDS -- WHILE UTILITIES FALL -- JUMP IN GOLD PUTS IT CLOSER TO MAJOR UPSIDE BREAKOUT -- VIX DROPS TO 20
by John Murphy,
Chief Technical Analyst, StockCharts.com
MAJOR STOCK INDEXES BOUNCE BACK FROM EARLY SELLING ... January's CPI report came in higher than expected and caused stocks to open lower. The headline reading of 2.1% and core reading (excluding food and energy) of 1.8% were higher than economists were expecting. After opening lower, stocks...
READ MORE
MEMBERS ONLY

REGIONAL BANK SPDR EXCEEDS 50-DAY AVERAGE -- LEADERS INCLUDE M&T BANK, BB&T CORP, AND REGIONS FINANCIAL -- JPM IS ANOTHER BANK LEADER -- TRANSPORTS BOUNCE OFF 200-DAY AVERAGE -- WEAK DOLLAR BOOSTS METALS -- STOCK REBOUND STILL HAS FURTHER TO GO
by John Murphy,
Chief Technical Analyst, StockCharts.com
REGIONAL BANK SPDR CLEARS 50-DAY AVERAGE... One of the simplest ways to determine which stock groups, or individual stocks, are leading the market higher is to look for the ones that are clearing their 50-day moving averages first (or stayed above them). Yesterday's message showed the Consumer Discretionary...
READ MORE
MEMBERS ONLY

STOCKS ARE BUILDING ON FRIDAY'S UPSIDE REVERSAL FROM 200-DAY AVERAGE -- THE NEXT TEST WILL COME AT 50-DAY AVERAGES -- SMALL AND MIDSIZE STOCK INDEXES ALSO BOUNCE OFF 200-DAY LINES
by John Murphy,
Chief Technical Analyst, StockCharts.com
MARKETS MOVE FURTHER AWAY FROM 200-DAY LINE... Stocks continue to build on the upside reversal that took place on Friday from 200-day moving averages. The daily bars in Chart 1 show the S&P 500 gaining enough ground today to climb back over its 100-day line (green line). The...
READ MORE
MEMBERS ONLY
US Stock Traders Get Out Their Hammers
by Martin Pring,
President, Pring Research
* Bottoms are being “hammered” out
* VIX is quietening down
* Net new highs offer green shoots
* NASDAQ Chart is turning
Bottoms are being “hammered” out
It has certainly been a wild ride this week, but Friday saw several major indexes trace out a Japanese candlestick pattern known as a “hammer”. This...
READ MORE
MEMBERS ONLY

AN OVERSOLD S&P 500 IS TRYING TO STABILIZE AT ITS 200-DAY MOVING AVERAGE -- THE VIX INDEX IS PULLING BACK FROM RESISTANCE ABOVE THE 40 LEVEL FOR THE SECOND TIME THIS WEEK
by John Murphy,
Chief Technical Analyst, StockCharts.com
S&P 500 IS TESTING ITS 200-DAY AVERAGE ... The downside correction that started a week ago pushed stock prices lower again today. But they're trying to stabilize in afternoon trading. Chart 1 shows the S&P 500 trying to find support at its 200-day moving average....
READ MORE
MEMBERS ONLY

STOCK INDEXES ARE RETESTING INTRA-DAY SUPPORT LEVELS FORMED ON TUESDAY -- THE REBOUND IN THE VIX IS MUCH WEAKER THAN ON TUESDAY
by John Murphy,
Chief Technical Analyst, StockCharts.com
MAJOR STOCK INDEXES ARE RETESTING TUESDAY'S INTRA-DAY LOWS... Stocks are falling sharply again today and are in the process of retesting intra-day support levels formed on Tuesday. That's an important test. The 10-minute bars in Chart 1 shows the Dow Industrials testing lows formed Tuesday between...
READ MORE
MEMBERS ONLY

BOND YIELDS CLIMB BACK NEAR RECENT HIGH -- A BOUNCING DOLLAR IS PUSHING COMMODITIES LOWER -- THE RUSSELL 2000 SMALL CAP INDEX IS BOUNCING OFF ITS 200-DAY MOVING AVERAGE -- THE S&P 500 SLIPS INTO THE RED NEAR THE CLOSE IN HEAVIER TRADING
by John Murphy,
Chief Technical Analyst, StockCharts.com
10-YEAR TREASURY YIELD NEARS ANOTHER FOUR-YEAR HIGH ... A plunging stock market earlier in the week caused some safe-haven bond buying which caused bond yields to weaken. Chart 1, however, shows the 10-Year Treasury yield climbing 7 basis points today and very close to another four-year high. The recent upside breakout...
READ MORE
MEMBERS ONLY

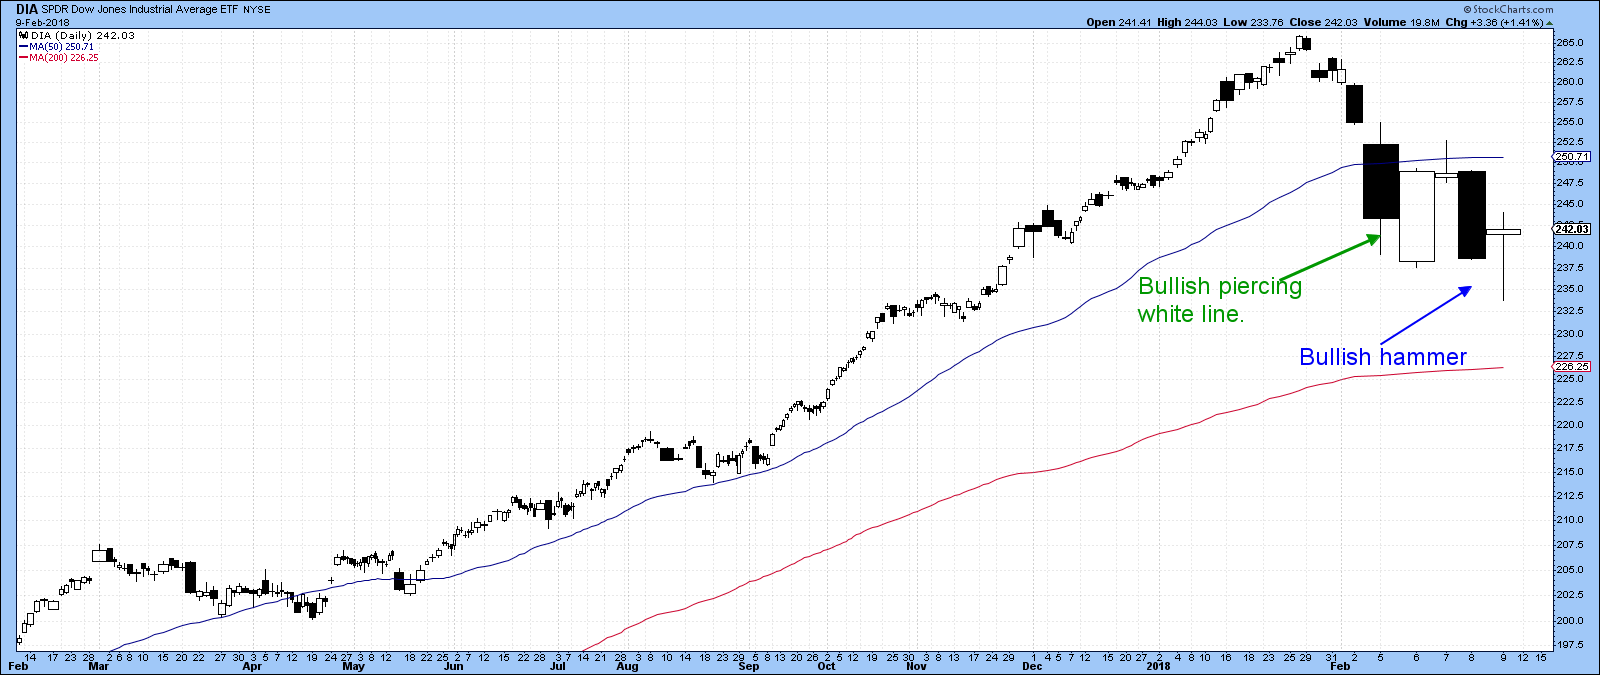
Evidence of A Bottom Looking Stronger
by Martin Pring,
President, Pring Research
* Bullish piercing white line
* Bullish volume
* VIX signaling volatility retreating again
Bullish piercing white line
Tuesday’s market action suggests that the selling squall is over, at least for the time being. That’s because a couple of indexes experienced a bullish candlestick pattern known as a piercing white line....
READ MORE
MEMBERS ONLY

STOCKS ACHIEVE UPSIDE REVERSAL -- S&P 500 BOUNCES OFF TRENDLINE SUPPORT AND 100-DAY AVERAGE -- THE VIX REVERSES LOWER AFTER FAILING TO STAY OVER 40 LEVEL -- APPLE AND DOWDUPONT BOUNCE SHARPLY OFF 200-DAY AVERAGES
by John Murphy,
Chief Technical Analyst, StockCharts.com
S&P 500 REBOUNDS OFF CHART SUPPORT... After opening sharply lower, stocks achieved an upside reversal on heavier volume than yesterday. And stocks bounced off a couple of important support levels. Yesterday's message showed a rising trendline extending back to late 2016 near the 2600 level. The...
READ MORE
MEMBERS ONLY

What To Look For Next
by Martin Pring,
President, Pring Research
* Primary trend indicators are still bullish
* Short-term indicators still overbought
* Very short-term indicators already at extremes
* Bonds bottoming short-term?
I have been saying for some time that the market’s primary trend is a bullish one and that we should not get hung up with short-term corrections. That theory is...
READ MORE
MEMBERS ONLY

STOCKS HAVE WORST DAY IN YEARS -- 50-DAY AVERAGES HAVE BEEN BROKEN -- S&P 500 APPEARS HEADED FOR RETEST OF RISING TRENDLINE EXTENDING BACK TO 2016 -- VIX DOUBLES TO HIGHEST LEVEL IN MORE THAN TWO YEARS -- LATE RALLY IN MAJOR STOCK INDEXES FADES
by John Murphy,
Chief Technical Analyst, StockCharts.com
S&P 500 FALLS BELOW 50-DAY AVERAGE... Stocks had a terrible day today. Major stock indexes in the U.S. lost about 4% in one day. And some chart damage was done. The daily bars in Chart 1 show the S&P 500 falling well below its 50-day...
READ MORE
MEMBERS ONLY

RISING BOND YIELDS ARE RATTLING STOCK HOLDERS -- TEN YEAR YIELD REACHES FOUR-YEAR HIGH -- BOND YIELDS ARE RISING FASTER THAN STOCKS FOR THE FIRST TIME SINCE THE BULL MARKET STARTED -- THE VIX INDEX SURGES TO FIFTEEN-MONTH HIGH
by John Murphy,
Chief Technical Analyst, StockCharts.com
BOND YIELDS ARE CLIMBING ... Bond yields are rising a lot faster than a lot of people expected. And that's starting to worry stock holders. The weekly bars in Chart 1 show the 30-Year Treasury Yield rising over 3.00% for the first time since last March and heading...
READ MORE
MEMBERS ONLY

Market Roundup With Martin Pring 2018-02-01
by Martin Pring,
President, Pring Research
* Big changes in all four areas
* Equities
* Commodities
* Currencies
* Bonds
This months market roundup has a lot of charts that are breaking out on long term relative strength breakouts.
Market Roundup With Martin Pring 2018-02-01 from StockCharts.com on Vimeo.
Chartcon 2018 registration is now open! Registration kicked off today,...
READ MORE
MEMBERS ONLY

Pause In An Ongoing Uptrend?
by Martin Pring,
President, Pring Research
* The underlying trend of improving confidence continues
* Several indicators are pointing to some kind of a correction
* Small caps are lagging
The underlying trend of improving confidence continues
The longer-term indicators monitoring the primary trend of the US stock market continue to point north. So too, do the various confidence...
READ MORE
MEMBERS ONLY

AVERAGE DIRECTIONAL INDEX SHOWS AN OVERBOUGHT MARKET IN NEED OF A BREATHER -- THE LAST 5% PULLBACK IN STOCKS WAS FIFTEEN MONTHS AGO -- CONTRACTING BOLLINGER BANDS ALSO HINT AT SOME WEAKENING IN THE MARKET'S SHORT-TERM UPTREND
by John Murphy,
Chief Technical Analyst, StockCharts.com
S&P 500 IS DUE FOR A PAUSE ... There are a number of ways to tell when a market is stretched too far. My January 6 message pointed out that the 14-month RSI for the S&P 500 was the most overbought since the late 1990s (twenty years...
READ MORE
MEMBERS ONLY

CRB COMMODITY INDEX ACHIEVES A BULLISH BREAKOUT BY REACHING A TWO-YEAR HIGH -- THAT HELPED PUSH THE TEN-YEAR TREASURY YIELD TO THE HIGHEST LEVEL IN THREE YEARS -- SO DID THE FACT THAT GERMAN AND AND BRITISH YIELDS TURNED UP THIS WEEK
by John Murphy,
Chief Technical Analyst, StockCharts.com
CRB INDEX ACHIEVES BULLISH BREAKOUT ... A couple of messages during the week showed the Bloomberg Commodity Index nearing a two-year high. It broke through those highs during the week. Today's message shows the more widely-followed Reuters/Jefferies CRB Index accomplishing a bullish breakout of its own by rising...
READ MORE
MEMBERS ONLY
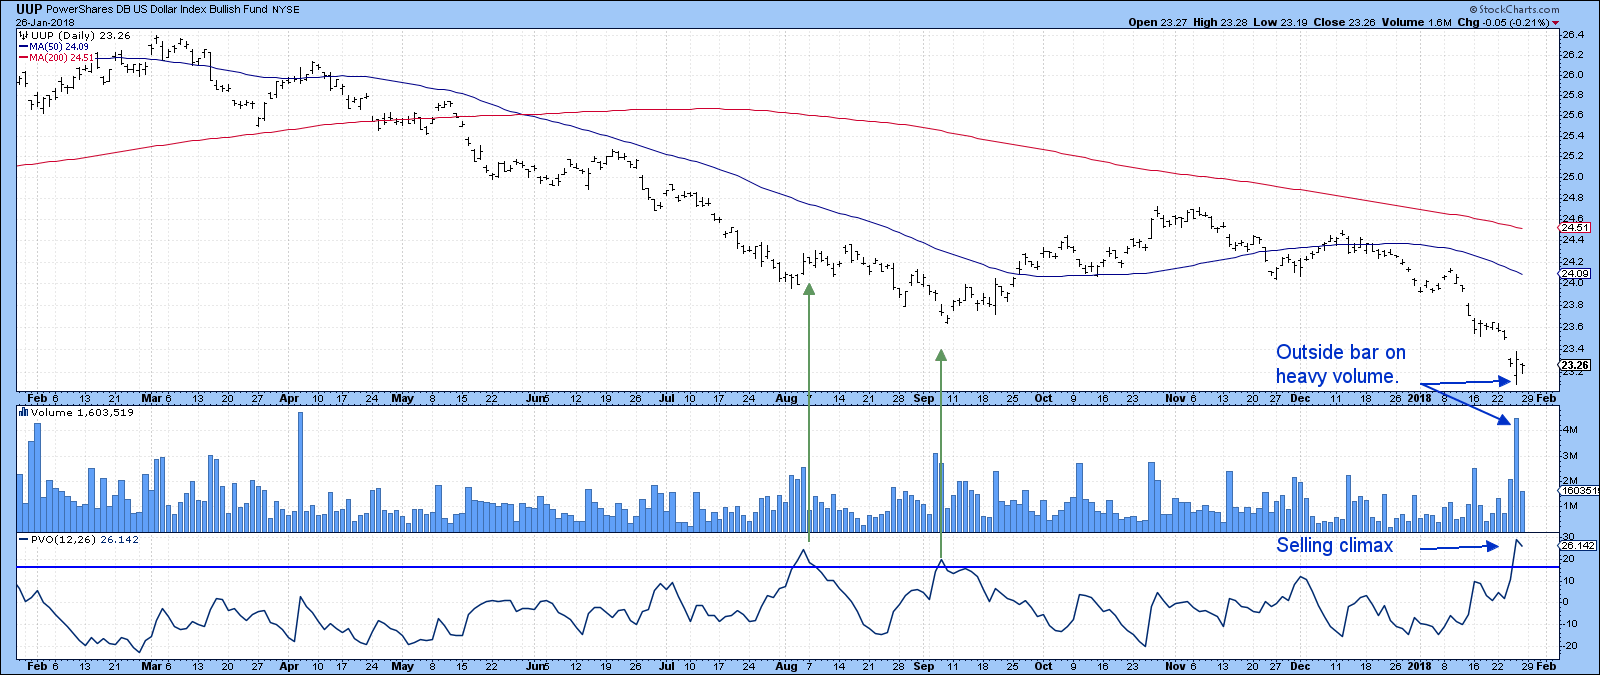
Dollar Bear Market Is Not A One Way Street
by Martin Pring,
President, Pring Research
* Dollar experiences a short-term reversal
* Commodities are in a bull market but adversely affected near-term
* Gold showing signs of tiredness but still within a base building process
Dollar experiences a short-term reversal
It’s a funny thing in markets, when you have just grown comfortable with a move, it sometimes...
READ MORE
MEMBERS ONLY

HEALTHCARE SPDR HITS NEW RECORD AND IS PLAYING CATCH-UP TO THE REST OF THE MARKET -- AMGEN AND BIOGEN LEAD BIOTECH ISHARES HIGHER -- ABBVIE EXPLODES TO NEW RECORD AND HELPS BOOST PHARMACEUTICAL ETF TO HIGHEST LEVEL IN TWO YEARS
by John Murphy,
Chief Technical Analyst, StockCharts.com
HEALTHCARE SECTOR IS PLAYING CATCH-UP ... Healthcare stocks are off to a good start for the new year, and are one of the market's strongest sectors. That's a big change from the past three years when healthcare was one of the markets weakest laggards. That's...
READ MORE
MEMBERS ONLY

TREASURY SECRETARY TALKS DOWN THE DOLLAR WHICH DROPS SHARPLY -- BRITISH POUND SURGES AGAINST THE DOLLAR -- WHILE BRITISH BOND YIELD RISES TO HIGHEST LEVEL IN A YEAR -- BIG DROP IN DOLLAR PUSHES BLOOMBERG COMMODITY INDEX NEAR A TWO-YEAR HIGH
by John Murphy,
Chief Technical Analyst, StockCharts.com
BRITISH POUND RISES WITH UK BOND YIELDS ... It's now official that the U.S. government wants a weaker dollar. Speaking in Switzerland, Treasury Secretary Mnuchin stated that a weak dollar is good for the U.S. economy, and would help reduce the U.S. trade deficit. That'...
READ MORE
MEMBERS ONLY

FALLING DOLLAR PUSHES BLOOMBERG COMMODITY INDEX TO ELEVEN MONTH HIGH -- GOLD NEARS ANOTHER FOUR-MONTH HIGH -- A WEAK DOLLAR ALSO FAVORS LARGE CAPS OVER SMALLER STOCKS -- S&P BIOTECH SPDR REACHES NEW RECORD
by John Murphy,
Chief Technical Analyst, StockCharts.com
DOLLAR CONTINUES TO WEAKEN AS FOREIGN CURRENCIES RISE... Chart 1 shows the PowerShares Dollar Index (UUP) falling today to the lowest level in three years. The dollar is losing ground against virtually all major foreign currencies. Most of the upward movement in the UUP is coming from buying of the...
READ MORE
MEMBERS ONLY

Confidence Is Breaking Out All Over
by Martin Pring,
President, Pring Research
* Last week’s bearish dark cloud cover fails
* These confidence ratios are breaking to the upside and that’s bullish for stocks
Last week’s bearish dark cloud cover fails
Last week I pointed out that many of the principal indexes had traced out bearish dark cloud cover candlestick patterns....
READ MORE
MEMBERS ONLY

TEN-YEAR TREASURY YIELD TOUCHES THREE-YEAR HIGH -- STRONG CHINESE ECONOMY PUSHES MAINLAND STOCKS HIGHER -- HONG KONG HITS A NEW RECORD -- A WEAKER DOLLAR FAVORS FOREIGN STOCKS -- FOREIGN STOCK ETFS GET A BOOST FROM RISING LOCAL CURRENCIES
by John Murphy,
Chief Technical Analyst, StockCharts.com
TEN-YEAR BOND YIELD TOUCHES THREE-YEAR HIGH ... The weekly bars in Chart 1 show the 10-Year Treasury Yield touching the highest level in three years today. A decisive close above its late 2016 peak (2.62%) would signal even higher rates. That's a lot better for stocks than it...
READ MORE
MEMBERS ONLY

STOCK BUYING RESUMES AFTER YESTERDAY'S PULLBACK -- DOW REGAINS 26K -- YESTERDAY'S INTRA-DAY LOW PROVIDES A SHORT-TERM SUPPORT LEVEL -- SEMICONDUCTORS LEAD TECHNOLOGY SECTOR TO NEW HIGH
by John Murphy,
Chief Technical Analyst, StockCharts.com
MARKET INDEXES NEAR YESTERDAY'S INTRA-DAY HIGH ... Stocks are making a strong comeback after yesterday afternoon's pullback. The charts below show 30-minute price bars for the three major stock indexes. All three are approaching the intra-day highs reached yesterday. Chart 1 also shows the Dow Industrials back...
READ MORE
MEMBERS ONLY

Cold Weather And Dark Cloud Cover Seen Over Wall Street
by Martin Pring,
President, Pring Research
* Dark cloud cover explained
* What enhances a dark cloud signal
* How long is its bearish effect likely to last?
Dark cloud cover explained
The weather forecast this morning was for wintery weather on the East Coast. However, a more sobering non-meteorological message has been given by the stock market. Tuesday’...
READ MORE
MEMBERS ONLY

Several Intermarket Relationships Are Forecasting Higher Commodity Prices
by Martin Pring,
President, Pring Research
* CRB Composite nudging through mega resistance
* Key intermarket relationships starting to point in an inflationary direction
* Inter-asset ratios also confirm the inflationary scenario
* Euro breaks to the upside
CRB Composite nudging through mega resistance
Late last month I wrote about several charts I was watching for a possible breakout in...
READ MORE
MEMBERS ONLY

EURO REACHES THREE-YEAR HIGH AGAINST DOLLAR -- THAT'S GOOD FOR COMMODITIES -- ENERGY SPDR BREAKS OUT TO THE UPSIDE -- DECEMBER CPI ABOVE 2% SECOND MONTH IN A ROW -- CORE CPI HAS BIGGEST JUMP IN 11 MONTHS -- WHAT ENERGY DROP
by John Murphy,
Chief Technical Analyst, StockCharts.com
EURO REACHES THREE-YEAR HIGH ... Yesterday's message showed the euro on the verge of a new three-year high. The weekly bars in Chart 1 show the eurozone currency achieving that bullish breakout in today's trading. I also mentioned yesterday that a move above 1.20 would push...
READ MORE
MEMBERS ONLY

A TEN-YEAR TREASURY YIELD MOVE ABOVE 2.62% WOULD PAVE THE WAY FOR 3% YIELD LATER THIS YEAR -- THAT WOULD PUT THE THIRTY-FIVE YEAR DECLINE IN BOND YIELDS IN JEOPARDY -- GERMAN YIELD NEARS TWO-YEAR HIGH ON HAWKISH ECB HINT
by John Murphy,
Chief Technical Analyst, StockCharts.com
A LONGER TERM LOOK AT RISING BOND YIELDS... Chart evidence of a major upturn in Treasury bond yields continues to grow. The weekly bars in Chart 1 show the 10-Year Treasury yield ($TNX) nearing a test of its late 2016 intra-day peak at 2.62%. A decisive move above that...
READ MORE
MEMBERS ONLY

Bond Yields Are Breaking Out All Over
by Martin Pring,
President, Pring Research
* Basic changes in long-term momentum
* The five-year maturity is signalling an end to the secular decline in yields
* Twenty-year yield showing signs of basing
* Ten-year attacking mega down trend line
* From a short-term aspect bond prices look vulnerable
* Utilities about to crash?
Basic changes in long-term momentum
Since the beginning...
READ MORE
MEMBERS ONLY

TEN-YEAR TREASURY YIELD JUMPS TO NINE MONTH HIGH -- BANK OF JAPAN CUTS BOND PURCHASES -- THAT'S BOOSTING BANKS WHILE HURTING UTILITIES -- A DRAMATIC ROTATION OUT OF UTILITIES INTO TRANSPORTS POINTS TO A STRONGER ECONOMY AND HIGHER RATES
by John Murphy,
Chief Technical Analyst, StockCharts.com
TEN-YEAR TREASURY YIELD REACHES HIGHEST LEVEL SINCE MARCH ... Chart 1 shows the 10-Year Treasury Yield ($TNX) climbing 5 basis points to 2.53% which is the highest level since last March. That leaves little doubt that the trend for Treasury yields is upward. Part of the reason for today'...
READ MORE
MEMBERS ONLY

GLOBAL STOCKS START YEAR WITH A BANG WITH STOCKS AROUND THE WORLD HITTING NEW RECORDS -- BUT THE S&P 500 INDEX IS THE MOST OVERBOUGHT IN TWENTY YEARS -- AND IS WELL INTO A FIVE-WAVE ADVANCE -- THE CRB INDEX MAY BE NEARING AN UPSIDE BREAKOUT
by John Murphy,
Chief Technical Analyst, StockCharts.com
S&P 500 IS MOST OVERBOUGHT SINCE LATE 1990S... Global stock markets started off the new year with a bang. U.S. stock indexes exploded to record highs for the best start in years. Foreign stock benchmarks did the same, including the FTSE All World Stock Index which also...
READ MORE
MEMBERS ONLY
Martin Pring's Market Roundup Video January 2018-01-03
by Martin Pring,
President, Pring Research
This months Market Roundup live video has a lot of information on the bond market. The six-stage cycle is currently in Stage 3. This large overview shows some of the major macro trends that are breaking right now.
Market Roundup With Martin Pring 2018-01-03 from StockCharts.com on Vimeo.
Good...
READ MORE
MEMBERS ONLY
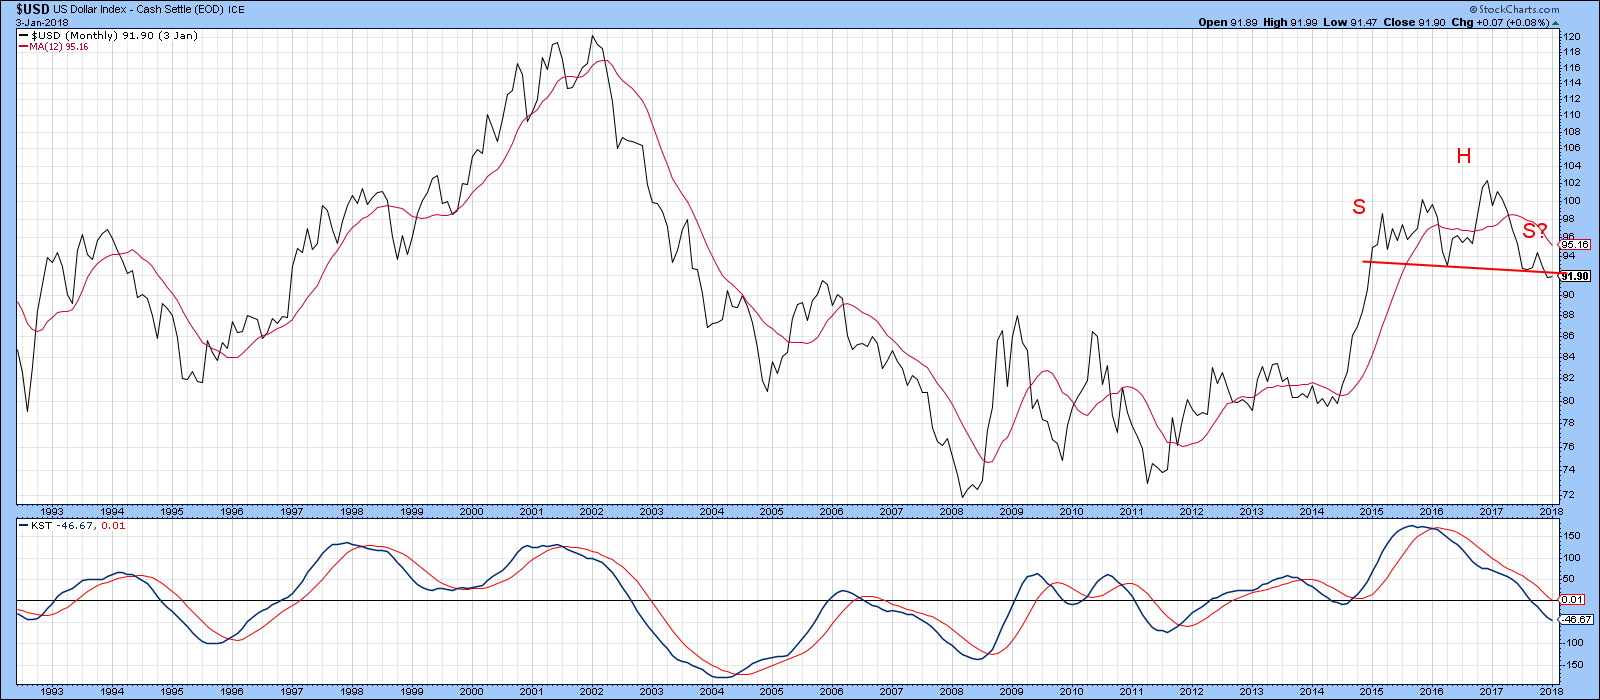
Dollar Index Is Just Above Make Or Break Support--- Will It Bounce Or Break?
by Martin Pring,
President, Pring Research
Dollar Index is in a confirmed bear market
* Dollar sympathy indicators are close to a major breakdown
* Canadian and Aussie dollars are driven by commodity prices
* Emerging Market ETF benefiting from a weaker dollar
Dollar Index is in a confirmed bear market
As 2018 begins to unfold the Dollar Index...
READ MORE
MEMBERS ONLY

CRUDE OIL HITS ANOTHER HIGH AND NEARS TEST OF $62 -- UNITED STATES OIL FUND NEARS TEST OF SPRING 2016 HIGH -- ENERGY SPDR MAY ON THE VERGE OF A BULLISH BREAKOUT -- ENERGY/SPX RELATIVE STRENGTH RATIO REACHES HIGHEST LEVEL IN EIGHT MONTHS
by John Murphy,
Chief Technical Analyst, StockCharts.com
UNITED STATES OIL FUND NEARS UPSIDE BREAKOUT ... Energy prices continue to rise. WTIC Light Crude Oil is trading over $61 today for the first time more than two years and is nearing a test of its spring 2015 high just over $62. Chart 1 shows the United States Oil Fund...
READ MORE