MEMBERS ONLY

Financials Break To The Upside And That's Good For The Market

by Martin Pring,
President, Pring Research
* The head and shoulders that did not “work”
* Inflation versus deflation sectors
* Which are the financial sector stars?
* Why financials matter
The head and shoulders that did not “work”
On this same date in May we published an article suggesting that financials could be an interesting area to monitor for...
READ MORE
MEMBERS ONLY

INVESTORS ARE SELLING TECHNOLOGY AND BUYING FINANCIALS -- THAT SUGGESTS A ROTATION OUT OF GROWTH AND INTO VALUE STOCKS

by John Murphy,
Chief Technical Analyst, StockCharts.com
HEAVY PROFIT-TAKING IN TECHNOLOGY... An overbought technology sector is being sold heavily today. Chart 1 shows the PowerShares Nasdaq 100 (QQQ) tumbling in heavy trading. That's mainly big technology stocks. Chart 2 shows the Technology SPDR (XLK) looking just as bad. The FANG stocks are a big part...
READ MORE
MEMBERS ONLY

FINANCIALS HAVE A STRONG DAY -- BANK AND BROKER ETFS TURN UP -- ASSET MANAGERS INDEX HITS NEW RECORD -- LEADERS INCLUDE BLACKROCK, STATE STREET, AND BANK OF NEW YORK MELLON -- FINANCIAL RALLY MAY ALSO EXPLAIN SMALL CAP BUYING
by John Murphy,
Chief Technical Analyst, StockCharts.com
FINANCIAL SPDR TURNS SHARPLY HIGHER... Financial stocks are having a very strong day. Chart 1 shows the Financial Sector SPDR (XLF) surging to the highest level in a month and, in the process, clearing its 50-day average. That puts the XLF in position to challenge its spring highs. A decisive...
READ MORE
MEMBERS ONLY

AIRLINES ARE LEADING TRANSPORTATION STOCKS HIGHER -- AIRLINE INDEX HITS RECORD HIGH -- DAY'S LEADERS ARE ALASKA AIR, DELTA, AMERICAN AIRLINES, AND JETBLUE -- FEDEX ACHIEVES BULLISH BREAKOUT -- KANSAS CITY SOUTHERN MAY BE CLOSE TO ONE
by John Murphy,
Chief Technical Analyst, StockCharts.com
TRANSPORTS CONTINUE TO GAIN... The daily bars in Chart 1 show the Dow Jones Transportation Average reversing higher today to continue its recent upturn. After finding support at its 200-day average during May, the TRAN rose above a three-month resistance line last week to signal its takeoff. It now appears...
READ MORE
MEMBERS ONLY
Market Round Up Video With Martin Pring 2017-06-02
by Martin Pring,
President, Pring Research
Here is the link to this months Market Round Up with Martin Pring for June 2017. Don't forget to use the HD button for better quality.
Market Round Up Live With Martin Pring 2017-06-02 from StockCharts.com on Vimeo.
Good luck and good trading,
Martin J. Pring...
READ MORE
MEMBERS ONLY

STAPLES AND CYCLICALS HIT NEW HIGHS TOGETHER -- BUT CYCLICALS STILL HAVE THE EDGE -- HEALTHCARE SPDR HITS NEW RECORD HIGH -- MIDCAPS MAY GIVE TRUER PICTURE OF STOCK MARKET --S&P 400 MID CAP INDEX IS CONSOLIDATING IN BULLISH TRIANGLE
by John Murphy,
Chief Technical Analyst, StockCharts.com
STAPLES AND CYLICALS BOTH HIT NEW HIGHS... We can often get clues about stock market direction by watching shifting rotations among market sectors. In a strong market, stocks tied to the economy usually lead. In a correction, defensive stocks lead. But what are we to make of a situation where...
READ MORE
MEMBERS ONLY

FINANCIALS LEAD MARKET LOWER -- FALLING YIELD CURVE HURTS BANKS -- FALLING YIELDS, HOWEVER, PUSH UTILITIES TO NEW HIGHS -- SMALL CAPS CONTINUE TO UNDERFORM -- U.S. LARGE CAP STRENGTH MAY HAVE MORE TO DO WITH STRONGER FOREIGN MARKETS
by John Murphy,
Chief Technical Analyst, StockCharts.com
FALLING BOND YIELD PUSHES YIELD CURVE LOWER... The divergence between falling Treasury bond yields and rising stock indexes may be starting to take its toll on the stock market. Major stock indexes are in the red today. The biggest selling, however, is coming from small caps and financials. At the...
READ MORE
MEMBERS ONLY

Perhaps The Fed Won't Raise Rates After All?
by Martin Pring,
President, Pring Research
* Long-term background for bonds
* Bond Prices at a critical short-term juncture point
* Is the 5-year yield forming a massive top?
* Utilities moving in sympathy with bonds
* Interest sensitive REITS starting to improve
* Follow the commodities
Long-term background for bonds
A lot of people are betting that stronger economic data will...
READ MORE
MEMBERS ONLY

GROWTH STOCKS ARE CARRYING MARKET HIGHER -- THAT'S MAINLY BIG TECHS -- VALUE STOCKS ARE LAGGING BEHIND -- THAT'S MAINLY FINANCIALS AND ENERGY -- % OF STOCKS ABOVE 50- AND 200-DAY AVERAGES NEED TO START CLIMBING
by John Murphy,
Chief Technical Analyst, StockCharts.com
GROWTH STOCKS ARE LEADING THIS YEAR'S STOCK RALLY... The S&P 500 and the Nasdaq hit new record highs yesterday, and the Dow isn't far behind. Large parts of the stock market, however, are lagging behind. That's not necessarily a good thing. The...
READ MORE
MEMBERS ONLY

Five Charts That Say Today's S&P Breakout Is For Real
by Martin Pring,
President, Pring Research
* Lots of supporting breakouts
* Confidence ratio on the verge of a major bullish breakout?
* Financials: trick or treat?
* The US is due for a bounce against the rest of the world
* Is it time to play the China card?
Lots of supporting breakouts
Last week I pointed out that the...
READ MORE
MEMBERS ONLY

AIRLINES ARE LEADING INDUSTRIAL SPDR TO NEW HIGHS -- AIRLINE LEADERS ARE UAL, SOUTHWEST, AND JETBLUE -- TRANSPORTATION AVERAGE ISHARES CLEAR 50-DAY LINE -- DOW INDUSTRIALS NEAR NEW RECORD -- S&P 500 IS ALREADY THERE
by John Murphy,
Chief Technical Analyst, StockCharts.com
INDUSTRIAL SPDR HITS NEW RECORD... Chart 1 shows the Industrial Select SPDR (XLK) trading in record territory today. Today's higher price action is pushing the XLI above a sideways trading pattern that's been in effect since the start of March. Its relative strength line (above chart)...
READ MORE
MEMBERS ONLY

Dollar Index Triggers Some Long-term Sell Signals
by Martin Pring,
President, Pring Research
* Dollar Index experiences major trendline breaks and MA crossovers
* Dollar sympathy relationships confirm a weaker dollar
* Emerging currencies are emerging
* Some currencies remain in bear market against the dollar
Dollar Index experiences major trendline breaks and MA crossovers
This week, the US Dollar Index ($USD) violated several key benchmarks, leading...
READ MORE
MEMBERS ONLY

RISING EUROPEAN CURRENCIES ARE PUSHING THE DOLLAR LOWER -- THE FALLING DOLLAR, HOWEVER, IS BOOSTING COMMODITIES -- BLOOMBERG COMMODITY INDEX IS BOUNCING OFF CHART SUPPORT -- FRIDAY'S REBOUND REPAIRS SOME DAMAGE
by John Murphy,
Chief Technical Analyst, StockCharts.com
RISING EUROPEAN CURRENCIES ARE PUSHING THE DOLLAR LOWER... While stocks are rebounding today, the dollar isn't. Chart 1 shows the Power Shares Dollar Index ETF (UUP) falling again today to the lowest level since November. It may seem surprising to see the dollar continuing to drop with bond...
READ MORE
MEMBERS ONLY

Two Important Areas To Watch- $VIX and Financials
by Martin Pring,
President, Pring Research
* 10-day ROC for the VIX may have a message for traders
* Close that gap on your way out
* Financials, a canary in the coal line for stocks in general
Last week I wrote about the $VIX and concluded that a low reading, such as we recently saw, usually precedes a...
READ MORE
MEMBERS ONLY

BIG DROPS IN BOND YIELDS AND DOLLAR SHOW LOSS OF CONFIDENCE -- FINANCIALS, SMALL CAPS, AND TRANSPORTS LEAD MARKET LOWER -- FALLING STOCK INDEXES ARE SUFFERING SHORT-TERM CHART DAMAGE -- TRADERS COULD BE SELLING IN MAY
by John Murphy,
Chief Technical Analyst, StockCharts.com
BOND YIELDS CONTINUE TO DROP ... My Saturday message issued some short-term warnings for the market. Part of that warning came from falling bond yields which hinted that fixed income traders were turning more pessimistic. Another came from weak performances by banks, small caps, and transports which are leading the stock...
READ MORE
MEMBERS ONLY

U.S. UNDERPERFORMS FOREIGN STOCKS -- DECADE OF U.S. LEADERSHIP MAY BE ENDING -- VANGUARD FOREIGN STOCK ETF HITS TEN-YEAR HIGH -- EUROZONE SHARES ALSO BREAK OUT -- UK ISHARES BENEFIT FROM STRONGER POUND -- RISING EMERGING CURRENCIES BENEFIT EM STOCKS
by John Murphy,
Chief Technical Analyst, StockCharts.com
U.S. STOCKS ARE GLOBAL UNDERACHIEVERS... Several of my previous messages have written about foreign stocks doing better than those in the U.S. this year. I'll come back to those foreign charts shortly. Chart 1, however, is designed to show how weak U.S. stocks have been...
READ MORE
MEMBERS ONLY
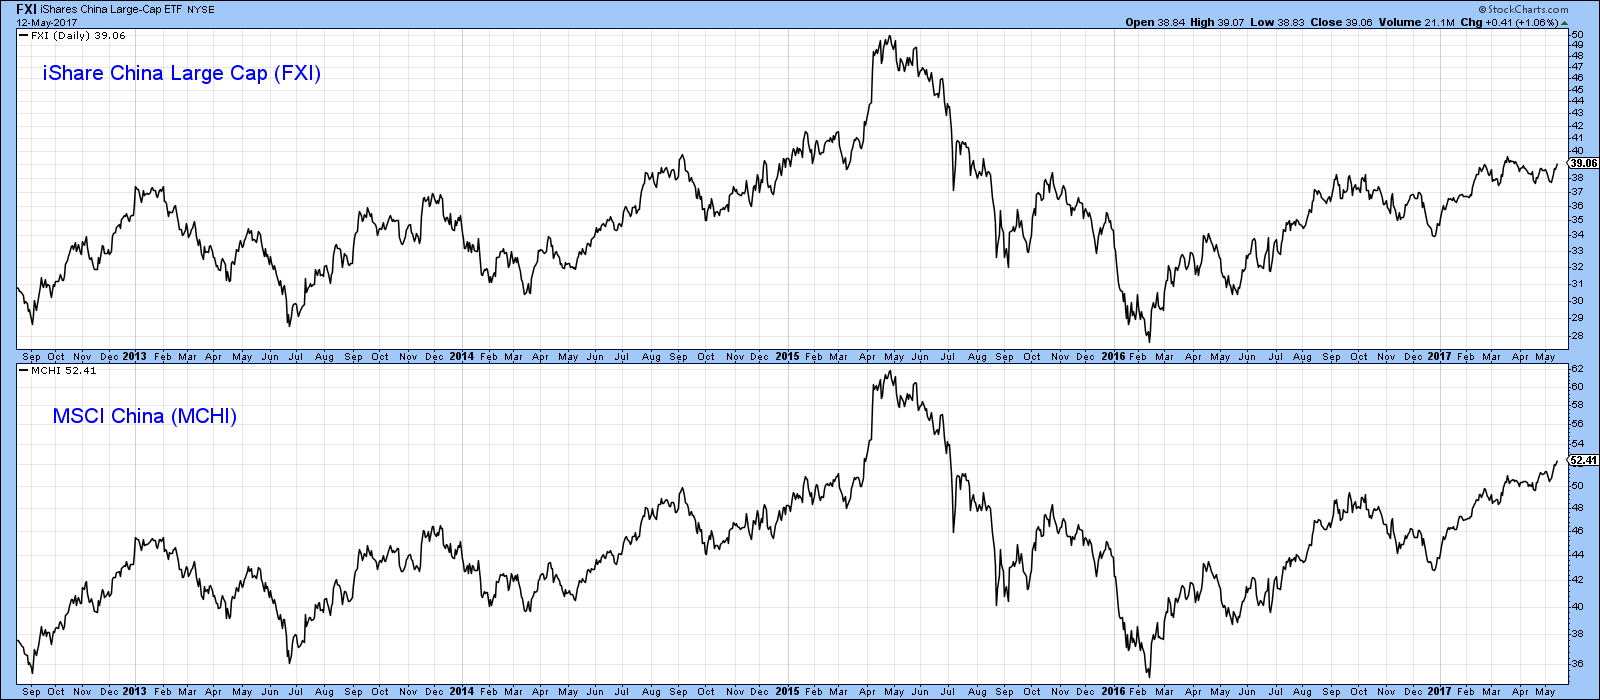
Chinese ETF's Are Playing Good Cop Bad Cop
by Martin Pring,
President, Pring Research
* Trying to replicate the Shanghai Composite with a Chinese ETF
* Global Update
Years ago, investing in China was a challenging proposition for US based investors. In recent years though, a number of ETF’s have been listed that embrace Chinese Indexes as well as specific sectors. The big daddy of...
READ MORE
MEMBERS ONLY

DROP IN BOND YIELDS SENDS CAUTION SIGNAL -- THAT KEEPS BANKS ON THE DEFENSIVE -- SMALL CAPS AND TRANSPORTS ARE SHOWING RELATIVE WEAKNESS -- AMAZON RISE OFFSETS DEPARTMENT STORE LOSSES -- TECHNOLOGY SHARES LEAD TAIWAN MARKET TO SEVENTEEN YEAR HIGH
by John Murphy,
Chief Technical Analyst, StockCharts.com
BOND YIELDS DROP ON FRIDAY... Some caution crept into financial markets near the end of the week. Part of that was reflected in Friday's sharp drop in bond yields. Chart 1 shows the 10-Year Treasury Yield falling back below its 50-day average in pretty decisive fashion. That was...
READ MORE
MEMBERS ONLY

When Does A Low VIX Reading Matter?
by Martin Pring,
President, Pring Research
* The VIX
* The Dollar Index
* The Euro
* Swiss Franc
* Japanese Yen
The VIX
Most of this piece is devoted to the dollar and some interesting looking currencies. However, I have been intrigued by a couple of articles and news stories recently appearing in the general purpose media. They have pointed...
READ MORE
MEMBERS ONLY

FALLING COMMODITIES AREN'T DRIVING EMERGING MARKETS HIGHER -- TECHNOLOGY IS -- THAT'S ESPECIALLY TRUE IN SOUTH KOREA AND TAIWAN WHICH ARE EEM LEADERS -- TAIWAN SEMICONDUCTOR IS LEADING SEMICONDUCTOR ETF TO NEW HIGHS
by John Murphy,
Chief Technical Analyst, StockCharts.com
COMMODITIES DIVERGE FROM EEM... One of the long-held principles of emerging market behavior is that they're closely correlated to the direction of commodity prices. That's because several large emerging markets are exporters of commodities (like Brazil and Russia). China is the world's biggest importer...
READ MORE
MEMBERS ONLY

Sell In May And Go Away? Forget Stocks But How About Commodities?
by Martin Pring,
President, Pring Research
* $CRB and oil break to the downside
* The stock market says commodities are headed lower
* Bond market participants leaning in a deflationary way
* Watch those commodity currencies
The usual “Sell in May and Go Away” articles are starting to appear bigly, and a case can indeed be made in that...
READ MORE
MEMBERS ONLY

SECTOR RANKINGS AND WEIGHTINGS ARE STILL MARKET POSITIVE -- THE YEAR'S TOP FOUR SECTORS ACCOUNT FOR MORE THAN HALF OF THE S&P 500 -- ANOTHER 15% ARE MATCHING S&P 500 PERFORMANCE -- ENERGY IS THE BIGGEST LAGGARD BUT ACCOUNTS FOR ONLY 8% OF S&P 500
by John Murphy,
Chief Technical Analyst, StockCharts.com
SECTOR LEADERSHIP... One of the problems facing the current stock market is that some sectors have been rising, while others have suffered large losses. Since the start of the year, for example, technology has gained nearly 14% versus a 6.7% gain for the S&P 500. Energy stocks,...
READ MORE
MEMBERS ONLY

RISING RATES PUNISH GOLD -- BASE METALS AND MINERS ARE ALSO FALLING -- CHINA WEAKNESS MAY EXPLAIN WHY -- FALLING COMMODITIES AND WEAK CANADIAN DOLLAR PUSH CANADA ISHARES BELOW 200-DAY AVERAGE -- INSURANCE ETF GETS A BOOST FROM RISING BOND YIELDS
by John Murphy,
Chief Technical Analyst, StockCharts.com
GOLD ASSETS ARE ALSO FALLING... Add gold and gold miners to the list of former safe havens that are weakening. Chart 1 shows the Gold SPDR (GLD) falling to a seven-week low today and back below its moving average lines. Gold miners are doing even worse. Chart 2 shows the...
READ MORE
MEMBERS ONLY

BOND YIELDS MAY BE BOTTOMING -- BOND ETF FAILS AT 200-DAY AVERAGE -- RELATIVE WEAKNESS IN UTILITIES AND REITS HINT AT LOWER BOND PRICES -- FINANCIALS MAY BE TURNING UP -- A HIGHER FINANCIALS/UTILITIES RATIO WOULD SIGNAL HIGHER YIELDS
by John Murphy,
Chief Technical Analyst, StockCharts.com
TEN-YEAR TREASURY YIELD STILL IN UPTREND... Today's Fed announcement contained no surprises. However, the Fed's view that recent economic softness is "transitory" in nature appears to have caused an uptick in bond yields. Technical factors also appear to favor higher yields. I'll...
READ MORE
MEMBERS ONLY

Global Equities Trick or Treat?
by Martin Pring,
President, Pring Research
* A few words on long-term charts
* US equities starting a period of underperformance?
* Overcoming resistance
* Chinese equities look vulnerable
* Good looking country charts
A few words on long-term charts
I like looking at short-term charts because you can sometimes pick up some interesting psychological characteristics through divergences, candlesticks and one...
READ MORE
MEMBERS ONLY
Market Roundup Video For May 2017
by Martin Pring,
President, Pring Research
Here is the link to the Market Roundup Live by Martin Pring 2017-05-02.
Market Round Up Live With Martin Pring 2017-05-02 from StockCharts.com on Vimeo.
Good luck and good charting,
Martin J. Pring...
READ MORE
MEMBERS ONLY

DEFENSIVE CONSUMER STAPLES ARE WEAKENING -- WHILE ECONOMICALLY SENSITIVE CONSUMER CYCLICALS ARE MARKET LEADERS -- CYCLICALS/STAPLES RATIO TURNS UP -- MARTIN MARIETTA AND VULCAN MATERIALS ARE HAVING A VERY STRONG DAY
by John Murphy,
Chief Technical Analyst, StockCharts.com
CONSUMER STAPLES ARE WEAKENING... Defensive parts of the market are starting to weaken. That includes consumer staples. At the same time, money is flowing back into more economically sensitive stock groups like consumer discretionary stocks (more on that shortly). That's normally a good sign for the market. Chart...
READ MORE
MEMBERS ONLY

Gold Faces A Critically Important Technical Test In The Weeks Ahead
by Martin Pring,
President, Pring Research
* Gold’s long term trading range
* Watch those Gold shares for clues about Gold
* Hail Silver?
Gold’s long term trading range
Gold is often regarded as a safe-haven investment, but is more normally held as a hedge against inflation. Chart 1 deflates the price by the CPI, so you...
READ MORE
MEMBERS ONLY

HEALTHCARE IS QUIETLY MOVING HIGHER -- INDIVIDUAL LEADERS ARE EDWARDS LIFESCIENCES, VARIAN MEDICAL, AND ABBVIE -- U.S. MEDICAL DEVICES ETF REPRESENTS THE STRONGEST PART OF HEALTHCARE -- BOSTON SCIENTIFIC IS ONE OF ITS LEADERS
by John Murphy,
Chief Technical Analyst, StockCharts.com
HEALTH CARE SPDR NEARS RECORD HIGH... Although it hasn't received much attention lately, the healthcare sector is quietly moving higher. In fact, healthcare is the third strongest sector this year behind technology and consumer cyclicals. And its chart looks promising. Chart 1 shows the Health Care SPDR (XLV)...
READ MORE
MEMBERS ONLY

NASDAQ HITS NEW RECORD WHILE DOW INDUSTRIALS AND S&P 500 TURN UP -- SMALL CAPS HIT NEW RECORD AND SHOW NEW LEADERSHIP -- SO DO MATERIALS -- ALCOA LEADS ALUMINUM SHARES HIGHER -- FLIGHT FROM SAFE HAVENS PUSHES GOLD MINERS LOWER
by John Murphy,
Chief Technical Analyst, StockCharts.com
MARKET INDEXES TURN HIGHER ... The stock market is continuing to benefit from the "risk on" rally that started yesterday after the weekend vote in France. And all signs are currently positive. Chart 1 shows the PowerShares QQQ hitting a new record for the second day in row. The...
READ MORE
MEMBERS ONLY

FRENCH VOTE SENDS GLOBAL STOCKS HIGHER -- FRANCE LEADS EUROPEAN RALLY -- EUROZONE ISHARES REACH THREE-YEAR HIGH -- A STRONGER EURO WOULD BOOST EUROZONE PERFORMANCE -- U.S. STOCKS FOLLOW EUROPE HIGHER AS SAFE HAVENS WEAKEN
by John Murphy,
Chief Technical Analyst, StockCharts.com
FRANCE LEADS EUROPE HIGHER... French stocks are leading big gains in eurozone stocks. A strong Euro is giving an even bigger boost to eurozone ETFs. Chart 1 shows MSCI France iShares (EWQ) surging more than 5% to the highest level in three years. That compares with a 4% gain in...
READ MORE
MEMBERS ONLY

MONEY IS ROTATING INTO THE EUROZONE WHICH IS OUTPERFORMING THE U.S. -- BRITISH STOCKS ARE LAGGING BEHIND -- BRITISH ISHARES HAVE BEEN HURT BY A WEAK POUND -- ROTATION INTO EUROPE MAY SLOW U.S. RALLY, BUT SUGGESTS GLOBAL BULL MARKET IS STILL INTACT
by John Murphy,
Chief Technical Analyst, StockCharts.com
EUROZONE STOCKS ARE ATTRACTING GLOBAL FUNDS ... Part of the reason that U.S. stocks haven't been doing so well during 2017 is that global funds are moving into other parts of the world. Especially to Europe. More specifically, the eurozone. The reason is simple. U.S. stocks are...
READ MORE
MEMBERS ONLY

Some Markets And Key Ratios Are At The Brink, But At The Brink Of What?
by Martin Pring,
President, Pring Research
* Bond yields sending a deflationary message
* Intermarket signals from equities are close to deflationary signals
* So are similar measures for bonds
* More on confidence relationships
Wednesday’s close saw a lot of key ratios and some markets resting on key trendlines and moving averages. Since these benchmarks represent potential support,...
READ MORE
MEMBERS ONLY

ENERGY SHARES LEAD MARKET LOWER AS CRUDE OIL DROPS TO TWO-WEEK LOW -- TWO ENERGY ETFS FALL TO NEW 2017 LOW -- DOW INDUSTRIALS CLOSE AT TWO-MONTH LOW -- S&P 500 REMAINS ON THE DEFENSIVE -- ON BALANCE VOLUME LOOKS WEAK
by John Murphy,
Chief Technical Analyst, StockCharts.com
CLIMB IN GASOLINE SUPPLIES HURTS CRUDE... A surprising jump in gasoline supplies caused heavy selling in the price of crude oil and gasoline. Chart 1 shows the United States Oil Fund (USO) falling nearly 4% today to the lowest level in two weeks. The USO also fell back below its...
READ MORE
MEMBERS ONLY

Bull Market Correction Looks Likely To Continue
by Martin Pring,
President, Pring Research
* Recent technical deterioration
* Bonds and the recent false upside breakout
* Gold’s false breakout also turned out to be “false”
The long-term indicators for the equity market continue to look positive, as the major averages are comfortably above their key moving averages. Pretty well all measures of long-term smoothed momentum...
READ MORE
MEMBERS ONLY

BOND YIELD FALLS TO FIVE MONTH LOW -- RELATIVE WEAKNESS IN HIGH YIELD BONDS IS BAD FOR STOCKS -- FINANCIALS AND SMALL CAPS LEAD MARKET LOWER -- S&P 500 CLOSES BELOW 50-DAY AVERAGE -- SAFE HAVEN BUYING PUSHES GOLD TO FIVE MONTH HIGH
by John Murphy,
Chief Technical Analyst, StockCharts.com
10-YEAR TREASURY YIELD FALLS TO FIVE-MONTH LOW... Bond yields have been slipping since March as investors have had second thoughts about the so-called Trump bump in stocks and the economy. Geopolitical concerns may also be causing profit-taking in stocks and buying of safe havens like bonds and gold. That risk-off...
READ MORE
MEMBERS ONLY

DOW AND S&P 500 ARE THREATENING THEIR 50-DAY AVERAGES -- TECHNOLGY SELLING WEAKENS THE NASDAQ -- FINANCIALS AND TRANPORTS CONTINUE TO UNDERPERFORM -- VIX HITS FIVE-MONTH HIGH
by John Murphy,
Chief Technical Analyst, StockCharts.com
DOW AND S&P 500 MAY BE SLIPPING BELOW 50-DAY LINES... The short-term trend for the market continues to weaken. Chart 1 shows the Dow Jones Industrial SPDR (DIA) trading below its 50-day average in early afternoon trading. The DIA hasn't closed below that support line since...
READ MORE
MEMBERS ONLY

Friday's Trading Action Offers More False Signals
by Martin Pring,
President, Pring Research
1. False moves in the precious metal pits
2. Outside day in silver tips the near-term balance to the bears
3. More false breaks in the bond pits
Late last week I wrote that several markets had recently experienced false moves, known as whipsaws. It seems that Friday saw this...
READ MORE
MEMBERS ONLY

STOCK INDEXES STAY ABOVE 50-DAY AVERAGES AFTER MISSILE ATTACK -- SMALL CAPS AND FINANCIALS NEED TO DO BETTER -- BOND YIELDS BOUNCE OFF BOTTOM OF 2017 TRADING RANGE -- DOLLAR RALLIES AS SAFE HAVEN YEN WEAKENS -- GOLD STRUGGLES AT 200-DAY AVERAGE
by John Murphy,
Chief Technical Analyst, StockCharts.com
MAJOR STOCK INDEXES HOLD 50-DAY LINES ... Entering today's trading, stocks were relatively flat on the week. Bond prices, however, were nearing the top of their 2017 trading range. Other safe haven assets like gold and the yen have been bouncing as well. Yesterday's missile attack on...
READ MORE
MEMBERS ONLY

Markets Have Experienced A Lot Of Fake Breakouts Recently
by Martin Pring,
President, Pring Research
* A few words on false moves
* US market experiences false upside breakout this week
* Whipsaws in the sectors
* European currency whipsaws
A few words on false moves
Prices in financial markets are driven principally by psychology. They effectively reflect people in action. The problem is, that people can and do...
READ MORE