MEMBERS ONLY

STRONG JOBS REPORT PUSHES RATES SHARPLY HIGHER -- THAT HELPS BANKS, BROKERS, AND INSURERS -- BUT HURTS UTILITIES -- RISING DOLLAR PUSHES GOLD AND OTHER COMMODITIES LOWER -- EMERGING MARKETS SLIP ON RISING DOLLAR AND PROSPECTS FOR HIGHER BOND YIELDS

by John Murphy,
Chief Technical Analyst, StockCharts.com
SURPRISINGLY STRONG JOBS REPORT... Today's surprisingly strong jobs report took markets by surprise, but is having predictable intermaket results. First, it pushed Treasury yields sharply higher. That's based on the belief that the strong report increases the odds for a Fed rate hike in December. Chart...
READ MORE
MEMBERS ONLY

November Should Tell Us Whether US Equities Are In A Bull Or Bear Market

by Martin Pring,
President, Pring Research
Market pullback likely in November
* Rates rising across the yield maturity spectrum
* Dollar Index close to an upside breakout
* Commodities look weaker
The short-term condition of the market is very overstretched, to say the least. Even if we are still in a bull market some form of November correction appears...
READ MORE
MEMBERS ONLY

YIELDS RISE ON YELLEN OPTIMISM -- THAT PUSHED DOLLAR HIGHER AND GOLD AND OTHER COMMODITIES LOWER -- OVERBOUGHT STOCKS ARE TESTING OLD HIGHS AND MAY NEED A BREATHER -- FOREIGN STOCKS ALSO EXPERIENCE SELLING NEAR RESISTANCE LINES
by John Murphy,
Chief Technical Analyst, StockCharts.com
YELLEN PUSHES YIELDS HIGHER... Janet Yellen sounded a hawkish tone again today about the possibility of a December rate hike. That pushed U.S. rates higher. Chart 1 shows the 10-Year Treasury Note Yield climbing to the highest level in two months. Shorter-term rates climbed even more. That caused selling...
READ MORE
MEMBERS ONLY

STOCKS HAVE STRONGEST OCTOBER IN FOUR YEARS -- S&P 500 ENDS NEAR TWO-MONTH HIGH BUT LOOKS OVER-EXTENDED -- EQUAL WEIGHT STOCK ETFS NEED TO CATCH UP -- JANUARY EFFECT SHOULD BOOST SMALL CAPS -- WEEKLY MACD LINES TURN POSITIVE
by John Murphy,
Chief Technical Analyst, StockCharts.com
HALLOWEEN INDICATOR ... Stocks had the best October since 2011. That bodes well for the rest of the fourth quarter and the next six months. The three months between November and January are traditionally the best three months of the year. As is the six-month period between November and April. As...
READ MORE
MEMBERS ONLY

Upside Breakout In The Dollar Index May Be Close At Hand
by Martin Pring,
President, Pring Research
* Market breadth on the rally not so hot
* Credit spreads are a likely bell weather for equities
* Dollar Index reaches critical resistance
The power of the recent rally has been a surprise to most observers including myself. The big question is whether it is part of a topping out process,...
READ MORE
MEMBERS ONLY

FED'S HAWKISH TONE BOOSTS BOND YIELDS -- THAT HELPS BANKS AND INSURERS, BUT HURTS UTILITIES -- DOLLAR RALLY HURTS GOLD -- ENERGY STOCKS REBOUND WITH CRUDE OIL -- S&P 500 HITS TWO-MONTH HIGH -- SMALL CAPS ACHIEVE BULLISH BREAKOUT
by John Murphy,
Chief Technical Analyst, StockCharts.com
BOND YIELDS RISE ... Today's Fed statement had a slightly more hawkish tone than markets were expecting, and left the door open for a possible December rate hike. After a brief dip, stocks ended strong. Financials bounced sharply on the Fed statement, while rate-sensitive utilities sold off. A bounce...
READ MORE
MEMBERS ONLY

INDUSTRIALS LEAD STRONG STOCK RALLY -- INDUSTRIAL SPDR CLEARS 200-DAY AVERAGE -- BIG MOVES SEEN IN BOEING, MMM, SOUTHWEST AIRLINES, AND RAYTHEON -- SEMICONDUCTORS LEAD TECHNOLOGY HIGHER -- PLUNGING EURO BOOSTS EUROZONE STOCKS
by John Murphy,
Chief Technical Analyst, StockCharts.com
INDUSTRIAL SPDR TURNS UP ... Throughout the summer, I expressed concern about the weak performance in the economically-sensitive industrial sector. That situation has taken a dramatic turn for the better. Chart 1 shows the Industrials SPDR (XLI) leaping 3% today and trading above its 200-day average. The XLI has also broken...
READ MORE
MEMBERS ONLY

HOMEBUILDERS RISE ON GOOD NEWS -- FALLING BOND YIELDS PUSH REITS TO SIX MONTH HIGH -- NYSE ADVANCE-DECLINE LINE CLEARS 200-DAY AVERAGE -- NASDAQ TESTS 200-DAY LINE -- INTEL AND MICROSOFT SHOW TECHNOLOGY LEADERSHIP -- APPLE MAY BE TURNING UP
by John Murphy,
Chief Technical Analyst, StockCharts.com
HOMEBUILDERS BUILD ON GOOD NEWS... Yesterday's announcement that homebuilding sentiment had jumped to a ten-year high was followed by today's report that September housing starts had the second biggest jump in eight years. Not surprisingly, homebuilders are having a strong day. The daily bars in Chart...
READ MORE
MEMBERS ONLY

Lots Of Markets Are At Crucial Juncture Points
by Martin Pring,
President, Pring Research
* US Equities remain short-term overbought
* Yield curves starting to steepen (decline)
* All bond maturities are at critical trendlines
* Dollar about to break down?
* Gold about to break out?
US Equities
Earlier in the week I indicated that several short-term indicators such as the Price Percentage Oscillator(PPO) using an 8/...
READ MORE
MEMBERS ONLY

FINANCIALS LEAD MARKET HIGHER -- BANK OF AMERICA, CITIGROUP, AND GOLDMAN SACHS LEAD -- EMERGING MARKETS LEAD FOREIGN STOCKS HIGHER -- S&P 500 CLOSES AT TWO-MONTH HIGH AS NASDAQ CLOSES ABOVE 50-DAY LINE -- VIX FALLS 10% TO TWO-MONTH LOW
by John Murphy,
Chief Technical Analyst, StockCharts.com
BANK STOCKS HAVE STRONG DAY ... Financial stocks led a strong day in stocks. Several big bank stocks had big chart days. The daily bars in Chart 1 show Bank of America (BAC) surging more than 3% in heavy trading. It's also testing its 50- and 200-day moving averages....
READ MORE
MEMBERS ONLY

DOLLARS WEAKENS AS TWO-YEAR TREASURY YIELD FALLS TO THREE MONTH LOW -- THAT COMBINATION IS PUSHING PRECIOUS METALS HIGHER -- GOLD HAS RETRACED 50% OF ITS PREVIOUS BULL MARKET WHICH PUTS IT IN A POTENTIAL SUPPORT ZONE
by John Murphy,
Chief Technical Analyst, StockCharts.com
DOLLAR FALLS WITH U.S. RATES... U.S. interest rates have been dropping on reduced expectations for a Fed rate hike this year. Chart 1 shows the 2-Year Treasury Yield falling yesterday to the lowest level in three months. That's important because that shorter term yield is more...
READ MORE
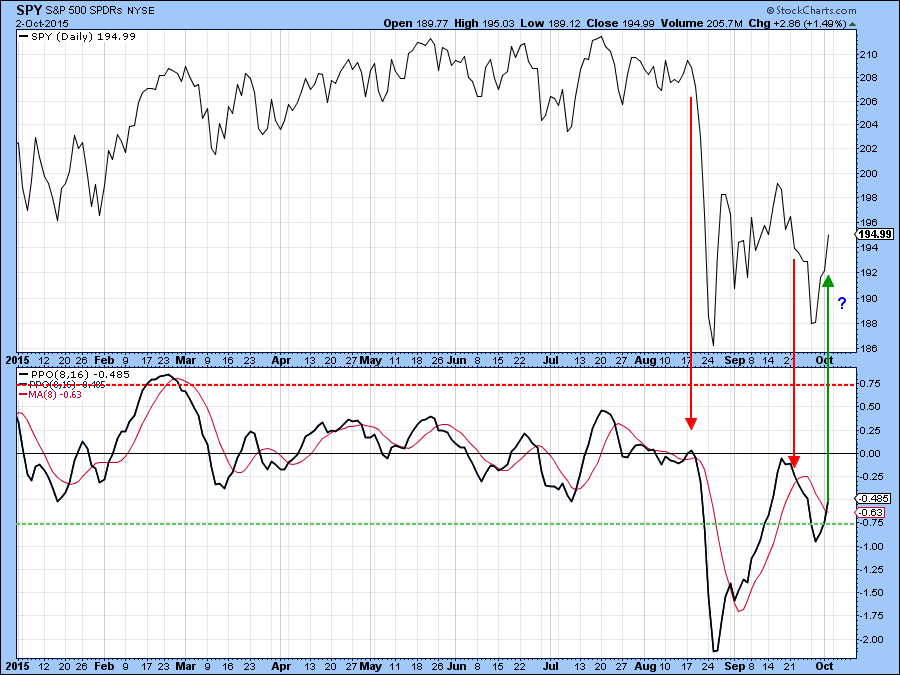
MEMBERS ONLY

Is it Time for a Digestion of Recent Equity Gains?
by Martin Pring,
President, Pring Research
* The 8/16 PPO for the SPX is overbought
* Nasdaq is running into major resistance
* The HYG experiences a false upside breakout and a bearish shooting star
The week before last, I drew your attention to the fact that since the August sell-off recent market gyrations had been truncated in...
READ MORE
MEMBERS ONLY

BREADTH INDICATORS TURN UP -- DOLLAR WEAKNESS SHOULD START TO HELP EARNINGS -- SO SHOULD A REBOUND IN ENERGY AND MATERIALS -- AND A REBOUND IN EMERGING MARKETS -- UPTURN IN EM CURRENCIES SUPPORTS EM STOCK ADVANCE
by John Murphy,
Chief Technical Analyst, StockCharts.com
PERCENT OF STOCKS ABOVE MOVING AVERAGE LINES TURNS UP ... Breadth indicators continue to show marked improvement. My Wednesday message showed the percent of NYSE stocks above their 50-day average turning up. I stated that it needed to climb above 50% to turn its trend higher. The blue line in Chart...
READ MORE
MEMBERS ONLY

Is The Dollar Likely To Make A Big Move Soon?
by Martin Pring,
President, Pring Research
* The primary trend in the dollar is still bullish but..
* Broad momentum measures of the dollar are negative
* Euro is caught between two possible scenarios
The US Dollar Index ($USD) has been in a trading range for several months and may be about to break out, but which way? The...
READ MORE
MEMBERS ONLY

SIGNS OF COMMODITY BOTTOM ARE GOOD FOR GLOBAL STOCKS -- OVERSOLD ENERGY SECTOR REBOUNDS -- FREEPORT MCMORAN LEADS COPPER RALLY -- SILVER ALSO TURNS UP -- PERCENT OF NYSE STOCKS ABOVE 5O-DAY AVERAGE IMPROVES -- HIGH YIELD BOND ETF BOUNCES OFF CHART SUPPORT
by John Murphy,
Chief Technical Analyst, StockCharts.com
ENERGY SECTOR MAY BE BOTTOMING... Global stocks continue to bounce off important support levels. One of the supporting factors is new strength in commodity-related energy and material stocks. I've written previous messages on new signs of strength in commodity markets -- especially copper and energy. My August 27...
READ MORE
MEMBERS ONLY

GLOBAL STOCKS START WEEK ON A STRONG NOTE -- IMPORTANT SUPPORT LEVELS FOR EMERGING AND DEVELOPED FOREIGN MARKETS CONTINUE TO HOLD -- SAME IS TRUE FOR U.S. STOCK INDEXES WHICH ARE UP SHARPLY -- STOCK INDEXES APPROACH TEST OF 50-DAY LINES
by John Murphy,
Chief Technical Analyst, StockCharts.com
EMERGING MARKETS LEAD GLOBAL RALLY ... Stocks around the world are continuing the rally that began Friday after the very weak U.S. jobs report. Part of the reason for the renewed optimism may be the belief that the weak job report took a Fed rate hike off the table for...
READ MORE
MEMBERS ONLY
US Stock Market Successfully Tests its August 24 Low
by Martin Pring,
President, Pring Research
* 8/16 PPO triggers a buy signal for the S&P Composite
* Resource-based stocks showing signs of improving relative action
* Bonds experience an exhaustion day
Earlier in the week I noted that the market was getting pretty close to the August lows but that the indicator that I usually...
READ MORE
MEMBERS ONLY

BOND YIELDS PLUNGE ON WEAK JOBS REPORT -- BANKS, BROKERS, AND INSURERS LEAD FINANCIALS LOWER -- WEAKER DOLLAR HELPS BOOST GOLD AND GOLD MINERS -- STOCK INDEXES CONTINUE TO TEST SUPPORT LEVELS
by John Murphy,
Chief Technical Analyst, StockCharts.com
BOND YIELD PLUNGES... This morning's dismal jobs report pushed Treasury prices sharply higher and bond yields lower. Chart 1 shows the 10-Year Treasury Note Yield plunging to the lowest level since August. Treasury bond prices saw the biggest gains, while investment grade corporate bonds also bounced. High yield...
READ MORE
MEMBERS ONLY
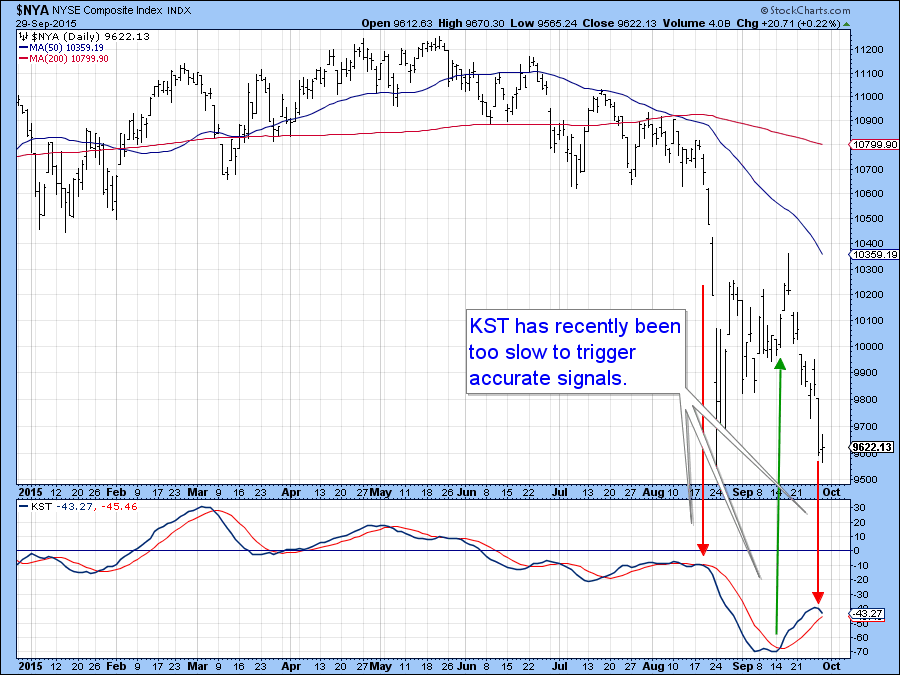
Bond Market Quality Spreads Are Signaling More Trouble Ahead
by Martin Pring,
President, Pring Research
* Test of the August 24 intraday lows is at hand
* Junk bonds complete 3-year top
* Credit spread may be leading the Dollar Index higher
* The yields on short-term treasury maturities may be peaking
Testing the lows
Normally I like to use the KST to determine when momentum has reversed direction....
READ MORE
MEMBERS ONLY

BOND INVESTORS PLAY DEFENSE -- INVESTMENT GRADE CORPORATES UNDERPERFORM TREASURIES -- HIGH YIELD BONDS ARE EVEN WEAKER -- ENERGY SECTOR WEIGHS ON HIGH YIELD ETF -- NYSE BULLISH PERCENT INDEX STILL IN A DOWNTREND -- THE VIX STILL BOUNCING
by John Murphy,
Chief Technical Analyst, StockCharts.com
BOND ALIGNMENT SHOWS CAUTION ... Money has been flowing into the relative safety of bonds as stocks prices have slid. That money hasn't been flowing equally into all bond categories however. Most of the money has been flowing into Treasury bonds which are the safest of all. Investment Grade...
READ MORE
MEMBERS ONLY

BIOTECH DIVE PULLS NASDAQ AND HEALTHCARE SECTOR LOWER -- BIG PHARMA ALSO WEAKENS -- RUSSELL 2000 SMALL CAP INDEX MAY BE THE FIRST TO TEST ITS AUGUST LOW -- THAT WILL BE AN IMPORTANT TEST FOR IT AND THE REST OF THE MARKET
by John Murphy,
Chief Technical Analyst, StockCharts.com
BIOTECHS CONTINUE TO TUMBLE... Biotechs have gone from market helpers to market hurters. The daily bars in Chart 1 show Biotech iShares (IBB) falling to the lowest level since August, and the lowest closing price in more than six months (in very heavy trading). The IBB lost 13% on the...
READ MORE
MEMBERS ONLY

Which Sectors, If Any, Are Poised To Lead The Market Higher?
by Martin Pring,
President, Pring Research
It’s no secret that I have been bearish on the equity market for some time. Nevertheless, it's always a good idea to remain flexible and look at all angles, so at Tuesday's webinar Greg asked me a great question. What would need to happen to...
READ MORE
MEMBERS ONLY

STOCKS RETREAT TOWARD SUMMER LOWS -- TREASURY BOND PRICES GAIN -- HIGH YIELD BONDS FALL WITH STOCKS -- DOLLAR DROP PUSHES SOME MONEY INTO GOLD -- VIX STAYS ABOVE CHART SUPPORT -- AUTOS AND BIOTECHS WEAKEN
by John Murphy,
Chief Technical Analyst, StockCharts.com
AUTOS AND BIOTECHS WEAKEN ... Two groups that had recently held up better than others have experienced heavy selling this week. Chart 1 shows the Dow Jones Automobile Index falling back below its 50-day line. Its relative strength line (top of chart) has started to weaken as well. Volkswagen has lost...
READ MORE
MEMBERS ONLY

FED INACTION BOOSTS BONDS AND SAFE HAVEN ASSETS WHILE HURTING STOCKS -- WITH SHORT-TERM BOUNCE ENDING, A RETEST OF SUMMER LOW APPEARS LIKELY BETWEEN NOW AND OCTOBER -- THAT WILL HELP DETERMINE IF THIS IS A CORRECTION OR BEAR
by John Murphy,
Chief Technical Analyst, StockCharts.com
FED DECISION TO LEAVE RATES ALONE SHAKES MARKETS ... I'm not sure what the Fed said on Thursday that got everyone upset. It acknowledged weakness in foreign markets (like China) and low inflation. We already knew about plunging Chinese stocks and weak commodity prices. Even so, markets took a...
READ MORE
MEMBERS ONLY

SHORT-TERM STOCK BOUNCE HAS PROBABLY ENDED -- A RETEST OF SUMMER LOW NOW APPEARS LIKELY -- VIX BOUNCES OFF 20 SUPPORT LEVEL
by John Murphy,
Chief Technical Analyst, StockCharts.com
RETEST OF AUGUST LOWS LIKELY... The short-term bounce that started nearly a month ago appears to have run its course. That suggests that a retest of the August low is more likely. I recently applied Fibonacci retracement lines over the Dow Industrials to show where new selling might appear. Chart...
READ MORE
MEMBERS ONLY
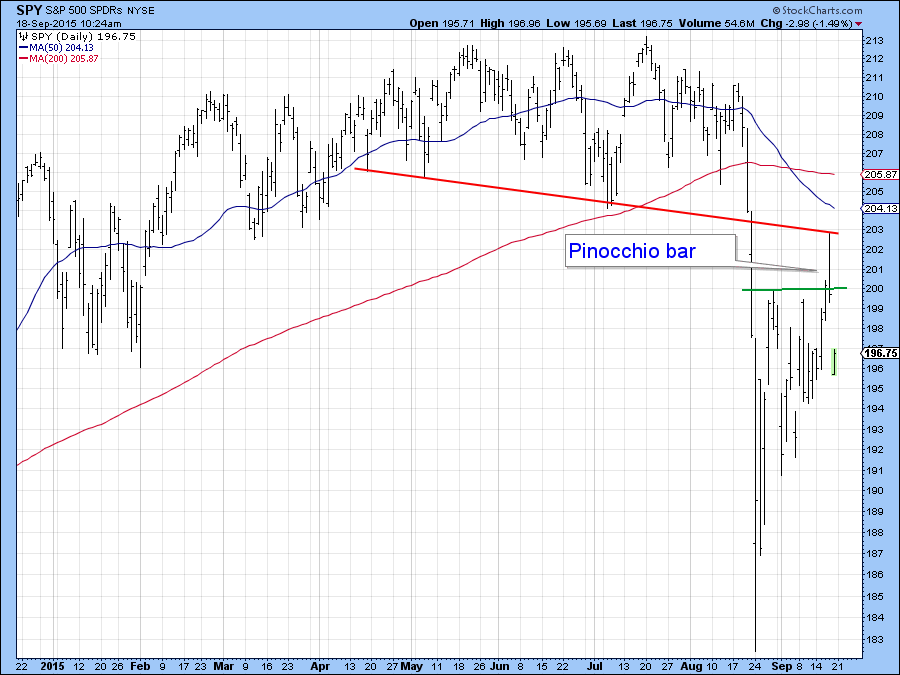
Market Loses Confidence in the Fed
by Martin Pring,
President, Pring Research
* Thursday’s action represents a bearish Pinocchio bar.
* Long-term indicators remain bearish.
* Will Friday’s trading have a silver lining?
Thursday’s Pinocchio bar
In last week’s article I pointed out that several market averages had experienced bearish engulfing patterns and that a test of the lows was likely....
READ MORE
MEMBERS ONLY

FED LEAVES RATE UNCHANGED -- BONDS RALLY ON FALLING YIELDS -- DOLLAR WEAKNESS BOOSTS GOLD -- STOCKS SUFFER DOWNSIDE REVERSAL
by John Murphy,
Chief Technical Analyst, StockCharts.com
INITIAL REACTIONS... The Fed left short-term rates unchanged today. The two main reasons given were lower inflation and weakness in foreign markets. Ms. Yellen, however, stressed in her press conference that the U.S. economy still looked solid and that a rate hike by yearend was still possible. Not surprisingly,...
READ MORE
MEMBERS ONLY

CHINA BOUNCE BOOSTS ASIAN ETFS -- ENERGY STOCKS SHOW NEW LEADERSHIP AS CRUDE OIL CLEARS 50-DAY AVERAGE -- OIL STABILITY ALSO BOOSTS EMERGING MARKETS IN MEXICO AND RUSSIA -- TESLA AND FORD LEAD AUTOS -- VIX NEARS TEST OF 20 SUPPORT
by John Murphy,
Chief Technical Analyst, StockCharts.com
CHINESE STOCKS REBOUND ... Emerging markets are getting some relief from a rebound in China. Hong Kong stocks are up 511 points (2.3%) while Shanghai gained 147 points (4.9%). Chinese ETFs are also bouncing off important support levels while in a deeply oversold condition. Chart 1 shows HongKong iShares...
READ MORE
MEMBERS ONLY

BOND YIELDS RISE AS MONEY LEAVES BONDS FOR STOCKS -- BANK SPDR IS BACK ABOVE ITS 200-DAY LINE -- ETRADE IS A FINANCIAL LEADER -- UPS HELPS PULL TRANSPORTS ABOVE 50-DAY AVERAGE -- S&P 500 CLEARS 20-DAY LINE AS MARKET BOUNCES
by John Murphy,
Chief Technical Analyst, StockCharts.com
BOND YIELDS SURGE ON CONSUMER SPENDING... Today's jump in bond yields is being attributed to gains in consumer spending. Chart 1 shows the 10-Year Treasury Note Yield ($TNX) climbing above its 50-day average to the highest level in a month. When yields rise, bond prices fall. Chart 2...
READ MORE
MEMBERS ONLY
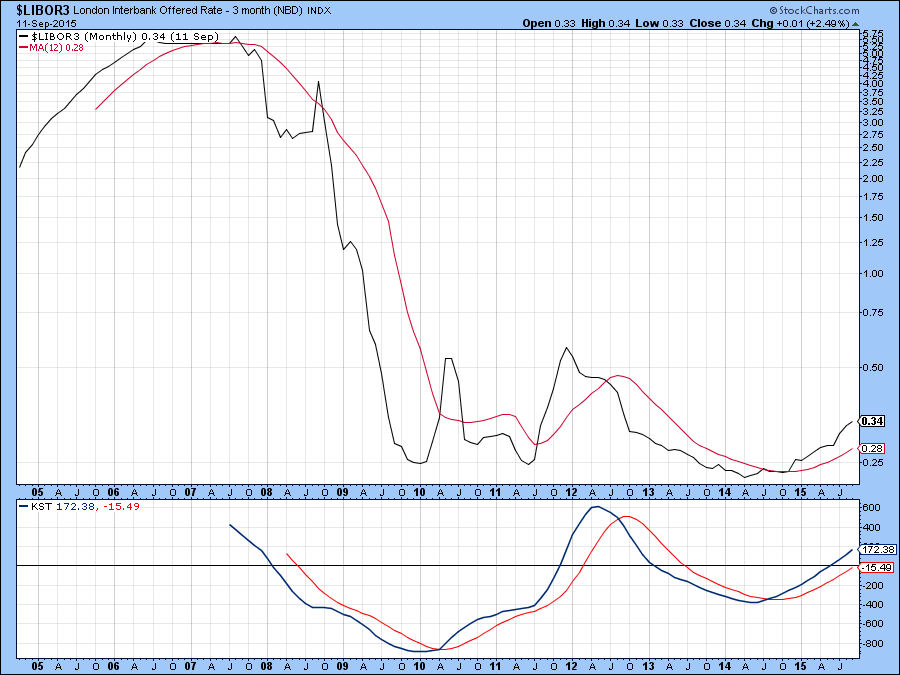
Six Reasons Why the Fed Will Not Raise Rates; One Bad Reason Why it Will
by Martin Pring,
President, Pring Research
* Consumer sentiment flags a sell signal
* Short rates rise before commodity prices do. That's not supposed to happen.
* TIPS break key support
The biggest question in financial markets this week is "will she or won't she?". The ”she” in this case is Janet Yellen...
READ MORE
MEMBERS ONLY

HOUSING GROUP CONTINUES TO LEAD -- HOMEBUILDING LEADERS INCLUDE DR HORTON, NVR, AND LENNAR -- HOUSING RELATED STOCK LEADERS INCLUDE MOHAWK, MASCO, AND HOME DEPOT -- COMPARISON OF TWO HOUSING ETFS -- MARKET AWAITS FED DECISION
by John Murphy,
Chief Technical Analyst, StockCharts.com
HOMEBUILDERS CONTINUE TO GAIN ... This is the latest of several positive messages written herein on homebuilders and housing stocks in general. Homebuilders were one of the strongest stock groups on Friday. More importantly, they're also the strongest group over the last month and the last three month periods....
READ MORE
MEMBERS ONLY

Evidence Points to Further Testing of the Lows
by Martin Pring,
President, Pring Research
* S&P engulfing pattern hints at downside pressure to come
* Guggenheim asset ratio continues to signal money outflow
* EEM give indications of a better short-term performance to come
* BOJ so far fails the inflation test
US Equities short-term
The recent wild swings in the market may look random in...
READ MORE
MEMBERS ONLY

INDIVIDUAL STOCK LEADERS SHOWING RELATIVE STRENGTH INCLUDE KLA TENCOR, FREEPORT MCMORAN, GILEAD SCIENCE, AND ASSURANT -- APPLE IS ALSO STARTING TO SHOW RELATIVE STRENGTH
by John Murphy,
Chief Technical Analyst, StockCharts.com
KLA TENCOR IS SPX LEADER... Relative strength in an individual stock during a downside correction is a positive sign. Today, I'm looking at some individual stock leaders who also happen to be in groups that are also showing relative strength. KLAC Tencor (KLAC) is the day's...
READ MORE
MEMBERS ONLY

JAPANESE STOCKS HAVE BIGGEST JUMP IN SEVEN YEARS AS YEN DROPS -- RISING BOND YIELDS HELP BANKS AND INSURERS -- BUT HURT REITS AND UTILITIES -- OVERSOLD COPPER AND COPPER STOCKS ARE BOUNCING OFF MAJOR CHART SUPPORT AND MAY BE SCRAPING BOTTOM
by John Murphy,
Chief Technical Analyst, StockCharts.com
JAPANESE STOCKS BOUNCE OFF MAJOR SUPPORT LINE... Japan was the only country that didn't participate in yesterday's global stock rally. It's making up for that today in a big way. And at a good time. I've been showing a lot of global...
READ MORE
MEMBERS ONLY

EEM ISHARES BOUNCE OFF 2011 LOW -- EAFE ISHARES ALSO HOLD SUPPORT -- OVERSOLD CANADIAN STOCKS REBOUND -- U.S. STOCKS HAVE STRONG DAY TO STAY WITHIN RECENT TRADING RANGE -- BOND YIELDS BOUNCE AS MONEY LEAVES BONDS FOR STOCKS -- VIX RETREATS ANOTHER 10%
by John Murphy,
Chief Technical Analyst, StockCharts.com
EMERGING MARKETS BOUNCE OFF CHART SUPPORT... Within the exception of Japan, global stocks are bouncing nicely today. It started in Asia with a rebound in Chinese stocks. That gave a much needed boost to emerging markets. And it may be coming just in time. The monthly bars in Chart 1...
READ MORE
MEMBERS ONLY

BANKS AND SEMICONDUCTORS BOUNCE OFF MAJOR SUPPORT LEVELS -- LONGER RANGE CHARTS SUGGEST CURRENT PULLBACK IS A CORRECTION IN A LONGER RANGE UPTREND -- HOMEBUILDERS SHOW RELATIVE STRENGTH -- DR HORTON IS HOMEBUILDING AND MARKET LEADER
by John Murphy,
Chief Technical Analyst, StockCharts.com
BANKS BOUNCE OFF CHART SUPPORT... I've explained in previous messages that I lean toward the view that the stock market is in the midst of an overdue correction. It's been four years since the market saw a correction of more than 10%. That's much...
READ MORE
MEMBERS ONLY

WHAT'S THE DIFFERENCE BETWEEN A CORRECTION AND A BEAR MARKET? -- LONG-TERM SUPPORT LEVELS FOR S&P 500 -- STOCKS REMAIN IN TRADING RANGE WHICH IS LIKELY TO CONTINUE -- VIX RETREATS
by John Murphy,
Chief Technical Analyst, StockCharts.com
WHAT'S THE DIFFERENCE? ... There's a debate in professional circles as to whether the stock market is in a correction or a bear market. It makes a difference. Let's define what they are. A stock market "correction" is a drop of more than...
READ MORE
MEMBERS ONLY
Long-term Indicators Signal A Primary Bear Market But Last Monday's Panic Low Ought To Hold For A While
by Martin Pring,
President, Pring Research
* Right shoulder rally is a work in progress.
* Dollar Index showing some technical cracks.
* Gold breaks out against stocks.
Last week I pointed out that the S&P 500 ($SPX), along with several other averages, had experienced a bullish exhaustion day. That fact, along with an excessively high reading...
READ MORE
MEMBERS ONLY

S&P 500 STALLS BELOW BREAK, SMALL-CAPS SHOW RELATIVE STRENGTH, UTILITIES SPDR BREAKS DOWN, TREASURY BONDS FORMS BIG ENGULFING, 10-YR YIELD BOUNCES WITHIN DOWNSWING, GOLD AND SILVER BACK OFF BROKEN SUPPORT ZONES
by John Murphy,
Chief Technical Analyst, StockCharts.com
S&P 500 STALLS WELL BELOW SUPPORT BREAK... Chart 1 shows the S&P 500 with a big support break at 2040 and some serious volatility over the last two weeks. Notice that the index fell over 10% and then bounced with a 5+ percent surge back to...
READ MORE
MEMBERS ONLY

3 STRIKES AND A TREND CHANGE, S&P 500 FORMS BIG HAMMER, JUNK BONDS UNDERPERFORM INVESTMENT BONDS, STOCKS UNDERPERFORM BONDS, AVERAGE STOCKS UNDERPERFORMS LARGE CAP STOCKS, THE DAMAGE IS NOT UNDONE, MID-CAP AND SMALL-CAP AD LINES HIT NEW LOWS
by John Murphy,
Chief Technical Analyst, StockCharts.com
3 STRIKES AND A TREND CHANGE... Link for today's video. There has certainly been a lot of noise the last two weeks and this makes it a good time to look at some weekly charts for a little perspective. We will start with the S&P 500...
READ MORE