MEMBERS ONLY

CHINA AND INDIA ARE EMERGING MARKET WINNERS -- FALLING OIL HURTS BRAZIL AND RUSSIA -- SHANGHAI STOCKS END YEAR AT THREE YEAR HIGH -- NEW ETFS OFFER EXPOSURE TO SHANGHAI A-SHARES, BUT MAY NOT BE LIQUID ENOUGH

by John Murphy,
Chief Technical Analyst, StockCharts.com
BRIC DIVERGENCE... The year 2014 saw very diverging trends among the world's largest emerging market stocks. The lines in Chart 1 show those diverging trends among the four BRIC countries that are Brazil, Russia, India, and China. I'm using exchange traded funds here because they take...
READ MORE
MEMBERS ONLY

BROADCASTING AND ENTERTAINMENT INDEX HITS NEW HIGH -- MEDIA ETF BREAKS FROM MASSIVE WEDGE -- CARNIVAL AND ROYAL CARIBBEAN LIFT PEJ TO NEW HIGH -- IS CBS COMING OUT OF A BIG CORRECTION? -- BBT GETS BACK IN SYNC WITH SPY -- FITB FORMS BIG REVERSAL PATTERN
by John Murphy,
Chief Technical Analyst, StockCharts.com
BROADCASTING AND ENTERTAINMENT INDEX HITS NEW HIGH... Link for today's video. Chart 1 shows the DJ US Broadcasting and Entertainment Index ($DJUSBC) in the main window and the S&P 500 in the indicator window. Instead of using the price relative ($DJUSBC:$SPX ratio) to compare performance,...
READ MORE
MEMBERS ONLY

IWM AND IJR SCORE NEW HIGHS -- FINANCIALS LEAD SMALL-CAPS HIGHER -- SMALL AND MID CAP AD LINES LEAD -- SECTOR AD LINES SHOW BROAD STRENGTH -- UTILITIES AND FINANCE LEAD HIGH-LOW RANKING
by John Murphy,
Chief Technical Analyst, StockCharts.com
IWM AND IJR SCORE NEW HIGHS... Link for today's video. Barring a big plunge the next few days, small-caps are going out with a bang this year. Small-caps lagged the broader market throughout 2014 because the Russell 2000 iShares (IWM) and the S&P SmallCap iShares (IJR)...
READ MORE
MEMBERS ONLY
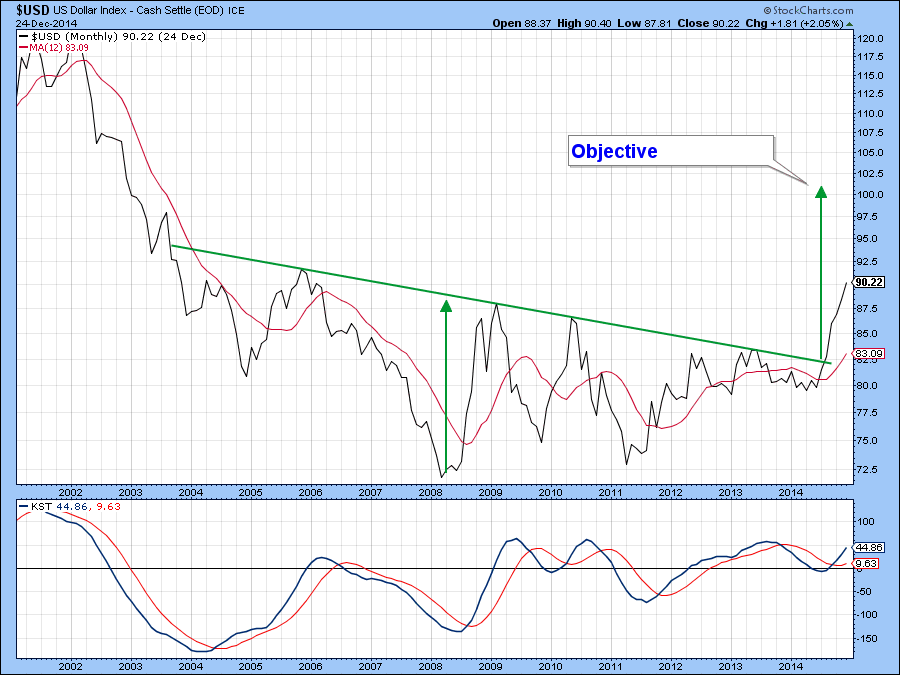
End Of The Year Dollar Index Review

by Martin Pring,
President, Pring Research
* Long-term dollar rally likely to continue.
* Yuan on the edge of a breakdown.
* January is tied with November as the most bullish month for the dollar.
* Short-term dollar momentum overstretched but re-accelerating to the upside.
Currencies
At the end of August the US Dollar Index ($USD) broke out from a...
READ MORE
MEMBERS ONLY

SOME NEW AND CONTINUING THEMES FOR 2015 -- SHORT-TERM T-YIELDS RISE AND HALF NORMALIZE -- EURO MOVES CLOSER TO PARITY -- SMALL-CAPS LEAD THE MARKET -- XLF AND IAI TARGET 2007 HIGH -- XLE CONFIRMS LARGE REVERSAL PATTERN
by John Murphy,
Chief Technical Analyst, StockCharts.com
SOME NEW AND CONTINUING THEMES FOR 2015... Today's Webinar will look at long-term charts to extrapolate some themes to consider in 2015. This written commentary shows most of the Webinar charts with some brief notes. Tune into the Webinar for full details. Every so often we get a...
READ MORE
MEMBERS ONLY

S&P MIDCAP INDEX FORMS BIG CONTINUATION PATTERN -- EQUAL-WEIGHT STARTS OUTPERFORMING CAP-WEIGHT -- SMALL-CAP FINANCE AND TECH SECTORS HIT NEW HIGHS -- SEMICONDUCTOR SPDR EXTENDS STRONG UPTREND -- CAVIUM AND RF MICRO LEAD SEMIS
by John Murphy,
Chief Technical Analyst, StockCharts.com
S&P MIDCAP INDEX FORMS BIG CONTINUATION PATTERN... Link for today's video. Chart 1 shows the S&P MidCap 400 hitting a new high at the beginning of July and then forming a large consolidation the last six months. Actually, the index hit another all time...
READ MORE
MEMBERS ONLY

ENERGY SHARES LEAD U.S. STOCKS HIGHER -- SMALL CAPS BREAKOUT -- FOREIGN STOCKS ALSO BOUNCE ON FIRMER CRUDE PRICE -- SO DO HIGH YIELD BONDS -- OIL SERVICE STOCKS BOUNCE FROM DEEP OVERSOLD CONDITION AND MAJOR SUPPORT
by John Murphy,
Chief Technical Analyst, StockCharts.com
US STOCKS END WEEK ON A STRONG NOTE... A combination of factors pushed U.S. (and global) stocks sharply higher during the second half of the week. One big factor was the Wednesday Fed statement that it would be "patient" in raising rates next year. Another was a...
READ MORE
MEMBERS ONLY

MICRO-CAPS TAKE THE LEAD ON RELATIVE ROTATION GRAPH -- MICROCAP ETF BREAKS BIG CHANNEL -- HIGH-LOW PERCENT INDICATORS WHIP BACK TO BULLISH -- MINDING THE GAPS -- UTILITY ETFS BREAK OUT ACROSS THE BOARD -- SYMBOLS FOR SECTOR ETFS
by John Murphy,
Chief Technical Analyst, StockCharts.com
MICRO-CAPS TAKE THE LEAD ON RELATIVE ROTATION GRAPH ... Link for today's video. Small-caps, mid-caps and micro-caps are starting to show some relative strength. John Murphy noted that the January effect was boosting small-caps as the Russell 2000 started outperforming the Russell 1000 recently. We can also see an...
READ MORE
MEMBERS ONLY

TRADERS ARE BUYING IN ANTICIPATION OF YEAREND SANTA CLAUS RALLY -- JANUARY EFFECT STARTS BOOSTING SMALL CAPS IN MID-DECEMBER -- WE'RE NOW IN THE SWEET SPOT OF THE MIDTERM ELECTION CYCLE -- AND FOREIGN STOCKS ARE REBOUNDING
by John Murphy,
Chief Technical Analyst, StockCharts.com
SANTA CLAUS RALLY IS STILL AHEAD ... The stock market is benefiting from a number of seasonal trends which should last well into the new year. For one thing, the month of November starts the "best three months" span that lasts into January, and the "best six months&...
READ MORE
MEMBERS ONLY

MARKET LIKES FED INTENTION TO STAY PATIENT -- OVERSOLD ENERGY STOCKS LEAD GLOBAL STOCK RALLY -- XLE IS ALSO IN POTENTIAL SUPPORT ZONE-- US STOCK INDEXES REGAIN 50-DAY LINE -- CANADIAN STOCKS BOUNCE SHARPLY OFF OCTOBER LOW
by John Murphy,
Chief Technical Analyst, StockCharts.com
STOCKS AND BOND YIELDS JUMP... The Fed promised to remain "patient" in raising rates next year. Stocks liked the news, Treasuries didn't. Fixed income yields rose with the bigger gains in the shorter end of the yield curve. Chart 1 shows the 5-Year T-Note Yield ($FVX)...
READ MORE
MEMBERS ONLY
Equities still Look Vulnerable Notwithstanding a Possible Reflexive Bounce
by Martin Pring,
President, Pring Research
* Dichotomy in the credit markets is extending.
* Dim Sum bonds at a critical juncture.
* Gold asset markets weakening again.
US Equities
Statistics tell us that December is the most bullish month of the year for equities. Interestingly, the November-January period offers the best performing consecutive months of the year (S&...
READ MORE
MEMBERS ONLY

WEBINAR CHARTS -- RISK ON OR RISK OFF? -- PUTTING A 5% DECLINE INTO PERSPECTIVE -- HIGH-LOW PERCENT INDICATORS REMAIN BULLISH -- HIGH-LOW PERCENT FOR XLI TURNS BEARISH -- SHORT-TERM BREADTH REMAINS BEARISH -- GOLD, OIL, DOLLAR AND BONDS
by John Murphy,
Chief Technical Analyst, StockCharts.com
WEBINAR CHARTS... The charts below are from Tuesday's Webinar and include some basic commentary. See the webinar recording for more details. I also covered eleven stocks (AAPL, ORCL, CSCO, BAC, UTX, EOG, CIEN, JSDU, UPS, CHRW, JBHT). There was a demo showing the different ways to measure relative...
READ MORE
MEMBERS ONLY

RETAIL ETF'S CONTINUE TO LEAD -- APPAREL AND SPECIALTY GROUPS SHOW RELATIVE STRENGTH -- SECTOR SUMMARY DEMO -- RS LINES HIT NEW HIGHS FOR BBBY, DSW AND PLCE -- RESTAURANT INDEX PULLS BACK AFTER NEW HIGH -- TXRH AND BWLD LEAD RESTAURANT GROUP
by John Murphy,
Chief Technical Analyst, StockCharts.com
RETAIL ETF'S CONTINUE TO LEAD ... Link for today's video. John Murphy pointed out the negative correlation between retail stocks and the price of oil in early December. In short, retail stocks rose sharply as the price of oil fell sharply. This theme continues to play out...
READ MORE
MEMBERS ONLY

OIL PLUNGES BELOW $60 ON FORECAST FOR LOWER DEMAND -- OIL EXPORTERS CONTINUE TO LEAD GLOBAL STOCK DECLINE -- RUSSIAN WEAKNESS HURTS EUROPE -- LATIN AMERICA LEADS EMERGING MARKETS ISHARES TO NEW LOWS
by John Murphy,
Chief Technical Analyst, StockCharts.com
IEA CUTS OIL DEMAND FORECAST AGAIN... Crude oil can't catch a break. Plunging oil prices over the past few months have been attributed mainly to increasing supplies, largely resulting in the shale revolution in the U.S. This week, however, the International Energy Agency (IEA) cut its forecast...
READ MORE
MEMBERS ONLY

USING BREADTH INDICATORS FOR SHORT-TERM SIGNALS -- QQQ CORRECTION TARGET -- AROONS GO PARALLEL ON IWM CHART -- BOND MARKET SHOWS RISK AVERSION -- MATERIALS SECTOR BREAKS DOWN -- GOLD MINERS ETF STALLS AFTER BOUNCE
by John Murphy,
Chief Technical Analyst, StockCharts.com
USING BREADTH INDICATORS FOR SHORT-TERM SIGNALS... Link for today's video. The economic news has been pretty good lately, but stocks came under selling pressure and did not act very well. First, I should note that I am not that interested in the news per se. Instead, I am...
READ MORE
MEMBERS ONLY

Two Benchmarks that will Likely Signal the Direction of the Next Major Equity Move
by Martin Pring,
President, Pring Research
* Stocks likely to resume their downtrend vis a vis bonds.
* Emerging Markets ETF resting on a key trend line.
* Different bond maturities moving in different directions.
US Equities
The battle lines are being drawn for the next major move in the equity market. For the NYSE Composite ($NYA) those lines...
READ MORE
MEMBERS ONLY

CANADA TUMBLES ON FALLING OIL ALONG WITH MEXICO -- EMERGING MARKETS ISHARES HIT NINE-MONTH LOW -- ENERGY SECTOR TUMBLES AGAIN -- ENERGY SELLING HERE AND ABROAD SPILLS OVER TO BROADER MARKET -- S&P 500 SUFFERS SHORT-TERM DOWNTURN--
by John Murphy,
Chief Technical Analyst, StockCharts.com
FOREIGNS SHARES ARE FALLING ... Foreign shares are falling today, especially those that export oil. Chart 1 shows the Toronto $TSX Composite Index tumbling nearly -2.4% and nearing a test of its October low. The Canada/SPX ratio (solid line) is falling even faster. Emerging markets tied to oil are...
READ MORE
MEMBERS ONLY

SMALL-CAPS SURGE TO KEEP THE FLAG ALIVE -- S&P 500 AND NASDAQ 100 LEAD HIGH-LOW INDICATORS -- HINDENBURG OMEN TRIGGERS -- FINANCE, HEALTHCARE AND UTILITIES LEAD SECTOR HIGH-LOW PERCENT -- THREE KEY INDUSTRY GROUP ETFS MAKING NEW HIGHS
by John Murphy,
Chief Technical Analyst, StockCharts.com
SMALL-CAPS SURGE TO KEEP THE FLAG ALIVE... Link for today's Webinar video. The brief commentary and charts are from today's webinar. Chart 1 shows the S&P 500 bouncing off its first support zone today. Chart 2 shows the S&P MidCap 400 consolidating...
READ MORE
MEMBERS ONLY

IWM AND IJR FLY THE FLAG AT HALF MAST -- SMALL-CAP SECTORS TAKE THE LEAD -- SMALLCAP FINANCIALS ETF BREAKS FLAG TREND LINE -- INTERNET LEADERS AND LAGGARDS -- INTERNET ETF STALLS OUT -- FACEBOOK FORMS A BIG CONSOLIDATION
by John Murphy,
Chief Technical Analyst, StockCharts.com
IWM AND IJR FLY THE FLAG AT HALF MAST ... Programming Note: I will be doing a Webinar tomorrow at 1PM ET in place of the Market Message and video. You can register here. With a little help from financial services, the Russell 2000 iShares (IWM) had its best week since...
READ MORE
MEMBERS ONLY

Global Equity Market Roundup
by Martin Pring,
President, Pring Research
* USA still leading the way on the upside.
* Russian and Mexican ETF’s break to the downside.
* EEM components offering a mixed picture.
* The two sides of Japan.
International Equities
With the US, German, Japanese, Indian, New Zealand, Pakistani and several other markets joining the US in new all-time high...
READ MORE
MEMBERS ONLY

GERMAN DAX HITS RECORD HIGH AS EUROPE STRENGTHENS -- U.S. DOLLAR INDEX RECORDS EIGHT-YEAR HIGH -- SPREAD BETWEEN US AND GERMAN BOND YIELD WIDENS -- U.S. TWO-YEAR YIELD HITS THREE-YEAR HIGH ON STONG JOBS REPORT -- FINANCIALS SHOW MARKET LEADERSHIP
by John Murphy,
Chief Technical Analyst, StockCharts.com
GERMAN DAX CLOSES AT RECORD HIGH ... German stocks sold off Thursday after the ECB delayed further monetary easing until the first quarter. Later reports that more monetary stimulus might come as early as January helped boost European stocks which rallied sharply on Friday. Chart 1 shows the German DAX Composite...
READ MORE
MEMBERS ONLY

SECTOR WEIGHTINGS IN THE S&P 500 -- KEY SECTORS LEAD WITH STRONG BREADTH -- REGIONAL BANK SPDR GETS BIG REBOUND -- FOUR BANKS WITH BREAKOUT MOVES -- STRONG JOBS NUMBER HITS EURO, BONDS AND GOLD -- ISM INDICES, AUTO SALES AND NON-FARM PAYROLLS COME IN BIG
by John Murphy,
Chief Technical Analyst, StockCharts.com
SECTOR WEIGHTINGS IN THE S&P 500 ... Link for today's video. The four most important sector SPDRs are strong and this supports the long-term uptrend in the large-cap indices ($SPX, $NDX, $INDU). The consumer discretionary sector is the most economically sensitive sector with lots of retail oriented...
READ MORE
MEMBERS ONLY

ECB INACTION CAUSES SELLING IN EUROPE -- OIL PRODUCERS LIKE CANADA SUFFER BIGGER LOSSES -- CANADIAN DOLLAR WEAKENS WITH OIL -- CHINA RALLY MAY FUELED BY FALLING OIL -- S&P 500 SUFFERS MINOR SETBACK FROM OVERBOUGHT CONDITION
by John Murphy,
Chief Technical Analyst, StockCharts.com
ECB PUSHES MORE EASING INTO NEXT YEAR ... Mario Draghi announced today that the ECB would wait until the first quarter to consider additional monetary easing. That decision disappointed those who were hoping for quicker action. At the same time, he downgraded prospects for eurozone growth and inflation. Bond prices sold...
READ MORE
MEMBERS ONLY

Bullish Seasonals and Cycles Should Push Stocks to Significant Highs in 2015..but will they?
by Martin Pring,
President, Pring Research
* Bullish NYSE percent has likely peaked out. Indicates market will become more selective.
* You can’t keep a good dollar down!
* Emerging market currency fund breaks down. EM are likely to follow.
US Equities
I have always said that trend trumps everything. By that I mean that however bad the...
READ MORE
MEMBERS ONLY

HEALTHCARE SECTOR CONTINUES TO LEAD -- NOVO NORDISK AND BIOGEN BOUNCE OFF SUPPORT -- MATERIALS SPDR TESTS ITS BREAKOUT -- PALLADIUM OUTSHINES OTHER METALS -- PALLADIUM ETF HITS KEY JUNCTURE -- ENERGY ISSUES WEIGH ON HIGH YIELD BOND ETF
by John Murphy,
Chief Technical Analyst, StockCharts.com
HEALTHCARE SECTOR CONTINUES TO LEAD... Link for today's video. Healthcare remains one of the strongest sectors in the stock market as the HealthCare SPDR (XLV) hit a new high again on Tuesday. Chart 1 shows XLV surging some 18% from its October low and hitting a series of...
READ MORE
MEMBERS ONLY

LARGE-CAP ETF'S LEAD UPSWING WITH NEW HIGHS -- SMALL-CAPS LAG, BUT TREND IS STILL UP -- TWO RISK INDICATORS REMAIN BULLISH FOR STOCKS -- ONE AD LINE DIVERGES FROM THE PACK -- BANK ETFS BREAK DOWN -- A BIG WEEK FOR ECONOMIC AND LABOR INDICATORS
by John Murphy,
Chief Technical Analyst, StockCharts.com
LARGE-CAP ETF'S LEAD UPSWING WITH NEW HIGHS... Link for today's video. The S&P 500 SPDR (SPY) and the Nasdaq 100 ETF (QQQ) remain the strongest of the major index ETFs. SPY represents a broad basket of large-cap stocks, while QQQ represents a basket of...
READ MORE
MEMBERS ONLY

PLUNGING OIL HURTS COMMODITY-RELATED ASSETS AND COUNTRIES -- AND BOOSTS US BONDS AND STOCKS -- DAY'S WINNERS INCLUDE RETAILERS AND AIRLINES -- FALLING BOND YIELDS BOOST STAPLES AND UTILITIES
by John Murphy,
Chief Technical Analyst, StockCharts.com
OPEC FAILURE TO CUT CAUSES OIL TO PLUNGE... Thursday's decision by OPEC not to cut oil output has caused that commodity to plunge in value, and has brought other commodities down with it. The weekly bars in Chart 1 show the United States Oil Fund (USO) plunging to...
READ MORE
MEMBERS ONLY

A couple of Chinese Equity Sector ETF's break to the Upside
by Martin Pring,
President, Pring Research
* Stock/bond ratio challenges overhead resistance.
* Watch $120 on the GLD.
* Commodities may be set for short-term rally.
US Equities
For some time I have been pointing to several discrepancies in the market that have been troubling. My conclusion was that as long as the uptrend since mid-October was intact...
READ MORE
MEMBERS ONLY

WITH CHINA AND JAPANESE STOCKS DOING SO WELL, DON'T FORGET ABOUT EUROPE -- GERMAN STOCKS HIT FIVE-MONTH HIGHS -- BUT BE SURE TO HEDGE OUT CURRENCY RISK -- RECORD LOW GERMAN YIELD PULLS TREASURY YIELD LOWER
by John Murphy,
Chief Technical Analyst, StockCharts.com
CHINESE AND JAPAN STOCKS HAVE BECOME WORLD LEADERS... The two largest Asian stock markets have become two of the world's best gainers this year. The red bars in Chart 1 show the Shanghai Stock Exchange Composite Index ($SSEC) rising to the highest level in more than three years....
READ MORE
MEMBERS ONLY

SMALL-CAPS REFUSE TO BUCKLE -- REGIONAL BANK SPDR STALLS -- BIOTECH ETFS BREAK TO NEW HIGHS -- SEMICONDUCTOR SPDR HOLDS SHORT-TERM BREAK -- 20+ YR T-BOND ETF EDGES TOWARDS BREAKOUT -- SHANGHAI COMPOSITE HITS ANOTHER MILESTONE
by John Murphy,
Chief Technical Analyst, StockCharts.com
SMALL-CAPS REFUSE TO BUCKLE... Programming Note: There is no video today because I am working on the road. Also note that I will be taking the rest of the week off to be with family and friends. I will post a Market Message and video next Monday, December 1st. In...
READ MORE
MEMBERS ONLY

S&P MIDCAP 400 IS KNOCKING ON THE DOOR -- MICRO-CAP ETF HITS MOMENT-OF-TRUTH -- S&P 500 AND NASDAQ 100 AD LINES SCORE NEW HIGHS -- HIGH-LOW INDICATORS SURGE -- MATERIALS SECTOR GETS A BREADTH SURGE
by John Murphy,
Chief Technical Analyst, StockCharts.com
S&P MIDCAP 400 IS KNOCKING ON THE DOOR... Programming note: I am on the road today and there is no video. Getting the trend right is more than half the battle when it comes to trading and investing. Moreover, once we define the trend, it is important to...
READ MORE
MEMBERS ONLY

S&P RETAIL SPDR HITS NEW RECORD -- LEADERS INCLUDE BEST BUY, DOLLAR TREE, AND WILLIAMS SONOMA -- MACY'S BREAKS OUT -- HOMEBUILDING ETF HITS EIGHT-MONTH HIGH -- LED BY LENNAR, DR HORTON, AND PULTEGROUP -- CONSUMER DISCRETIONARY SPDR SHOWS NEW LEADERSHIP
by John Murphy,
Chief Technical Analyst, StockCharts.com
S&P RETAIL SPDR HITS NEW HIGH ... Strong buying of retail stocks continues. I've been showing record highs in the Market Vectors Retail ETF (RTH). Chart 1, however, shows the S&P Retail SPDR (XRT) hitting a record high as well. Its relative strength line (above...
READ MORE
MEMBERS ONLY
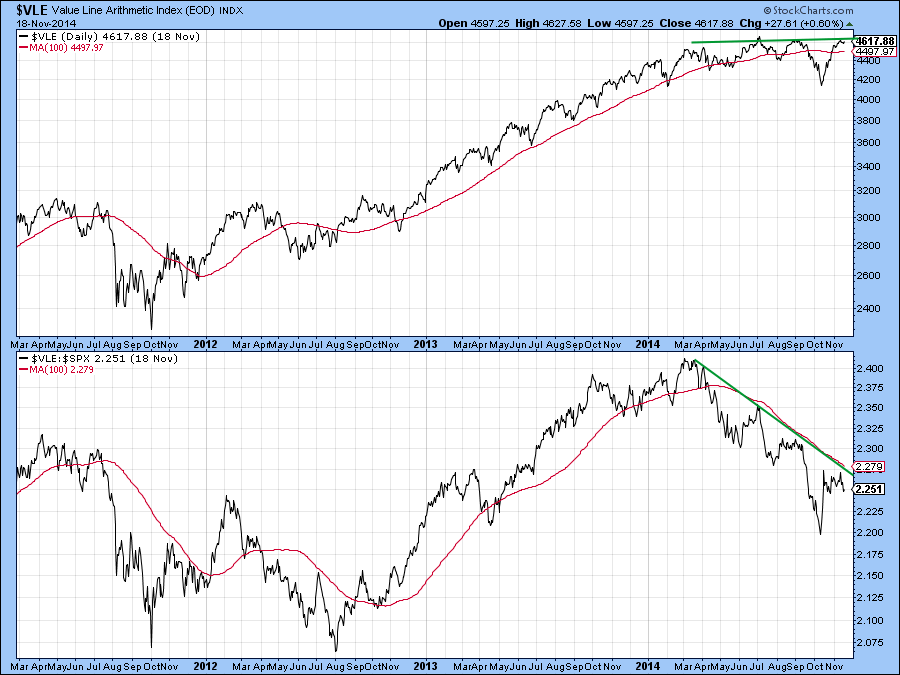
Tuesday's NASDAQ High Was Accompanied By A Paltry 50 Net New Highs
by Martin Pring,
President, Pring Research
* Value Line Arithmetic is just below important resistance.
* 10-year bond price reacts to its recent breakout point.
* The GLD fails at resistance.
US Equities
The Value Line Arithmetic($VLE) monitors the price of the average stock. It has been one of the weakest areas of the market as demonstrated by...
READ MORE
MEMBERS ONLY

CONSUMER STAPLES AND RETAIL ETFS HIT RECORD HIGHS -- RETAILERS ARE BENEFTING FROM FALLING OIL -- DIVIDEND PAYING STAPLES MAY BE BENEFITING FROM LOWER BONDS YIELDS -- A STRONGER DOLLAR IS ALSO KEEPING INFLATION AND GLOBAL BOND YIELDS DOWN
by John Murphy,
Chief Technical Analyst, StockCharts.com
WHY ARE STAPLES AND RETAILERS LEADING ... We generally look at the relative performance of market sectors to get clues about stock market direction. It's normally a good sign, for example, when retailers are doing better than the general market. It's normally a bad sign when consumer...
READ MORE
MEMBERS ONLY

MARKET TURNS MIXED AS SMALL-CAPS LAG -- IS RELATIVE WEAKNESS IN THE RUSSELL 2000 REALLY A PROBLEM? -- MARKING SUPPORT FOR THREE MAJOR INDEX ETFS -- AIR PRODUCTS LEADS MATERIALS SECTOR -- XLV HITS NEW HIGH AS PFIZER CHALLENGES RESISTANCE
by John Murphy,
Chief Technical Analyst, StockCharts.com
MARKET TURNS MIXED AS SMALL-CAPS LAG... Link for today's video. As of Mondays close, November has been a mixed month for the stock market. The S&P 500 SPDR, the Dow Diamonds and the Nasdaq 100 ETF are up, while the S&P SmallCap iShares, Russell...
READ MORE
MEMBERS ONLY

ENERGY ETFS CONTINUE TO STRUGGLE -- GOOGLE FAILS AT BROKEN SUPPORT AND LAGS -- FACEBOOK FIRMS AFTER GAP -- INTERNET ETF MAINTAINS UPTREND -- GLOBAL SOCIAL MEDIA ETF REVERSES AT KEY RETRACEMENT -- SEMICONDUCTORS COULD HOLD THE NEXT KEY
by John Murphy,
Chief Technical Analyst, StockCharts.com
ENERGY ETFS CONTINUE TO STRUGGLE... Link for today's video. Energy stocks are in the news today because Baker Hughes is attempting to takeover Halliburton. This seemingly positive news did not, however, boost the sector or other energy related ETFs. Perhaps the sector is more focused on oil, which...
READ MORE
MEMBERS ONLY

Gold in Yen Breaks to the Upside. Is this the Start of a Broader Trend Feeding Back to the US Dollar Gold Price?
by Martin Pring,
President, Pring Research
* IWM continues to rally but Relative Strength action still lags.
* Dollar diffusion indicator starting to turn down.
* The Gold (GLD) experiences a strong outside bar on heavy volume.
US Equities
Chart 1 shows the Coppock Curve for the S&P 500 ($SPX) . This indicator was designed to identify major...
READ MORE
MEMBERS ONLY

EQUAL-WEIGHT TECH AND CONSUMER DISCRETIONARY ETFS LEAD -- S&P 500 NOTCHES ANOTHER NEW HIGH -- SMALL AND MID CAPS CONTINUE TO LAG -- BUT NEW HIGHS SURGE FOR SMALL AND MID CAPS -- HIGH-LOW PERCENT HITS A MILESTONE FOR 2014
by John Murphy,
Chief Technical Analyst, StockCharts.com
EQUAL-WEIGHT TECH AND CONSUMER DISCRETIONARY ETFS LEAD... Link for today's video. There are certainly pockets of weakness in the stock market, but the stock market as a whole shows enough strength to keep the bull going and there were some notable new highs this week. John Murphy wrote...
READ MORE
MEMBERS ONLY

WAL-MART JUMPS TO RECORD HIGH -- RETAIL ETFS HAVE BENEFITED FROM PLUNGE IN CRUDE OIL -- LOWER END RETAILERS LIKE COSTCO, TJX, AND TARGET HAVE LED RALLY -- HIGHER END RETAILERS LIKE TIFFANY HAVE LAGGED BEHIND -- MACY'S HAS STRONG WEEK
by John Murphy,
Chief Technical Analyst, StockCharts.com
WAL-MART SHARES EXPLODE... Chart 1 shows Wal Mart surging 4% today to break out to a record high. That's a pleasant change for the world's largest retailer which has hardly been a market leaders. The WMT/SPX relative strength ratio (above chart) is just starting to...
READ MORE
MEMBERS ONLY

SHANGHAI-HONG KONG STOCK CONNECT PROGRAM IS SET TO START NEXT MONDAY -- ITS APRIL ANNOUNCEMENT IS THE MAIN REASON SHANGHAI STOCKS HAVE BEEN GAINING ON HONG KONG -- SHANGHAI STOCK INDEX TOUCHES THREE-YEAR HIGH AND IS STARTING TO GAIN ON REST OF THE WORLD
by John Murphy,
Chief Technical Analyst, StockCharts.com
FOREIGNERS WILL BE ABLE TO BUY SHANGHAI STOCKS ... Starting next Monday, foreign investors will be able for the first time to buy and sell stocks listed on the Shanghai Stock Exchange via the Hong Kong Stock Exchange. More than 500 mainland stocks (previously unavailable to foreign investors) will be traded...
READ MORE