MEMBERS ONLY

PLUNGING OIL HURTS COMMODITY-RELATED ASSETS AND COUNTRIES -- AND BOOSTS US BONDS AND STOCKS -- DAY'S WINNERS INCLUDE RETAILERS AND AIRLINES -- FALLING BOND YIELDS BOOST STAPLES AND UTILITIES

by John Murphy,
Chief Technical Analyst, StockCharts.com
OPEC FAILURE TO CUT CAUSES OIL TO PLUNGE... Thursday's decision by OPEC not to cut oil output has caused that commodity to plunge in value, and has brought other commodities down with it. The weekly bars in Chart 1 show the United States Oil Fund (USO) plunging to...
READ MORE
MEMBERS ONLY

A couple of Chinese Equity Sector ETF's break to the Upside

by Martin Pring,
President, Pring Research
* Stock/bond ratio challenges overhead resistance.
* Watch $120 on the GLD.
* Commodities may be set for short-term rally.
US Equities
For some time I have been pointing to several discrepancies in the market that have been troubling. My conclusion was that as long as the uptrend since mid-October...
READ MORE
MEMBERS ONLY

WITH CHINA AND JAPANESE STOCKS DOING SO WELL, DON'T FORGET ABOUT EUROPE -- GERMAN STOCKS HIT FIVE-MONTH HIGHS -- BUT BE SURE TO HEDGE OUT CURRENCY RISK -- RECORD LOW GERMAN YIELD PULLS TREASURY YIELD LOWER
by John Murphy,
Chief Technical Analyst, StockCharts.com
CHINESE AND JAPAN STOCKS HAVE BECOME WORLD LEADERS... The two largest Asian stock markets have become two of the world's best gainers this year. The red bars in Chart 1 show the Shanghai Stock Exchange Composite Index ($SSEC) rising to the highest level in more than three years....
READ MORE
MEMBERS ONLY

SMALL-CAPS REFUSE TO BUCKLE -- REGIONAL BANK SPDR STALLS -- BIOTECH ETFS BREAK TO NEW HIGHS -- SEMICONDUCTOR SPDR HOLDS SHORT-TERM BREAK -- 20+ YR T-BOND ETF EDGES TOWARDS BREAKOUT -- SHANGHAI COMPOSITE HITS ANOTHER MILESTONE
by John Murphy,
Chief Technical Analyst, StockCharts.com
SMALL-CAPS REFUSE TO BUCKLE... Programming Note: There is no video today because I am working on the road. Also note that I will be taking the rest of the week off to be with family and friends. I will post a Market Message and video next Monday, December 1st....
READ MORE
MEMBERS ONLY

S&P MIDCAP 400 IS KNOCKING ON THE DOOR -- MICRO-CAP ETF HITS MOMENT-OF-TRUTH -- S&P 500 AND NASDAQ 100 AD LINES SCORE NEW HIGHS -- HIGH-LOW INDICATORS SURGE -- MATERIALS SECTOR GETS A BREADTH SURGE
by John Murphy,
Chief Technical Analyst, StockCharts.com
S&P MIDCAP 400 IS KNOCKING ON THE DOOR... Programming note: I am on the road today and there is no video. Getting the trend right is more than half the battle when it comes to trading and investing. Moreover, once we define the trend, it is important to...
READ MORE
MEMBERS ONLY

S&P RETAIL SPDR HITS NEW RECORD -- LEADERS INCLUDE BEST BUY, DOLLAR TREE, AND WILLIAMS SONOMA -- MACY'S BREAKS OUT -- HOMEBUILDING ETF HITS EIGHT-MONTH HIGH -- LED BY LENNAR, DR HORTON, AND PULTEGROUP -- CONSUMER DISCRETIONARY SPDR SHOWS NEW LEADERSHIP
by John Murphy,
Chief Technical Analyst, StockCharts.com
S&P RETAIL SPDR HITS NEW HIGH ... Strong buying of retail stocks continues. I've been showing record highs in the Market Vectors Retail ETF (RTH). Chart 1, however, shows the S&P Retail SPDR (XRT) hitting a record high as well. Its relative strength line (above...
READ MORE
MEMBERS ONLY
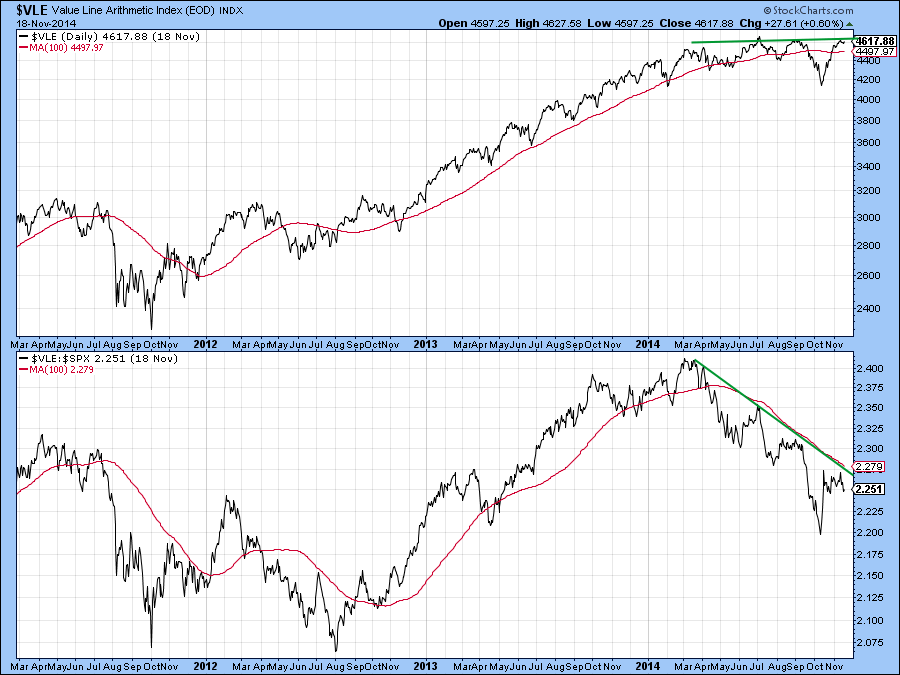
Tuesday's NASDAQ High Was Accompanied By A Paltry 50 Net New Highs
by Martin Pring,
President, Pring Research
* Value Line Arithmetic is just below important resistance.
* 10-year bond price reacts to its recent breakout point.
* The GLD fails at resistance.
US Equities
The Value Line Arithmetic($VLE) monitors the price of the average stock. It has been one of the weakest areas of the market as demonstrated...
READ MORE
MEMBERS ONLY

CONSUMER STAPLES AND RETAIL ETFS HIT RECORD HIGHS -- RETAILERS ARE BENEFTING FROM FALLING OIL -- DIVIDEND PAYING STAPLES MAY BE BENEFITING FROM LOWER BONDS YIELDS -- A STRONGER DOLLAR IS ALSO KEEPING INFLATION AND GLOBAL BOND YIELDS DOWN
by John Murphy,
Chief Technical Analyst, StockCharts.com
WHY ARE STAPLES AND RETAILERS LEADING ... We generally look at the relative performance of market sectors to get clues about stock market direction. It's normally a good sign, for example, when retailers are doing better than the general market. It's normally a bad sign when consumer...
READ MORE
MEMBERS ONLY

MARKET TURNS MIXED AS SMALL-CAPS LAG -- IS RELATIVE WEAKNESS IN THE RUSSELL 2000 REALLY A PROBLEM? -- MARKING SUPPORT FOR THREE MAJOR INDEX ETFS -- AIR PRODUCTS LEADS MATERIALS SECTOR -- XLV HITS NEW HIGH AS PFIZER CHALLENGES RESISTANCE
by John Murphy,
Chief Technical Analyst, StockCharts.com
MARKET TURNS MIXED AS SMALL-CAPS LAG... Link for today's video. As of Mondays close, November has been a mixed month for the stock market. The S&P 500 SPDR, the Dow Diamonds and the Nasdaq 100 ETF are up, while the S&P SmallCap iShares,...
READ MORE
MEMBERS ONLY

ENERGY ETFS CONTINUE TO STRUGGLE -- GOOGLE FAILS AT BROKEN SUPPORT AND LAGS -- FACEBOOK FIRMS AFTER GAP -- INTERNET ETF MAINTAINS UPTREND -- GLOBAL SOCIAL MEDIA ETF REVERSES AT KEY RETRACEMENT -- SEMICONDUCTORS COULD HOLD THE NEXT KEY
by John Murphy,
Chief Technical Analyst, StockCharts.com
ENERGY ETFS CONTINUE TO STRUGGLE... Link for today's video. Energy stocks are in the news today because Baker Hughes is attempting to takeover Halliburton. This seemingly positive news did not, however, boost the sector or other energy related ETFs. Perhaps the sector is more focused on oil, which...
READ MORE
MEMBERS ONLY

Gold in Yen Breaks to the Upside. Is this the Start of a Broader Trend Feeding Back to the US Dollar Gold Price?
by Martin Pring,
President, Pring Research
* IWM continues to rally but Relative Strength action still lags.
* Dollar diffusion indicator starting to turn down.
* The Gold (GLD) experiences a strong outside bar on heavy volume.
US Equities
Chart 1 shows the Coppock Curve for the S&P 500 ($SPX) . This indicator was designed to identify major...
READ MORE
MEMBERS ONLY

EQUAL-WEIGHT TECH AND CONSUMER DISCRETIONARY ETFS LEAD -- S&P 500 NOTCHES ANOTHER NEW HIGH -- SMALL AND MID CAPS CONTINUE TO LAG -- BUT NEW HIGHS SURGE FOR SMALL AND MID CAPS -- HIGH-LOW PERCENT HITS A MILESTONE FOR 2014
by John Murphy,
Chief Technical Analyst, StockCharts.com
EQUAL-WEIGHT TECH AND CONSUMER DISCRETIONARY ETFS LEAD... Link for today's video. There are certainly pockets of weakness in the stock market, but the stock market as a whole shows enough strength to keep the bull going and there were some notable new highs this week. John Murphy...
READ MORE
MEMBERS ONLY

WAL-MART JUMPS TO RECORD HIGH -- RETAIL ETFS HAVE BENEFITED FROM PLUNGE IN CRUDE OIL -- LOWER END RETAILERS LIKE COSTCO, TJX, AND TARGET HAVE LED RALLY -- HIGHER END RETAILERS LIKE TIFFANY HAVE LAGGED BEHIND -- MACY'S HAS STRONG WEEK
by John Murphy,
Chief Technical Analyst, StockCharts.com
WAL-MART SHARES EXPLODE... Chart 1 shows Wal Mart surging 4% today to break out to a record high. That's a pleasant change for the world's largest retailer which has hardly been a market leaders. The WMT/SPX relative strength ratio (above chart) is just starting...
READ MORE
MEMBERS ONLY

SHANGHAI-HONG KONG STOCK CONNECT PROGRAM IS SET TO START NEXT MONDAY -- ITS APRIL ANNOUNCEMENT IS THE MAIN REASON SHANGHAI STOCKS HAVE BEEN GAINING ON HONG KONG -- SHANGHAI STOCK INDEX TOUCHES THREE-YEAR HIGH AND IS STARTING TO GAIN ON REST OF THE WORLD
by John Murphy,
Chief Technical Analyst, StockCharts.com
FOREIGNERS WILL BE ABLE TO BUY SHANGHAI STOCKS ... Starting next Monday, foreign investors will be able for the first time to buy and sell stocks listed on the Shanghai Stock Exchange via the Hong Kong Stock Exchange. More than 500 mainland stocks (previously unavailable to foreign investors) will be traded...
READ MORE
MEMBERS ONLY

IJR AND QQQ WORK THEIR WAY HIGHER -- BREADTH INDICATORS IMPROVE FOR THE MATERIALS SECTOR -- RETAIL SPDR HITS NEW HIGH AHEAD OF KEY REPORT -- MARKETVECTORS RETAIL ETF SHOWS RELATIVE STRENGTH -- A MIXED BAG FOR APPAREL RETAILERS
by John Murphy,
Chief Technical Analyst, StockCharts.com
IJR AND QQQ WORK THEIR WAY HIGHER... Link for today's video. Last week I featured the S&P SmallCap iShares (IJR) and the Nasdaq 100 ETF (QQQ) because both were holding their gaps and consolidating. After strong buying pressure and a big surge, buying pressure and selling...
READ MORE
MEMBERS ONLY

HOME CONSTRUCTION ISHARES MAKES A BREAK -- SHANGHAI COMP SURGES TO NEW HIGH -- CHINA AND JAPAN SHOW RELATIVE STRENGTH -- CHINA INDUSTRIALS LEADS ETF GROUP -- CHINA CONSUMER ETF FIRMS AT KEY LEVEL -- COPPER HITS SUPPORT ZONE AGAIN
by John Murphy,
Chief Technical Analyst, StockCharts.com
HOME CONSTRUCTION ISHARES MAKES A BREAK... Link for today's video. Chart 1 shows the Home Construction iShares (ITB) reversing an eight month downtrend with a surge above its August-September highs. This is the first higher high of 2014. Notice that this is a weekly chart extending back...
READ MORE
MEMBERS ONLY

IJR AND QQQ CONSOLIDATE AFTER GAPS -- THE NEW HIGH PARADE -- LARGE-CAPS LEAD MARKET WITH NEW HIGHS -- SPX AND NDX BREADTH HELD UP THE BEST IN OCTOBER -- SPX AND NDX LEAD EXPANSION OF NEW HIGHS -- THE FIVE STRONGEST SMALL-CAP SECTORS
by John Murphy,
Chief Technical Analyst, StockCharts.com
IJR AND QQQ CONSOLIDATE AFTER GAPS... Link for today's video. The S&P SmallCap iShares (IJR) and the Nasdaq 100 ETF (QQQ) gapped up on Friday and held these gaps all week. Even though these ETFs stalled and did not continue higher, the gaps are holding and...
READ MORE
MEMBERS ONLY

POWERSHARES DOLLAR BULLISH ETF BREAKS OUT TO THE UPSIDE -- DOLLAR RALLY IS SUPPORTED BY WIDE PREMIUM OF U.S. BOND YIELDS OVER FOREIGN YIELDS -- STRONGER DOLLAR FAVORS U.S. OVER FOREIGN STOCKS -- EMERGING CURRENCIES TEST MAJOR SUPPORT
by John Murphy,
Chief Technical Analyst, StockCharts.com
POWERSHARES U.S. DOLLAR BULLISH ETF BREAKS OUT TO THE UPSIDE ... The U.S. dollar rally continues. The line on top of Chart 1 shows the U.S. Dollar Cash Index (USD) trading at the highest level in four years. The main chart shows the PowerShares US Dollar Bullish ETF...
READ MORE
MEMBERS ONLY

Gold Price in Yen Offers a Thumbs Down on the BOJ's latest Inflationary Moves
by Martin Pring,
President, Pring Research
* Short-term market indicators are still bullish.
* Stock/bond ratio reaches a critical point.
* Yen completes a 28-year top against the dollar.
US Equities
Throughout 2013 and for most of 2014 every peak in the S&P was confirmed by the NYSE Composite ($NYA) . You can see that...
READ MORE
MEMBERS ONLY

CONSUMER DISCRETIONARY SECTOR WEIGHS ON STOCKS -- WATCHING THE UPSWINGS IN XRT AND ITB -- SMALL-CAP TECH ETF HITS NEW HIGH -- LIGHT CRUDE, BRENT AND GASOLINE BREAK DOWN -- CONSOLIDATIONS END FOR ENERGY-RELATED ETFS
by John Murphy,
Chief Technical Analyst, StockCharts.com
CONSUMER DISCRETIONARY SECTOR WEIGHS ON STOCKS... Link for today's video. The consumer discretionary led the market in 2013, but has lagged the market this year and the price relative just broke to a new low. Chart 1 shows the Consumer Discretionary SPDR (XLY) peaking just below the early...
READ MORE
MEMBERS ONLY

HIGH-LOW PERCENT SURGES ACROSS THE BOARD -- FINANCE SECTOR LEADS OFFENSIVE SECTOR BREADTH -- MATERIALS AND ENERGY SHOW WEAKEST BREADTH -- CRUDE OIL CONSOLIDATION EVOLVES -- GASOLINE SLIGHTLY OUTPERFORMS CRUDE -- PALLADIUM HOLDS UP BETTER THAN GOLD
by John Murphy,
Chief Technical Analyst, StockCharts.com
HIGH-LOW PERCENT SURGES ACROSS THE BOARD... Link for today's video. Chartists can use High-Low Percent to measure participation in a market move and compare the degree of participation. High-Low Percent equals the difference between 52-week highs and new 52-week lows divided by the...
READ MORE
MEMBERS ONLY

BIG MOVE BY JAPAN PUSHES GLOBAL STOCKS SHARPLY HIGHER -- THE PLUNGING YEN PUSHES JAPANESE STOCKS TO SEVEN-YEAR HIGH -- DOW RECORD HIGH CONFIRMS TRANSPORTATION BREAKOUT -- S&P 500 HITS RECORD CLOSE AS SMALL CAPS JUMP
by John Murphy,
Chief Technical Analyst, StockCharts.com
JAPAN ANNOUNCES BIG JUMP IN ASSET BUYING... Japanese authorities surprised everyone on Friday by increasing their already aggressive bond purchases (QE) by a third. In addition, it will expand those purchases to include stocks and real estate investments. The Japanese pension fund also announced that it will increase its allocation...
READ MORE
MEMBERS ONLY

S&P 500 RECLAIMS 2K -- SMALL-CAPS RIP HIGHER -- SEASONALITY FAVORS SMALL-CAPS (LIVE DEMO) -- SHORT-TERM TREASURY YIELDS SURGE -- FINANCE SECTOR LEADS WITH NEW HIGH -- PUTTING RECENTLY VOLATILITY INTO PERSPECTIVE
by John Murphy,
Chief Technical Analyst, StockCharts.com
S&P 500 RECLAIMS 2K... Link for today's video. Stocks may be short-term overbought and some of the indices may be near their prior highs, but the trends are up and the breadth indicators are bullish. These short-term overbought conditions could give way to a...
READ MORE
MEMBERS ONLY
Inflation Hedge Assets Continue to Break to the Downside (Video)
by Martin Pring,
President, Pring Research
* Outside day hints that the short-term downtrend for bonds may be over.
* Dollar Index may be completing an inverse head and shoulders.
* Stronger dollar forces gold to test its lows.
* Stronger dollar causes gold to break down from a 2-year trading range.
Here is a link to the...
READ MORE
MEMBERS ONLY

Inflation Hedge Assets Continue to Break to the Downside
by Martin Pring,
President, Pring Research
* Outside day hints that the short-term downtrend for bonds may be over.
* Dollar Index may be completing an inverse head and shoulders.
* Stronger dollar forces gold to test its lows.
* Stronger dollar causes gold to break down from a 2-year trading range.
Here is a link to the...
READ MORE
MEMBERS ONLY

MARKET INDEXES BREAK MORE RESISTANCE BARRIERS -- SMALLER STOCKS SHOW RELATIVE STRENGTH -- BREADTH FIGURES ALSO SHOW IMPROVEMENT -- BUT DEFENSIVE STOCKS STILL SHOW MARKET LEADERSHIP -- TREASURIES SLIDE AS HIGH YIELD BONDS JUMP
by John Murphy,
Chief Technical Analyst, StockCharts.com
S&P 500 HITS NEW OCTOBER HIGH ... The S&P 500 reflects continued improvement in the stock market's short-term trend. The daily bars in Chart 1 show the SPX climbing above its 50-day moving average (blue line) and chart resistance at its early October...
READ MORE
MEMBERS ONLY

VIX TRIGGERS THIRD SIGNAL OF 2014 -- KRE AND IWM CHALLENGE ANOTHER SUPPORT BREAK -- SOME REFINERS SHOW RELATIVE STRENGTH WITHIN ENERGY SECTOR -- TESORO AND PHILLIPS BOUNCE OFF KEY RETRACEMENTS -- REFINERS ON THE RELATIVE ROTATION GRAPH
by John Murphy,
Chief Technical Analyst, StockCharts.com
VIX TRIGGERS THIRD SIGNAL OF 2014... Link for today's video. The S&P 500 Volatility Index ($VIX) is largely a coincident indicator that rises when the S&P 500 falls and falls when the S&P 500 rises. As with the S&P 500,...
READ MORE
MEMBERS ONLY

CONSUMER STAPLES AND UTILITIES SPDRS SURGE TO NEW HIGHS -- OIL ETFS BREAK PENNANT LINES -- XOP AND XES FOLLOW OIL LOWER -- INITIAL CLAIMS AND INDUSTRIAL PRODUCTION FAVOR LESS QE -- TIP SHOWS INFLATIONARY PRESSURES DECREASING
by John Murphy,
Chief Technical Analyst, StockCharts.com
CONSUMER STAPLES AND UTILITIES SPDRS SURGE TO NEW HIGHS... Link for today's video. The defensive sectors took the lead on Monday with the Consumer Staples SPDR (XLP) and the Utilities SPDR (XLU) hitting fresh 52-week highs. Relative strength and upside leadership in these two sectors shows a...
READ MORE
MEMBERS ONLY

THE KEY TO THE UPSWING IN IWM -- RAFF REGRESSION CHANNEL DEMO -- BREADTH THRUST IS BULLISH UNTIL IT ISN'T -- ELEMENTS OF RISK AVERSION REMAIN -- MEDICAL DEVICES ETF CHALLENGES PRIOR HIGHS -- OIL AND GASOLINE CONSOLIDATE WITHIN DOWNTRENDS
by John Murphy,
Chief Technical Analyst, StockCharts.com
THE KEY TO THE UPSWING IN IWM (RAFF REGRESSION CHANNEL DEMO)... Link for today's video. Chart 1 shows the Russell 2000 iShares (IWM) with Raff Regression Channels marking the swings over the last six months. The overall trend is down because the ETF formed a lower high in...
READ MORE
MEMBERS ONLY

MARKET RALLY CONTINUES -- RAILS LEAD TRANSPORTS HIGHER -- MMM LEADS INDUSTRIAL SPDR ABOVE 50-DAY LINE -- SMALL CAPS ALSO IMPROVE -- DIVIDEND PAYERS ATTRACT BUYERS ON FALLING BOND YIELDS -- VIX PLUNGES BACK BELOW 20 -- OVERSOLD FOREIGN SHARES REBOUND
by John Murphy,
Chief Technical Analyst, StockCharts.com
RAILS LEAD TRANSPORTS HIGHER ... Not only are stocks extending their recent rally with a strong day, they're being led higher by economically-sensitive groups like transports. The daily bars in Chart 1 show the Dow Jones Transportation Average trading 2% higher today and trading above its 50-day...
READ MORE
MEMBERS ONLY

Bearish Candle Patterns Indicate a Test of Last Week's Lows are Likely
by Martin Pring,
President, Pring Research
* Short-term momentum is still oversold, so a rally is probable once the expected test is over.
* Any rally likely to be part of an overall topping out process.
* Europe experiences primary trend sell signal.
* Japanese and Asian Ex Japan ETF’s look vulnerable from a long-term aspect.
This...
READ MORE
MEMBERS ONLY

MEASURING RISK APPETITE WITH MICRO-CAPS -- RUSSELL 2000 ISHARES RE-CAPTURES ONE BREAK -- CONSUMER DISCRETIONARY AND INDUSTRIALS SECTORS LEAD THE REBOUND -- ITB FORMS A BIG REVERSAL ON BIG VOLUME -- OIL SERVICE ETF FIRMS AFTER SELLING CLIMAX
by John Murphy,
Chief Technical Analyst, StockCharts.com
MEASURING MICRO-CAPS FOR RISK APPETITE... Link for today's video. The Russell Micro-Cap iShares (IWC) is an important ETF to watch because it represents the appetite for the riskiest stocks in the market. Small-cap stocks are deemed riskier than large-caps and micro-cap stocks are...
READ MORE
MEMBERS ONLY

SPY GETS STUCK BETWEEN A GAP AND A HARD PLACE -- FALLING YIELD CURVE WEIGHS ON REGIONAL BANKS -- RETAILER SPDR STRUGGLES TO STAY POSITIVE -- TWO DISCOUNTERS SHOW RELATIVE STRENGTH -- WATCHING MACY'S AND NORDSTROM FOR CLUES
by John Murphy,
Chief Technical Analyst, StockCharts.com
SPY GETS STUCK BETWEEN A GAP AND A HARD PLACE... Link for today's video. Chart 1 shows the S&P 500 SPDR (SPY) forging a short-term reversal last week. Notice how the ETF gapped below 187 on Wednesday, stalled for two days and then gapped above...
READ MORE
MEMBERS ONLY

CRB INDEX TESTS MAJOR SUPPORT -- BOND SURGE SHOWS EXHAUSTION -- JUMP IN HIGH YIELD BONDS IS ENCOURAGING -- S&P 500 BOUNCES FROM OVERSOLD CONDITION -- BUT MORE TESTING MAY BE NEEDED -- SMALL CAP RALLY FADES ON FRIDAY
by John Murphy,
Chief Technical Analyst, StockCharts.com
CRB INDEX IS TESTING MAJOR SUPPORT... I'm starting today's message with a look at commodity prices because they've been the focus of a lot of attention of late. That's because falling commodity prices are deflationary in nature, which is something central bankers...
READ MORE
MEMBERS ONLY

S&P 500 HITS LONG VOLUME-BY-PRICE BAR -- S&P MIDCAP 400 FULFILLS DOUBLE TOP TARGET -- SMALL-CAP PRICE RELATIVE BOUNCES -- SECTOR ROTATIONS FAVOR DEFENSIVE SECTORS -- TWO SMALL-CAP SECTORS TO WATCH -- PLUNGE IN SHORT-TERM RATES SHOWS FLIGHT TO SAFETY
by John Murphy,
Chief Technical Analyst, StockCharts.com
S&P 500 HITS LONG VOLUME-BY-PRICE BAR... On an intraday basis, the S&P 500 fell around 10% from its summer high to the mid October low. Even though a 10% decline may seem drastic, it still pales relative to the 50% advance from the November...
READ MORE
MEMBERS ONLY

That Was Probably It....For The Time Being
by Martin Pring,
President, Pring Research
* Short-term indicators continue to decline, but Wednesday’s price action may cause them to go bullish.
* Small caps starting to emerge as leaders on the upside (At least for the short-term).
* Quality bonds experience probable upside blow-off and high yield exhaustion on the downside .
Earlier in the...
READ MORE
MEMBERS ONLY

FOREIGN WEAKNESS FINALLY HITS U.S. STOCKS -- RISING VIX IS AT THREE-YEAR HIGH AND MAY HAVE FURTHER TO GO -- S&P 500 MAY RETEST ITS FEBRUARY LOW -- FOUR YEAR LOW IN BRENT CRUDE PULLS GERMAN BOND YIELD TO NEW RECORD LOW
by John Murphy,
Chief Technical Analyst, StockCharts.com
FOREIGN WEAKNESS FINALLY HITS THE U.S.... It took awhile for it to happen, but tumbling foreign markets have finally pulled the U.S. market into a downside correction. The three lines in Chart 1 tell the story. The blue line shows EAFE iShares (EFA) peaking at the start of...
READ MORE
MEMBERS ONLY
Shanghai Reverses Four -year Bear Market in Relative Action
by Martin Pring,
President, Pring Research
* Global equities experience long term technical damage.
* But short-term indicators are close to signaling a tradable rally.
* Bond market still looks strong.
* Gold experiences marginal upside breakout against stocks.
US Equities
Last week I described how some serious long-term technical damage had been done to global equities but...
READ MORE
MEMBERS ONLY

S&P 500 BREAKS KEY MOVING AVERAGE -- GOOGLE BREAKS DOWN AS APPLE HOLDS STRONG -- PLAYING THE SWINGS IN KRE AND IWC -- DECEMBER NATURAL GAS TESTS KEY LEVEL -- ENERGY-RELATED ETFS ARE THE MOST OVERSOLD -- COFFEE ETF CHALLENGES PRIOR HIGH
by John Murphy,
Chief Technical Analyst, StockCharts.com
S&P 500 BREAKS KEY MOVING AVERAGE ... Link for today's video. The S&P 500 is not in uncharted territory, but it is in territory we have not seen in some time. Chart 1 shows the index breaking below its 200-day moving average, breaking its...
READ MORE
MEMBERS ONLY

FOUR WAYS TO MEASURE RELATIVE PERFORMANCE -- UTILITIES SECTOR MAINTAINS WEDGE BREAKOUT -- SMALL FINANCIALS SHOW RELATIVE STRENGTH -- FINDING SECTORS THAT POINT NORTHEAST -- AVOIDING SECTORS THAT POINT SOUTHWEST
by John Murphy,
Chief Technical Analyst, StockCharts.com
SPX TESTS A KEY MOVING AVERAGE... Link for today's video. Selling pressure and volatility have dominated October, but some sectors and industry groups are holding up better than others. How can we find the strong groups and avoid the weak? The next few charts will show four methods...
READ MORE