MEMBERS ONLY

IJR AND QQQ WORK THEIR WAY HIGHER -- BREADTH INDICATORS IMPROVE FOR THE MATERIALS SECTOR -- RETAIL SPDR HITS NEW HIGH AHEAD OF KEY REPORT -- MARKETVECTORS RETAIL ETF SHOWS RELATIVE STRENGTH -- A MIXED BAG FOR APPAREL RETAILERS

by John Murphy,
Chief Technical Analyst, StockCharts.com
IJR AND QQQ WORK THEIR WAY HIGHER... Link for today's video. Last week I featured the S&P SmallCap iShares (IJR) and the Nasdaq 100 ETF (QQQ) because both were holding their gaps and consolidating. After strong buying pressure and a big surge, buying pressure and selling...
READ MORE
MEMBERS ONLY

HOME CONSTRUCTION ISHARES MAKES A BREAK -- SHANGHAI COMP SURGES TO NEW HIGH -- CHINA AND JAPAN SHOW RELATIVE STRENGTH -- CHINA INDUSTRIALS LEADS ETF GROUP -- CHINA CONSUMER ETF FIRMS AT KEY LEVEL -- COPPER HITS SUPPORT ZONE AGAIN
by John Murphy,
Chief Technical Analyst, StockCharts.com
HOME CONSTRUCTION ISHARES MAKES A BREAK... Link for today's video. Chart 1 shows the Home Construction iShares (ITB) reversing an eight month downtrend with a surge above its August-September highs. This is the first higher high of 2014. Notice that this is a weekly chart extending back two...
READ MORE
MEMBERS ONLY

IJR AND QQQ CONSOLIDATE AFTER GAPS -- THE NEW HIGH PARADE -- LARGE-CAPS LEAD MARKET WITH NEW HIGHS -- SPX AND NDX BREADTH HELD UP THE BEST IN OCTOBER -- SPX AND NDX LEAD EXPANSION OF NEW HIGHS -- THE FIVE STRONGEST SMALL-CAP SECTORS
by John Murphy,
Chief Technical Analyst, StockCharts.com
IJR AND QQQ CONSOLIDATE AFTER GAPS... Link for today's video. The S&P SmallCap iShares (IJR) and the Nasdaq 100 ETF (QQQ) gapped up on Friday and held these gaps all week. Even though these ETFs stalled and did not continue higher, the gaps are holding and...
READ MORE
MEMBERS ONLY

POWERSHARES DOLLAR BULLISH ETF BREAKS OUT TO THE UPSIDE -- DOLLAR RALLY IS SUPPORTED BY WIDE PREMIUM OF U.S. BOND YIELDS OVER FOREIGN YIELDS -- STRONGER DOLLAR FAVORS U.S. OVER FOREIGN STOCKS -- EMERGING CURRENCIES TEST MAJOR SUPPORT
by John Murphy,
Chief Technical Analyst, StockCharts.com
POWERSHARES U.S. DOLLAR BULLISH ETF BREAKS OUT TO THE UPSIDE ... The U.S. dollar rally continues. The line on top of Chart 1 shows the U.S. Dollar Cash Index (USD) trading at the highest level in four years. The main chart shows the PowerShares US Dollar Bullish ETF...
READ MORE
MEMBERS ONLY

Gold Price in Yen Offers a Thumbs Down on the BOJ's latest Inflationary Moves

by Martin Pring,
President, Pring Research
* Short-term market indicators are still bullish.
* Stock/bond ratio reaches a critical point.
* Yen completes a 28-year top against the dollar.
US Equities
Throughout 2013 and for most of 2014 every peak in the S&P was confirmed by the NYSE Composite ($NYA) . You can see that from the...
READ MORE
MEMBERS ONLY

CONSUMER DISCRETIONARY SECTOR WEIGHS ON STOCKS -- WATCHING THE UPSWINGS IN XRT AND ITB -- SMALL-CAP TECH ETF HITS NEW HIGH -- LIGHT CRUDE, BRENT AND GASOLINE BREAK DOWN -- CONSOLIDATIONS END FOR ENERGY-RELATED ETFS
by John Murphy,
Chief Technical Analyst, StockCharts.com
CONSUMER DISCRETIONARY SECTOR WEIGHS ON STOCKS... Link for today's video. The consumer discretionary led the market in 2013, but has lagged the market this year and the price relative just broke to a new low. Chart 1 shows the Consumer Discretionary SPDR (XLY) peaking just below the early...
READ MORE
MEMBERS ONLY

HIGH-LOW PERCENT SURGES ACROSS THE BOARD -- FINANCE SECTOR LEADS OFFENSIVE SECTOR BREADTH -- MATERIALS AND ENERGY SHOW WEAKEST BREADTH -- CRUDE OIL CONSOLIDATION EVOLVES -- GASOLINE SLIGHTLY OUTPERFORMS CRUDE -- PALLADIUM HOLDS UP BETTER THAN GOLD
by John Murphy,
Chief Technical Analyst, StockCharts.com
HIGH-LOW PERCENT SURGES ACROSS THE BOARD... Link for today's video. Chartists can use High-Low Percent to measure participation in a market move and compare the degree of participation. High-Low Percent equals the difference between 52-week highs and new 52-week lows divided by the total number of stocks in...
READ MORE
MEMBERS ONLY

BIG MOVE BY JAPAN PUSHES GLOBAL STOCKS SHARPLY HIGHER -- THE PLUNGING YEN PUSHES JAPANESE STOCKS TO SEVEN-YEAR HIGH -- DOW RECORD HIGH CONFIRMS TRANSPORTATION BREAKOUT -- S&P 500 HITS RECORD CLOSE AS SMALL CAPS JUMP
by John Murphy,
Chief Technical Analyst, StockCharts.com
JAPAN ANNOUNCES BIG JUMP IN ASSET BUYING... Japanese authorities surprised everyone on Friday by increasing their already aggressive bond purchases (QE) by a third. In addition, it will expand those purchases to include stocks and real estate investments. The Japanese pension fund also announced that it will increase its allocation...
READ MORE
MEMBERS ONLY

S&P 500 RECLAIMS 2K -- SMALL-CAPS RIP HIGHER -- SEASONALITY FAVORS SMALL-CAPS (LIVE DEMO) -- SHORT-TERM TREASURY YIELDS SURGE -- FINANCE SECTOR LEADS WITH NEW HIGH -- PUTTING RECENTLY VOLATILITY INTO PERSPECTIVE
by John Murphy,
Chief Technical Analyst, StockCharts.com
S&P 500 RECLAIMS 2K... Link for today's video. Stocks may be short-term overbought and some of the indices may be near their prior highs, but the trends are up and the breadth indicators are bullish. These short-term overbought conditions could give way to a pullback or...
READ MORE
MEMBERS ONLY
Inflation Hedge Assets Continue to Break to the Downside (Video)
by Martin Pring,
President, Pring Research
* Outside day hints that the short-term downtrend for bonds may be over.
* Dollar Index may be completing an inverse head and shoulders.
* Stronger dollar forces gold to test its lows.
* Stronger dollar causes gold to break down from a 2-year trading range.
Here is a link to the the text...
READ MORE
MEMBERS ONLY

Inflation Hedge Assets Continue to Break to the Downside
by Martin Pring,
President, Pring Research
* Outside day hints that the short-term downtrend for bonds may be over.
* Dollar Index may be completing an inverse head and shoulders.
* Stronger dollar forces gold to test its lows.
* Stronger dollar causes gold to break down from a 2-year trading range.
Here is a link to the video version...
READ MORE
MEMBERS ONLY

MARKET INDEXES BREAK MORE RESISTANCE BARRIERS -- SMALLER STOCKS SHOW RELATIVE STRENGTH -- BREADTH FIGURES ALSO SHOW IMPROVEMENT -- BUT DEFENSIVE STOCKS STILL SHOW MARKET LEADERSHIP -- TREASURIES SLIDE AS HIGH YIELD BONDS JUMP
by John Murphy,
Chief Technical Analyst, StockCharts.com
S&P 500 HITS NEW OCTOBER HIGH ... The S&P 500 reflects continued improvement in the stock market's short-term trend. The daily bars in Chart 1 show the SPX climbing above its 50-day moving average (blue line) and chart resistance at its early October intra-day peak...
READ MORE
MEMBERS ONLY

VIX TRIGGERS THIRD SIGNAL OF 2014 -- KRE AND IWM CHALLENGE ANOTHER SUPPORT BREAK -- SOME REFINERS SHOW RELATIVE STRENGTH WITHIN ENERGY SECTOR -- TESORO AND PHILLIPS BOUNCE OFF KEY RETRACEMENTS -- REFINERS ON THE RELATIVE ROTATION GRAPH
by John Murphy,
Chief Technical Analyst, StockCharts.com
VIX TRIGGERS THIRD SIGNAL OF 2014... Link for today's video. The S&P 500 Volatility Index ($VIX) is largely a coincident indicator that rises when the S&P 500 falls and falls when the S&P 500 rises. As with the S&P 500,...
READ MORE
MEMBERS ONLY

CONSUMER STAPLES AND UTILITIES SPDRS SURGE TO NEW HIGHS -- OIL ETFS BREAK PENNANT LINES -- XOP AND XES FOLLOW OIL LOWER -- INITIAL CLAIMS AND INDUSTRIAL PRODUCTION FAVOR LESS QE -- TIP SHOWS INFLATIONARY PRESSURES DECREASING
by John Murphy,
Chief Technical Analyst, StockCharts.com
CONSUMER STAPLES AND UTILITIES SPDRS SURGE TO NEW HIGHS... Link for today's video. The defensive sectors took the lead on Monday with the Consumer Staples SPDR (XLP) and the Utilities SPDR (XLU) hitting fresh 52-week highs. Relative strength and upside leadership in these two sectors shows a preference...
READ MORE
MEMBERS ONLY

THE KEY TO THE UPSWING IN IWM -- RAFF REGRESSION CHANNEL DEMO -- BREADTH THRUST IS BULLISH UNTIL IT ISN'T -- ELEMENTS OF RISK AVERSION REMAIN -- MEDICAL DEVICES ETF CHALLENGES PRIOR HIGHS -- OIL AND GASOLINE CONSOLIDATE WITHIN DOWNTRENDS
by John Murphy,
Chief Technical Analyst, StockCharts.com
THE KEY TO THE UPSWING IN IWM (RAFF REGRESSION CHANNEL DEMO)... Link for today's video. Chart 1 shows the Russell 2000 iShares (IWM) with Raff Regression Channels marking the swings over the last six months. The overall trend is down because the ETF formed a lower high in...
READ MORE
MEMBERS ONLY

MARKET RALLY CONTINUES -- RAILS LEAD TRANSPORTS HIGHER -- MMM LEADS INDUSTRIAL SPDR ABOVE 50-DAY LINE -- SMALL CAPS ALSO IMPROVE -- DIVIDEND PAYERS ATTRACT BUYERS ON FALLING BOND YIELDS -- VIX PLUNGES BACK BELOW 20 -- OVERSOLD FOREIGN SHARES REBOUND
by John Murphy,
Chief Technical Analyst, StockCharts.com
RAILS LEAD TRANSPORTS HIGHER ... Not only are stocks extending their recent rally with a strong day, they're being led higher by economically-sensitive groups like transports. The daily bars in Chart 1 show the Dow Jones Transportation Average trading 2% higher today and trading above its 50-day moving average....
READ MORE
MEMBERS ONLY

Bearish Candle Patterns Indicate a Test of Last Week's Lows are Likely
by Martin Pring,
President, Pring Research
* Short-term momentum is still oversold, so a rally is probable once the expected test is over.
* Any rally likely to be part of an overall topping out process.
* Europe experiences primary trend sell signal.
* Japanese and Asian Ex Japan ETF’s look vulnerable from a long-term aspect.
This week we...
READ MORE
MEMBERS ONLY

MEASURING RISK APPETITE WITH MICRO-CAPS -- RUSSELL 2000 ISHARES RE-CAPTURES ONE BREAK -- CONSUMER DISCRETIONARY AND INDUSTRIALS SECTORS LEAD THE REBOUND -- ITB FORMS A BIG REVERSAL ON BIG VOLUME -- OIL SERVICE ETF FIRMS AFTER SELLING CLIMAX
by John Murphy,
Chief Technical Analyst, StockCharts.com
MEASURING MICRO-CAPS FOR RISK APPETITE... Link for today's video. The Russell Micro-Cap iShares (IWC) is an important ETF to watch because it represents the appetite for the riskiest stocks in the market. Small-cap stocks are deemed riskier than large-caps and micro-cap stocks are deemed riskier than small-caps. Micro-caps...
READ MORE
MEMBERS ONLY

SPY GETS STUCK BETWEEN A GAP AND A HARD PLACE -- FALLING YIELD CURVE WEIGHS ON REGIONAL BANKS -- RETAILER SPDR STRUGGLES TO STAY POSITIVE -- TWO DISCOUNTERS SHOW RELATIVE STRENGTH -- WATCHING MACY'S AND NORDSTROM FOR CLUES
by John Murphy,
Chief Technical Analyst, StockCharts.com
SPY GETS STUCK BETWEEN A GAP AND A HARD PLACE... Link for today's video. Chart 1 shows the S&P 500 SPDR (SPY) forging a short-term reversal last week. Notice how the ETF gapped below 187 on Wednesday, stalled for two days and then gapped above 187...
READ MORE
MEMBERS ONLY

CRB INDEX TESTS MAJOR SUPPORT -- BOND SURGE SHOWS EXHAUSTION -- JUMP IN HIGH YIELD BONDS IS ENCOURAGING -- S&P 500 BOUNCES FROM OVERSOLD CONDITION -- BUT MORE TESTING MAY BE NEEDED -- SMALL CAP RALLY FADES ON FRIDAY
by John Murphy,
Chief Technical Analyst, StockCharts.com
CRB INDEX IS TESTING MAJOR SUPPORT... I'm starting today's message with a look at commodity prices because they've been the focus of a lot of attention of late. That's because falling commodity prices are deflationary in nature, which is something central bankers...
READ MORE
MEMBERS ONLY

S&P 500 HITS LONG VOLUME-BY-PRICE BAR -- S&P MIDCAP 400 FULFILLS DOUBLE TOP TARGET -- SMALL-CAP PRICE RELATIVE BOUNCES -- SECTOR ROTATIONS FAVOR DEFENSIVE SECTORS -- TWO SMALL-CAP SECTORS TO WATCH -- PLUNGE IN SHORT-TERM RATES SHOWS FLIGHT TO SAFETY
by John Murphy,
Chief Technical Analyst, StockCharts.com
S&P 500 HITS LONG VOLUME-BY-PRICE BAR... On an intraday basis, the S&P 500 fell around 10% from its summer high to the mid October low. Even though a 10% decline may seem drastic, it still pales relative to the 50% advance from the November 2012 low...
READ MORE
MEMBERS ONLY

That Was Probably It....For The Time Being
by Martin Pring,
President, Pring Research
* Short-term indicators continue to decline, but Wednesday’s price action may cause them to go bullish.
* Small caps starting to emerge as leaders on the upside (At least for the short-term).
* Quality bonds experience probable upside blow-off and high yield exhaustion on the downside .
Earlier in the week I pointed...
READ MORE
MEMBERS ONLY

FOREIGN WEAKNESS FINALLY HITS U.S. STOCKS -- RISING VIX IS AT THREE-YEAR HIGH AND MAY HAVE FURTHER TO GO -- S&P 500 MAY RETEST ITS FEBRUARY LOW -- FOUR YEAR LOW IN BRENT CRUDE PULLS GERMAN BOND YIELD TO NEW RECORD LOW
by John Murphy,
Chief Technical Analyst, StockCharts.com
FOREIGN WEAKNESS FINALLY HITS THE U.S.... It took awhile for it to happen, but tumbling foreign markets have finally pulled the U.S. market into a downside correction. The three lines in Chart 1 tell the story. The blue line shows EAFE iShares (EFA) peaking at the start of...
READ MORE
MEMBERS ONLY
Shanghai Reverses Four -year Bear Market in Relative Action
by Martin Pring,
President, Pring Research
* Global equities experience long term technical damage.
* But short-term indicators are close to signaling a tradable rally.
* Bond market still looks strong.
* Gold experiences marginal upside breakout against stocks.
US Equities
Last week I described how some serious long-term technical damage had been done to global equities but that a...
READ MORE
MEMBERS ONLY

S&P 500 BREAKS KEY MOVING AVERAGE -- GOOGLE BREAKS DOWN AS APPLE HOLDS STRONG -- PLAYING THE SWINGS IN KRE AND IWC -- DECEMBER NATURAL GAS TESTS KEY LEVEL -- ENERGY-RELATED ETFS ARE THE MOST OVERSOLD -- COFFEE ETF CHALLENGES PRIOR HIGH
by John Murphy,
Chief Technical Analyst, StockCharts.com
S&P 500 BREAKS KEY MOVING AVERAGE ... Link for today's video. The S&P 500 is not in uncharted territory, but it is in territory we have not seen in some time. Chart 1 shows the index breaking below its 200-day moving average, breaking its prior...
READ MORE
MEMBERS ONLY

FOUR WAYS TO MEASURE RELATIVE PERFORMANCE -- UTILITIES SECTOR MAINTAINS WEDGE BREAKOUT -- SMALL FINANCIALS SHOW RELATIVE STRENGTH -- FINDING SECTORS THAT POINT NORTHEAST -- AVOIDING SECTORS THAT POINT SOUTHWEST
by John Murphy,
Chief Technical Analyst, StockCharts.com
SPX TESTS A KEY MOVING AVERAGE... Link for today's video. Selling pressure and volatility have dominated October, but some sectors and industry groups are holding up better than others. How can we find the strong groups and avoid the weak? The next few charts will show four methods...
READ MORE
MEMBERS ONLY

MARKETS REMAIN IN RISK-OFF MODE -- S&P 500 MOVES TOWARDS SUPPORT -- MID-CAPS BREAK SUPPORT -- SMALL-CAPS CONTINUE TO LAG -- INDUSTRIALS SPDR BREAKS KEY LEVEL -- CONSUMER DISCRETIONARY SPDR TESTS KEY LEVEL -- TECH AND FINANCE SPDRS ARE HOLDING UP THE BEST
by John Murphy,
Chief Technical Analyst, StockCharts.com
MARKETS REMAIN IN RISK-OFF MODE... Link for today's video. The markets continue to shun risk and embrace safety, which means the markets are in risk-off mode. There are several metrics to we can use for this assessment. First, small-caps have broken down and are underperforming large-caps. The S&...
READ MORE
MEMBERS ONLY
Stocks Break Down Against Bonds In A Major Way
by Martin Pring,
President, Pring Research
* Oversold short term condition could trigger a bounce... but remember this is October!
* Five year yield experiences false upside breakout. That signals lower yields
* Gold bounces from a must hold support level.
(Click here for the Video Version of this article.)
US Equities
In the last week some serious long-term...
READ MORE
MEMBERS ONLY
Stocks Break down Against Bonds in a Major Way - Video Version
by Martin Pring,
President, Pring Research
* Oversold short term condition could trigger a bounce... but remember this is October!
* Five year yield experiences false upside breakout. That signals lower yields.
* Gold bounces from a must hold support level.
Click here for the Print Version
Good luck and good charting,
Martin Pring...
READ MORE
MEMBERS ONLY

QQQ AND SPY TEST THEIR GAPS -- SMALL AND MICRO CAP ETFS FILL THEIR GAPS -- SECTOR PERFORMANCE REFLECTS DEFENSIVE MARKET -- DOLLAR AND TREASURIES ARE IN RISK OFF MODE -- 20+ YR T-BOND ETF CHALLENGES AUGUST HIGH
by John Murphy,
Chief Technical Analyst, StockCharts.com
QQQ AND SPY TEST THEIR GAPS ... Link for today's video. The S&P 500 SPDR (SPY) and Nasdaq 100 ETF (QQQ) forged intraday reversals last Thursday and followed up with gaps on Friday, but the bulls are getting cold feet already because both fell back into their...
READ MORE
MEMBERS ONLY

SEASONAL PATTERNS START TO GET INTERESTING -- LOOKING AT SMALL-CAP PERFORMANCE FOR YEAREND -- SEASONAL PATTERNS STAND OUT FOR THREE SECTORS -- NATURAL GAS TESTS SUPPORT AGAIN -- AIRLINE INDEX BOUNCES OFF SUPPORT -- DELTA AND UNITED LEAD AIRLINES
by John Murphy,
Chief Technical Analyst, StockCharts.com
SEASONAL PATTERNS START TO GET INTERESTING... Link for today's video. StockCharts users can analyze seasonal patterns using the Seasonality Tool. This tool creates a histogram chart showing the percentage of times a security gained and the average gain/loss overall. Before getting into the current seasonal patterns, note...
READ MORE
MEMBERS ONLY

S&P 500 MAINTAINS ITS LONG-TERM UPTREND -- CONSUMER DISCRETIONARY SECTOR ETFS TESTS KEY LEVEL -- MACY'S, NORDSTROM AND TJX LEAD RETAILERS HIGHER -- WHEN IS OVERSOLD REALLY OVERSOLD? -- USING PPO AND RSI FOR TO DEFINE OVERSOLD
by John Murphy,
Chief Technical Analyst, StockCharts.com
S&P 500 MAINTAINS ITS LONG-TERM UPTREND... Link for today's video. Even though the S&P Small-Cap 600 and S&P MidCap 400 are underperforming and have stalled for several months, the S&P 500 remains in a clear uptrend and over 50 points...
READ MORE
MEMBERS ONLY

SMALL CAPS TEST NECKLINE OF POSSIBLE H&S TOP -- MIDCAP INDEX IS IN DANGER OF BREAKING AUGUST LOW -- SO IS THE NYSE COMPOSITE INDEX -- THE U.S. IS BEING LED LOWER BY FOREIGN SHARES -- THE DOLLAR RALLY MAY BE JUST STARTING
by John Murphy,
Chief Technical Analyst, StockCharts.com
SMALL CAP HEAD AND SHOULDERS TOP?... A debate is going on within the technical community as to whether or not the Russell 2000 Small Cap Index is in danger of completing a "head and shoulders top". A case can certainly made for it, although it would be an...
READ MORE
MEMBERS ONLY

SMALL CAPS BREAK SUPPORT -- MIDCAPS MAY BE NEXT -- DOW AND S&P 500 BREAK 50-DAY AVERAGES -- AIRLINES LEAD TRANSPORTS LOWER AS UTILITIES RALLY WITH BONDS -- EMERGING BONDS FALL ON RISING DOLLAR
by John Murphy,
Chief Technical Analyst, StockCharts.com
SMALL CAPS FALL BELOW AUGUST LOW -- MIDCAPS MAY BE NEXT... Arthur Hill and myself have been warning of a potential breakdown in smaller stocks, and the potential damage that could do to the rest of the stock market. That situation has gotten even worse. Chart 1 shows the Russell...
READ MORE
MEMBERS ONLY
Silver Breaks to the Downside in a Big Way
by Martin Pring,
President, Pring Research
* Negative divergences in the equity market continue to build.
* The rest of the world (EFA) completes a head and shoulders top.
* Credit spreads continue to deteriorate.
* Some commodity indexes break down in a major way, others hold fast.
US Equities
In our last issue my basic conclusion on equities was...
READ MORE
MEMBERS ONLY

UTILITIES SECTOR RETURNS TO THE LEADERBOARD -- APPLE, AT&T AND VERIZON HOLD STRONG -- SCANNING FOR RELATIVE STRENGTH -- BOEING, BERRY, CALLIDUS AND VEECO MAKE THE CUT -- WHEN TO SELL OR EXIT A POSITION
by John Murphy,
Chief Technical Analyst, StockCharts.com
UTILITIES SECTOR RETURNS TO THE LEADERBOARD... Link for today's video. The Utilities SPDR (XLU) is leading the market over the last two days and its StockCharts Technical Rank (SCTR) is improving. Chart 1 shows XLU trading flat since April as it oscillated around the 42 level for several...
READ MORE
MEMBERS ONLY

DIA AND QQQ HOLD UP THE BEST -- RUSSELL 2000 VALUE UNDERPERFORMS GROWTH -- BIG BANKS LEAD, BUT REGIONAL BANKS LAG -- BIOTECHS REFUSE TO BUCKLE
by John Murphy,
Chief Technical Analyst, StockCharts.com
DIA AND QQQ HOLD UP THE BEST... Link for today's video. Most of the major index ETFs broke below their mid September lows with sharp declines last week, but the Dow Diamonds (DIA) and the Nasdaq 100 ETF (QQQ) held these lows and show relative strength. The Dow...
READ MORE
MEMBERS ONLY

HOW FAR CAN THE S&P 500 CORRECT? -- NOTHING BULLISH ON SMALL-CAP CHART -- MID-CAPS REMAIN IN THE MIDDLE -- 20+ YR T-BOND ETF BOUNCES OF KEY RETRACEMENT -- COMPARING THE 2011 DOLLAR SHOCK WITH 2014 (PERFCHART DEMO) -- OIL FIRMS WITHIN DOWNTREND
by John Murphy,
Chief Technical Analyst, StockCharts.com
HOW FAR CAN THE S&P 500 CORRECT?... Link for today's video. The S&P 500 is down less than 3% from its all time high and still in a long-term uptrend. Even though this week's decline could extend, it would take a lot...
READ MORE
MEMBERS ONLY

GLOBAL STOCKS SELL OFF IN RISING VOLUME -- A LOT OF MOVING AVERAGES HAVE BEEN BROKEN -- HIGH YIELD BOND ETF BREAKS 200-DAY LINE -- FOREIGN STOCKS FALL AS WELL -- A RISING DOLLAR IS HURTING EMERGING MARKET CURRENCIES AND STOCKS
by John Murphy,
Chief Technical Analyst, StockCharts.com
NASDAQ AND S&P 500 BREAK 50-DAY LINES... Chart 1 shows the S&P 500 SPDRS closing below its 50-day line today in heavy trading. That's a negative combination. Chart 2 shows the Nasdaq Composite Index doing the same. Their daily MACD lines remain decidedly negative....
READ MORE
MEMBERS ONLY
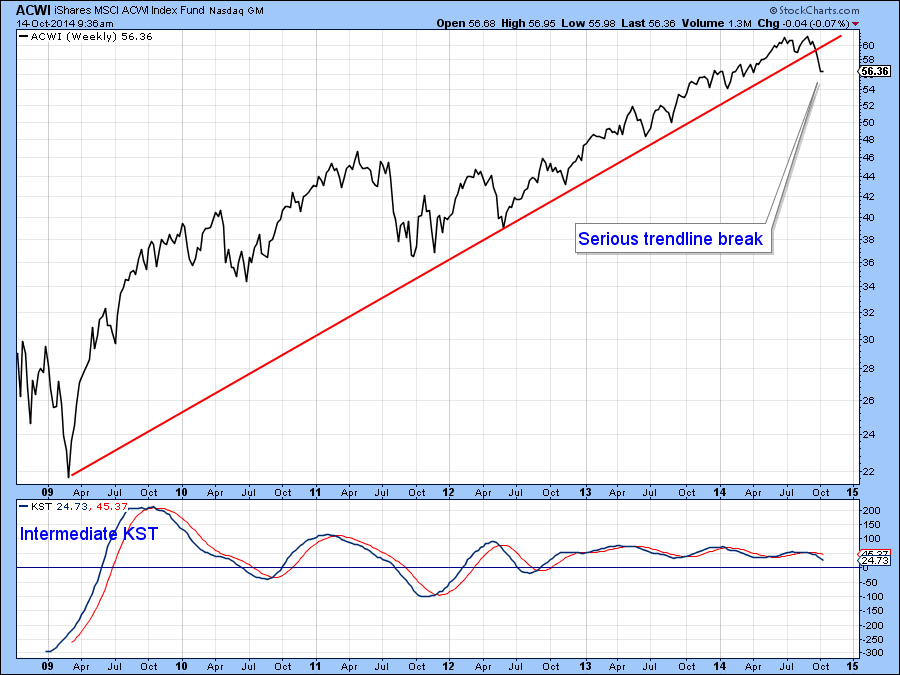
Global Equities and Some US Averages are Just Above Critical Support
by Martin Pring,
President, Pring Research
* Small cap stocks on the verge of a major breakdown.
* Gold shares violate important up trend line.
* Dollar Index due for a correction within a primary bull market.
Click here for the video version.
For the last few weeks I have been pointing out the gradually deteriorating technical position but...
READ MORE