MEMBERS ONLY

BOTH VERSIONS OF S&P 500 TRY TO HOLD SUPPORT

by John Murphy,
Chief Technical Analyst, StockCharts.com
S$P 500 TESTS TRENDLINE SUPPORT AND 200-DAY AVERAGE... Last week's message suggested that the S&P 500 was headed for a test of its 200-day moving average (red line) and a rising trendline drawn under its October/March lows. Chart 1 shows that test taking place...
READ MORE
MEMBERS ONLY
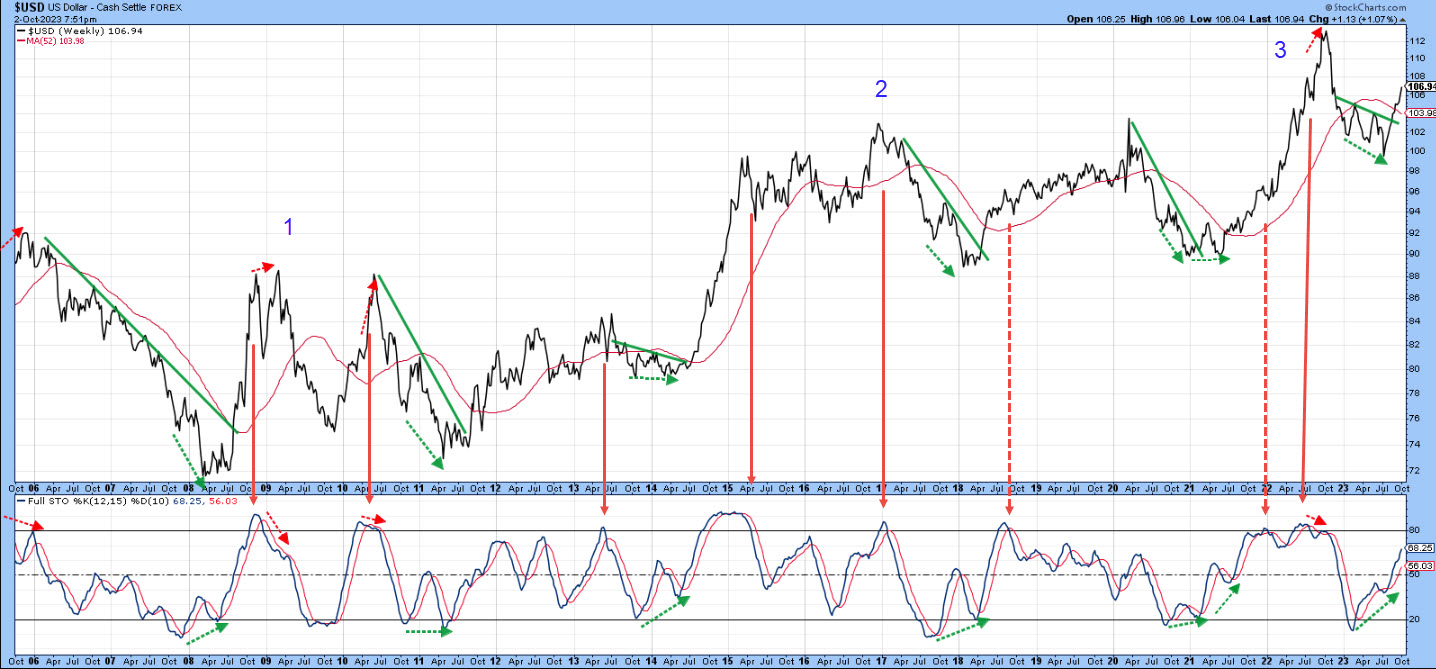
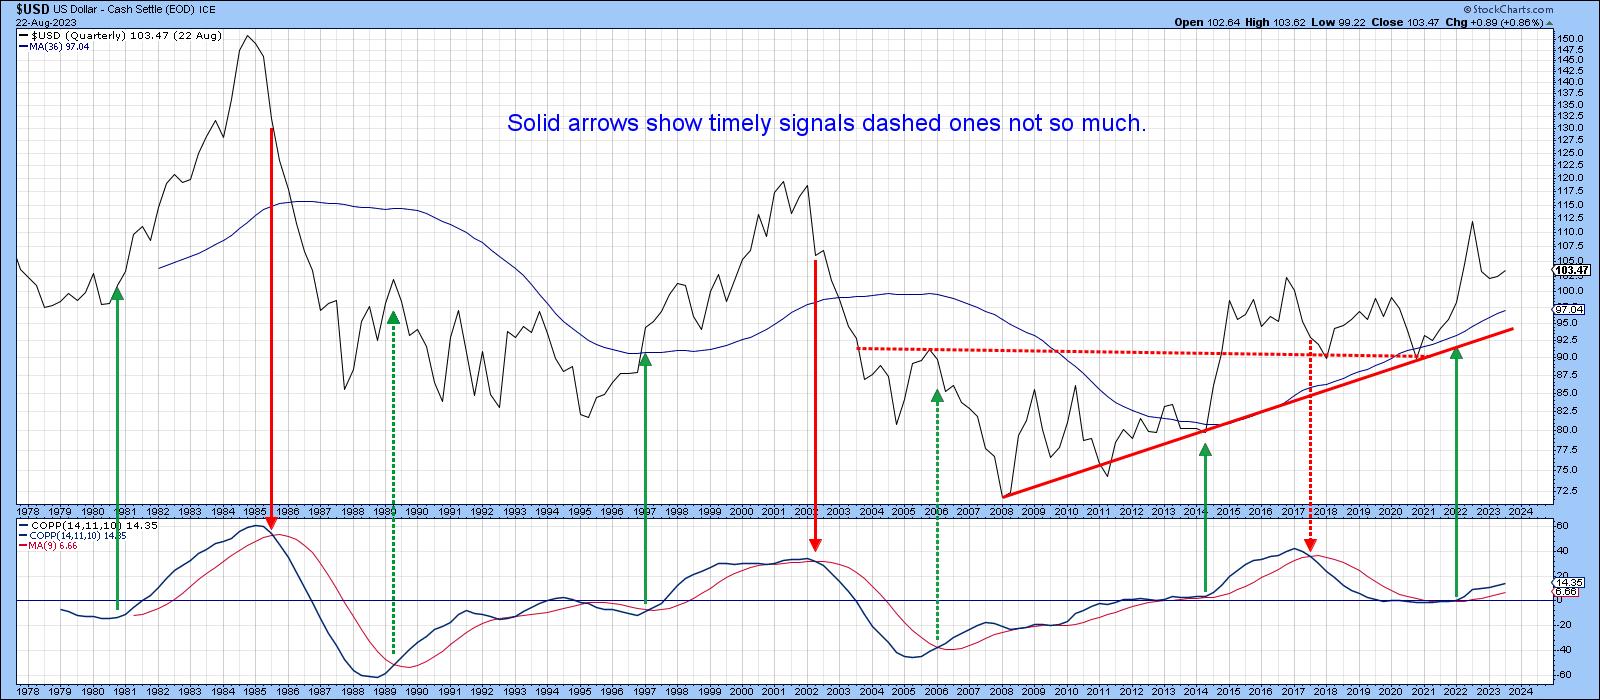
When the Dollar Stops Going Up, Will These Markets Stop Going Down?

by Martin Pring,
President, Pring Research
The Dollar Index
I last wrote an article on the dollar in August, The Dollar Index Goes to Missouri. In it, I pointed out that the Index had reached crucial resistance, which, if surpassed, would signal a new primary bull market and a likely fourth up leg to the secular...
READ MORE
MEMBERS ONLY

Focus on Stocks: October 2023

by Larry Williams,
Veteran Investor and Author
First & Foremost
I want to personally thank you for subscribing to "Focus on Stocks". I will do all I can to earn the confidence you have placed in me. -- Larry Williams
Is it a Different World?
"I have to pay attention to the implications of...
READ MORE
MEMBERS ONLY

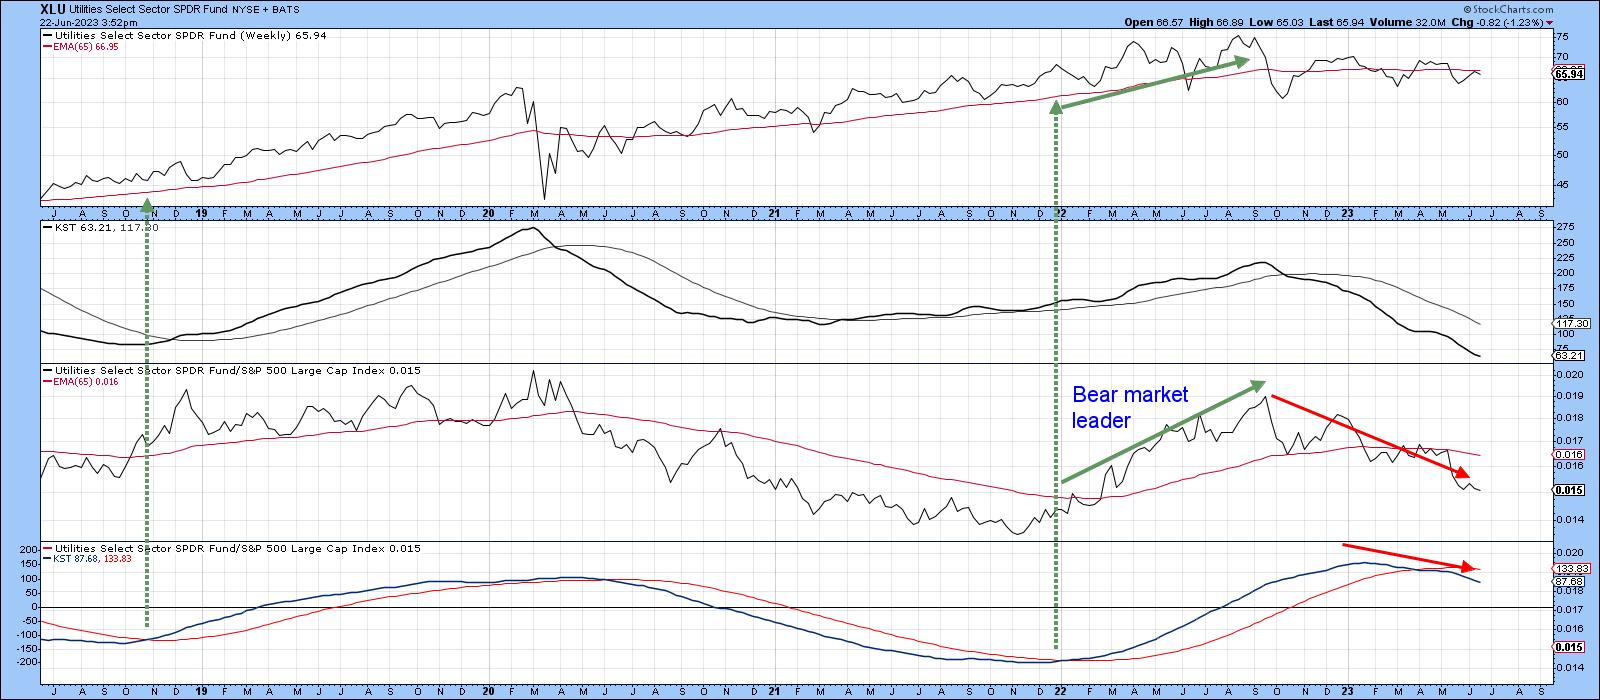
FALLING BOND PRICES ARE HURTING BOND PROXIES LIKE UTILITIES, REITS, AND CONSUMER STAPLES
by John Murphy,
Chief Technical Analyst, StockCharts.com
SEPTEMBER SECTOR RANKING... September has lived up to its reputation of being the year's weakest month. All major stock indexes have fallen during the month. And so have most S&P sectors -- except for one. Chart 1 shows energy being the only sector to end the...
READ MORE
MEMBERS ONLY
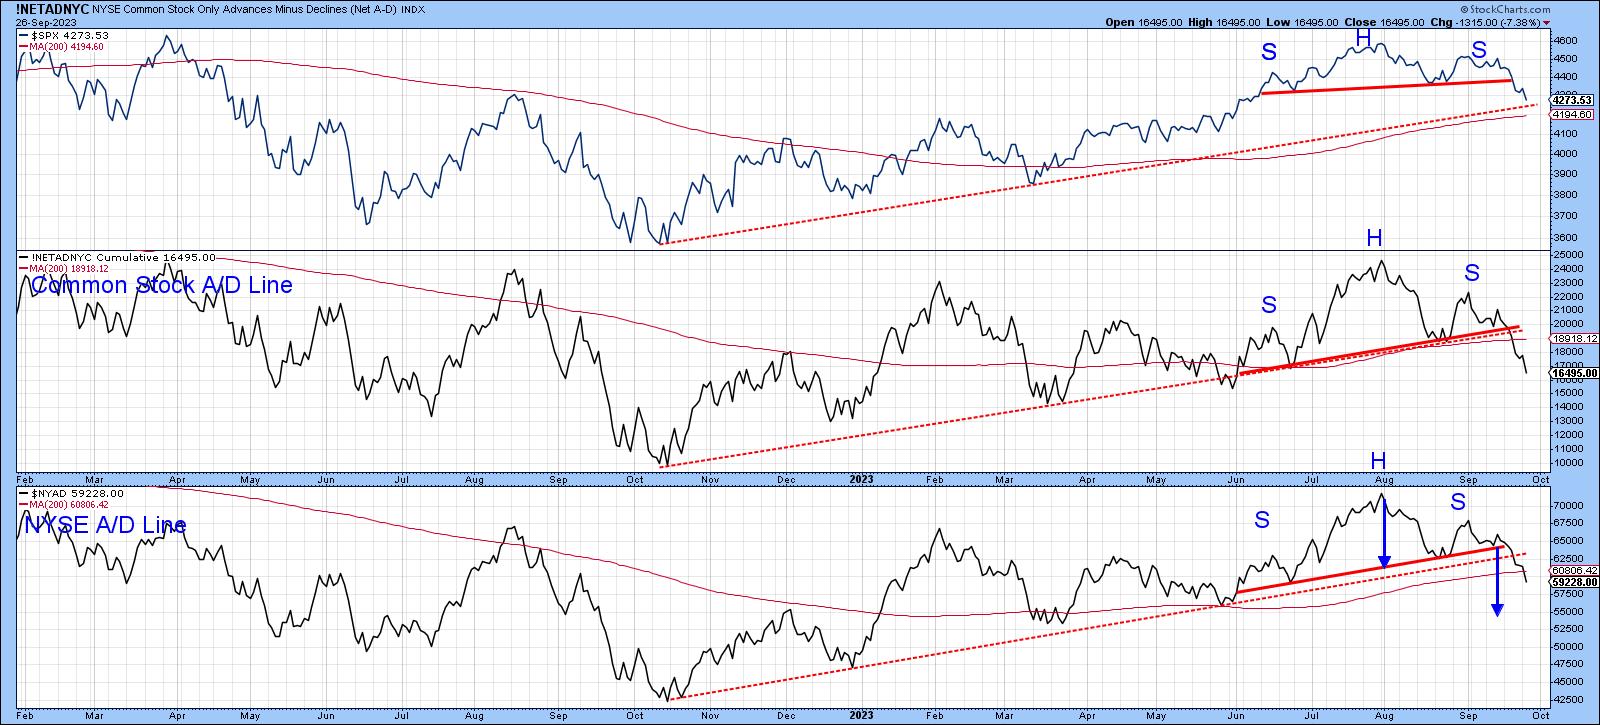
This Stock Market Looks Horrible... But...
by Martin Pring,
President, Pring Research
Chart 1 shows that the S&P Composite, like both A/D Lines, has completed and decisively broken down from a head-and-shoulders top. The two breadth indicators have also violated their bull market up trendlines. On the surface, things look pretty grim, with three seasonally weak September days left...
READ MORE
MEMBERS ONLY

SPIKE IN TEN-YEAR YIELD PUSHES STOCKS LOWER
by John Murphy,
Chief Technical Analyst, StockCharts.com
TEN-YEAR BOND YIELD HITS 16-YEAR HIGH...Recent market messages have been focusing on the upturn in energy prices which threatened to boost inflation pressures and put upward pressure on bond yields. Those same messages have shown the 10-year Treasury yield nearing an upside breakout. That breakout took place this week...
READ MORE
MEMBERS ONLY

It's Time to Get Long
by Larry Williams,
Veteran Investor and Author
As a follower of my "Focus on Stocks" blog, you know we had a signal to sell on the opening Sunday night (10th day left).
That was forecast last month... now I think it's time to start to get long.
Where? At the August lows.
When?...
READ MORE
MEMBERS ONLY
Two Charts I'm Watching Closely for Potential Breakouts
by Martin Pring,
President, Pring Research
The title of this article should really be more in the vein of two technical situations I am watching, because the long-term forces look as if they may be converging with short-term ones to form a kind of potential bullish reverse domino effect. Let's consider our first candidate,...
READ MORE
MEMBERS ONLY

Larry's "Family Gathering" Full September Webinar -- AVAILABLE NOW!
by Larry Williams,
Veteran Investor and Author
Larry's "Family Gathering" webinar is now available! Whether you missed it and need to catch up, or just want to review the information Larry presented, you can now see the full recording below.
In this special presentation, Larry coaches viewers for success and explains his strategies...
READ MORE
MEMBERS ONLY

RISING CRUDE OIL IS PUNISHING TRANSPORTS -- RISING BOND YIELDS MAY THREATEN TECH STOCKS
by John Murphy,
Chief Technical Analyst, StockCharts.com
RISING OIL PRICES HURT TRANSPORTS... Transportation stocks are one of the groups most sensitive to the direction of energy prices. That makes sense since fuel is so important to their bottom line. And not surprisingly, they've been one of the market's weakest groups over the last...
READ MORE
MEMBERS ONLY
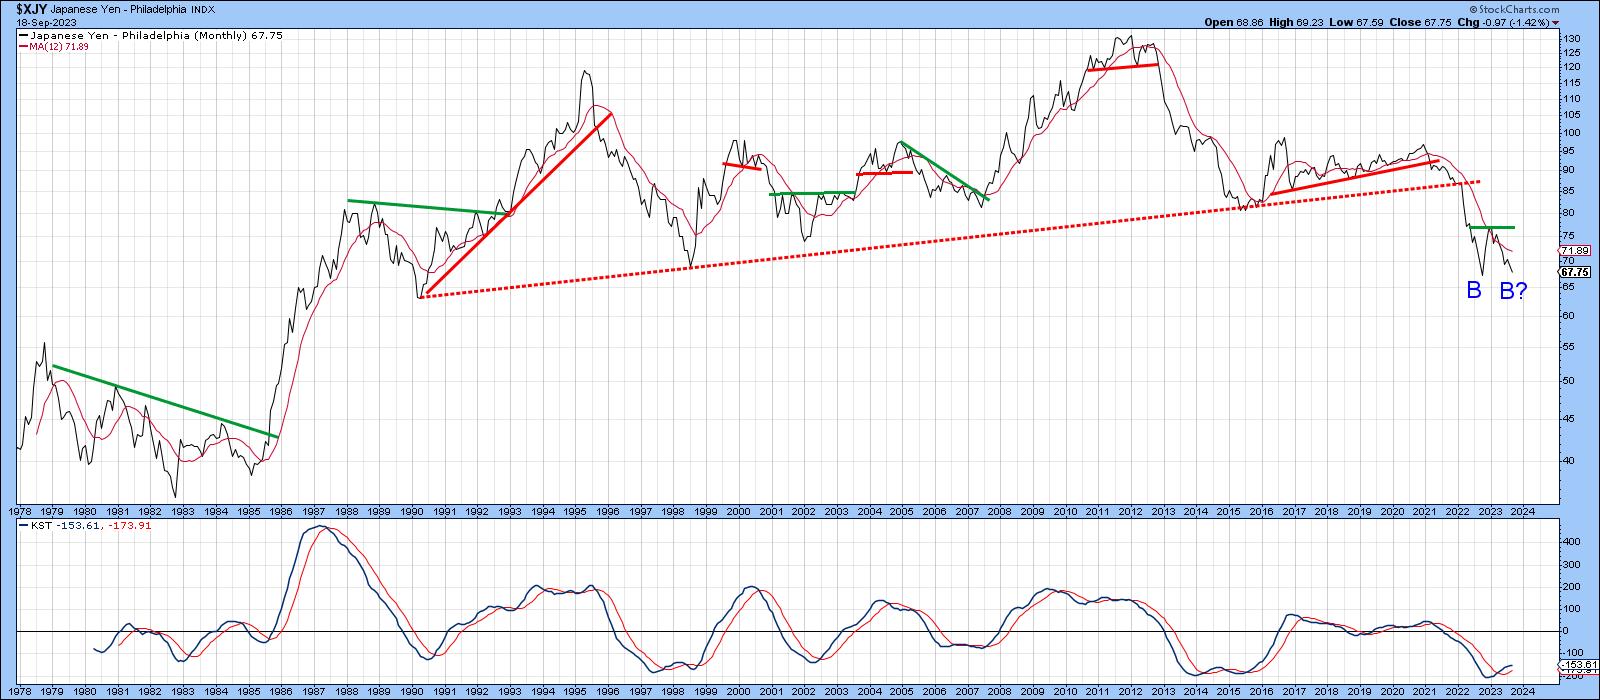
This Sector Looks Really Sick Long-Term
by Martin Pring,
President, Pring Research
The overall market has been rallying since registering its low last October. However, there is one sector which, in August, fell below its October low on a monthly closing basis. More serious is the fact that it recently violated a 23-year secular up trendline. Can you guess which sector I...
READ MORE
MEMBERS ONLY
Larry's LIVE "Family Gathering" Webinar Airs THIS WEEK - Thursday, September 14th at 3:00pm EDT!
by Larry Williams,
Veteran Investor and Author
Larry is going LIVE! Don't miss the upcoming "Family Gathering" webinar with Larry Williams, airing live through Zoom this Thursday, September 14th at 3:00pm EDT.
In this must-see event, Larry will be presenting his current opinions on a broad variety of current market topics, directly...
READ MORE
MEMBERS ONLY

ENERGY SPDR HITS RECORD HIGH AS OIL BREAKS OUT -- THAT COULD BE BAD FOR BONDS AND STOCKS
by John Murphy,
Chief Technical Analyst, StockCharts.com
ENERGY BREAKOUTS... Several previous messages have talked about upside breakouts taking place in energy stocks. And that trend has only gotten stronger both in the stocks and the commodity. The upper box in Chart 1 shows the price of WTIC crude oil rising to the highest level since last November....
READ MORE
MEMBERS ONLY
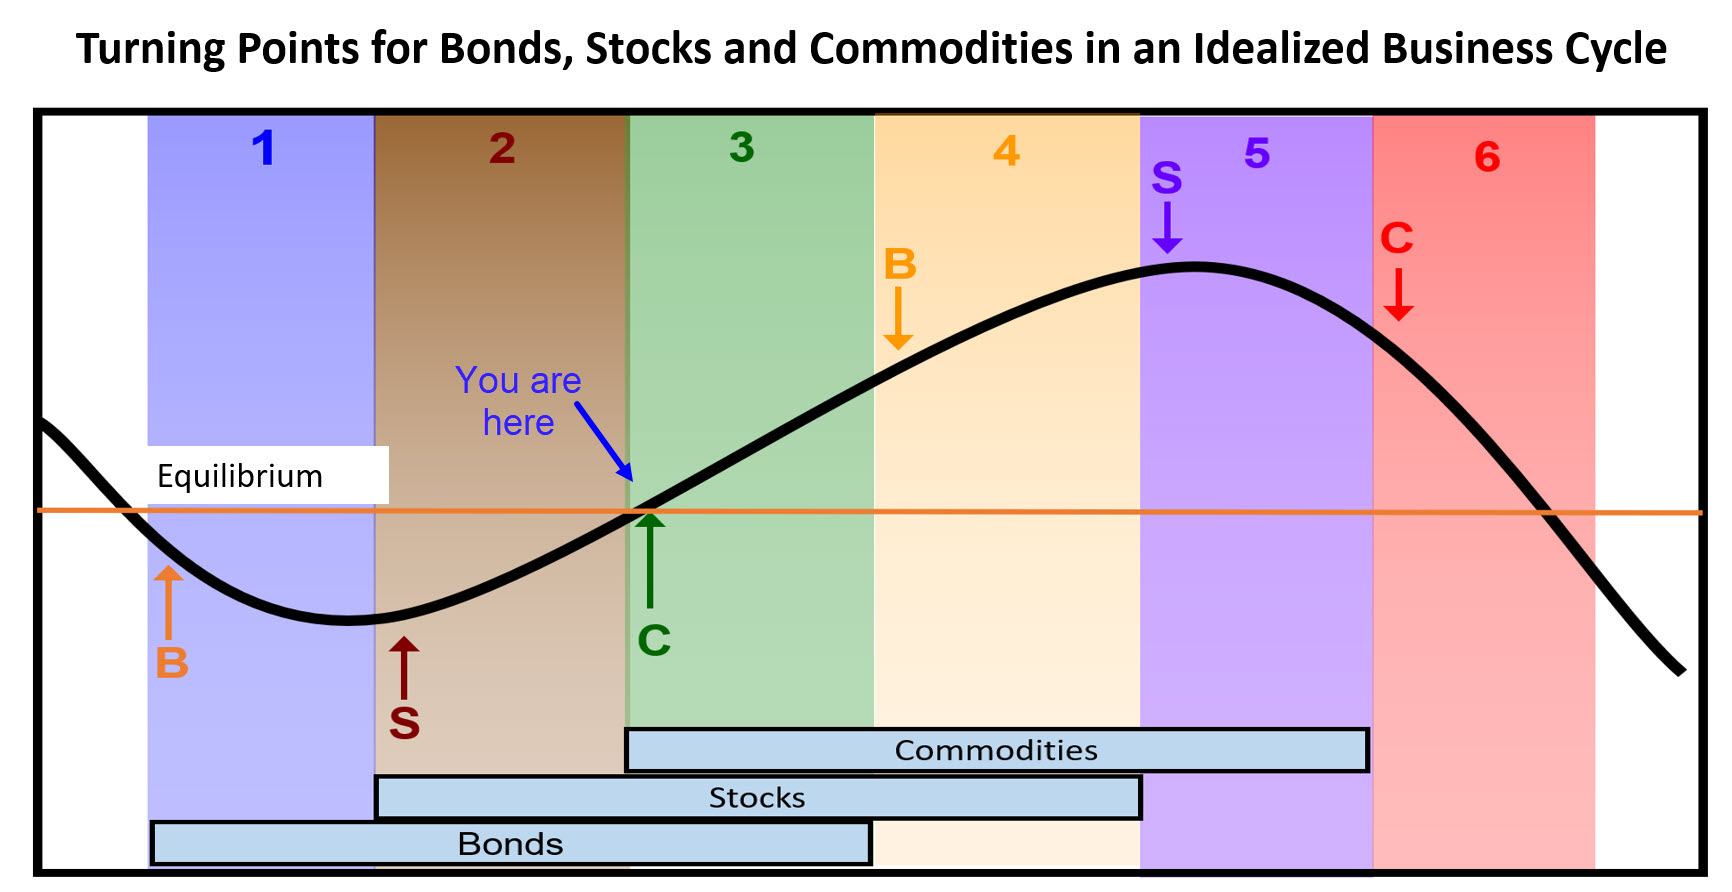
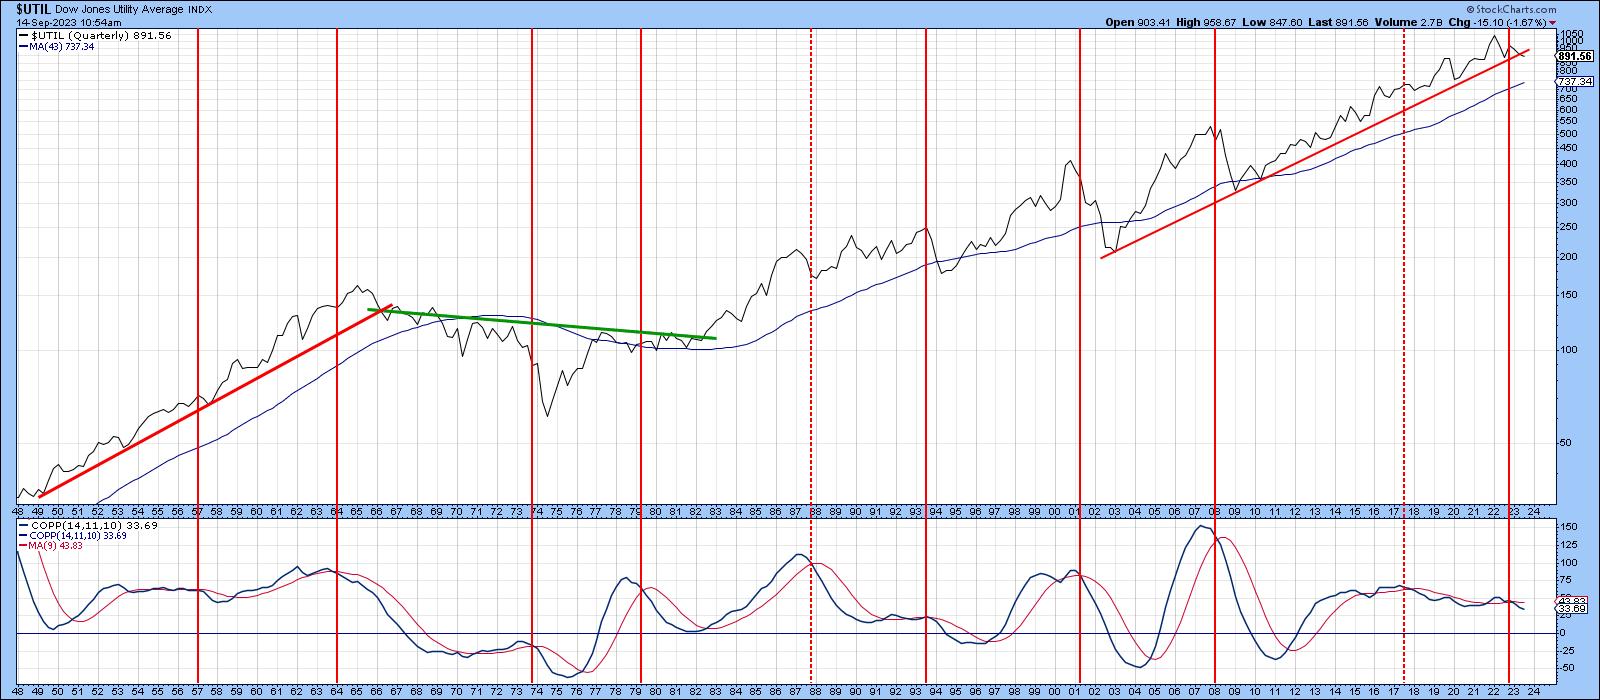
Some Investment Implications for Stage 3 of the Business Cycle
by Martin Pring,
President, Pring Research
The business cycle has been with us for as long as reliable financial records have been available, and that's at least 200 years. It may seem to be a mysterious force, but it is nothing more than a set sequence of chronological events that just keeps repeating. The...
READ MORE
MEMBERS ONLY

Focus on Stocks: September 2023
by Larry Williams,
Veteran Investor and Author
Cycle Deep Dive
At times, it seems there are as many cycles as there are traders. I have been focusing on the shorter-term ones, those ranging from 2 to 5 years.
Recently, I pondered on the clear fact that cycle forecasts work far better to spot market bottoms than tops....
READ MORE
MEMBERS ONLY

Positive Confidence Ratios Argue for Higher Stocks
by Martin Pring,
President, Pring Research
KEY TAKEAWAYS
* Comparing risky asskets with more conservative ones can reflect investor confidence
* Negative divergences offer subtle indications of a deterioration of a stock market rally
* An upward trend indicates that investor confidence is positive
Traders and investors pay a lot of attention to surveys to assess swings in sentiment,...
READ MORE
MEMBERS ONLY

ANOTHER LOOK AT MARKET BREADTH
by John Murphy,
Chief Technical Analyst, StockCharts.com
ADVANCE-DECLINE LINE BOUNCING... A glance at various measures of market breadth offers good and bad news. All of them are lagging behind the S&P 500 which is a caution sign. The good news is that they're bouncing off potential support lines. Chart 1 compares the S&...
READ MORE
MEMBERS ONLY
The Dollar Index Goes to Missouri
by Martin Pring,
President, Pring Research
The Dollar Index has experienced a nice rally since mid-July and now reached important resistance. It's time to show us whether it can push through, thereby signaling an important extension to the recent advance. Before we examine that possibility, however, let's briefly take a step backwards...
READ MORE
MEMBERS ONLY

TEN-YEAR BOND YIELD NEARS UPSIDE BREAKOUT -- NEXT UPSIDE TARGET COULD BE 2007 HIGH
by John Murphy,
Chief Technical Analyst, StockCharts.com
TEN-YEAR YIELD TESTING OCTOBER HIGH... Last week's message suggested that rising bond yields (along with rising energy prices) was one of the factors that could push an overbought stock market into a downside pullback. More on that shortly. The big story of the week, however, was how much...
READ MORE
MEMBERS ONLY
Larry's "Family Gathering" Full Webinar -- AVAILABLE NOW!
by Larry Williams,
Veteran Investor and Author
Larry's "Family Gathering" webinar is now available! Whether you missed it and need to catch up, or just want to review the information Larry presented, you can now see the full recording below.
In this special presentation, Larry discusses market cycles in detail, outlines his proprietary...
READ MORE
MEMBERS ONLY
Larry's LIVE "Family Gathering" Webinar Airs THIS WEEK - Thursday, August 17th at 4:00pm EDT!
by Larry Williams,
Veteran Investor and Author
Larry is going LIVE! Don't miss the upcoming "Family Gathering" webinar with Larry Williams, airing live through Zoom this Thursday, August 17th at 4:00pm EDT.
In this must-see event, Larry will be presenting his current opinions on a broad variety of current market topics, directly...
READ MORE
MEMBERS ONLY
Is this a Normal Correction? Or Could It Be the Start of Something Much Bigger?
by Martin Pring,
President, Pring Research
The recent rise in interest rates and energy prices is certainly a cause for concern should these trends extend in any meaningful way over the next few months. After all, we are just about to enter September, which is seasonally the worst month of the year for stocks. Following that,...
READ MORE
MEMBERS ONLY

RISING ENERGY PRICES AND RISING BOND YIELDS MAY THREATEN OVERBOUGHT STOCK MARKET
by John Murphy,
Chief Technical Analyst, StockCharts.com
RISING ENERGY PRICES MAY BOOST YIELDS... This week's inflation reports sent a mixed message. July's CPI came in lower while July's PPI came in higher. Bond yields, however, gained more ground. The green bars in the upper box in Chart 1 show the 10-Year...
READ MORE
MEMBERS ONLY

Will the Test of Last October's High for Bond Yields be Successful?
by Martin Pring,
President, Pring Research
The 30-year yield reached its high point last October and has been rangebound since December. Chart 1 shows that it began to break out of that trading range in late July, but has yet to succeed in taking out the October high. The 14-day RSI is currently correcting from an...
READ MORE
MEMBERS ONLY

ENERGY SECTOR IS BREAKING OUT TO THE UPSIDE -- RISING PRICES CARRY GOOD AND BAD NEWS
by John Murphy,
Chief Technical Analyst, StockCharts.com
UPSIDE ENERGY BREAKOUTS...Last week's message listed energy as the strongest market sector over the last week and month. That positive trend continued this past week with some upside breakouts taking place. Chart 1 shows the United States Oil Fund (USO) trading above its April high. WTIC hasn&...
READ MORE
MEMBERS ONLY

Focus on Stocks: August 2023
by Larry Williams,
Veteran Investor and Author
Hi Gang.
Larry Williams here. Welcome to my new stock market service called "Focus On Stocks," which I'm creating in conjunction with my friends at StockCharts.com.
As a "Focus On Stocks" subscriber, you now have access to my latest market analysis. Be sure...
READ MORE
MEMBERS ONLY
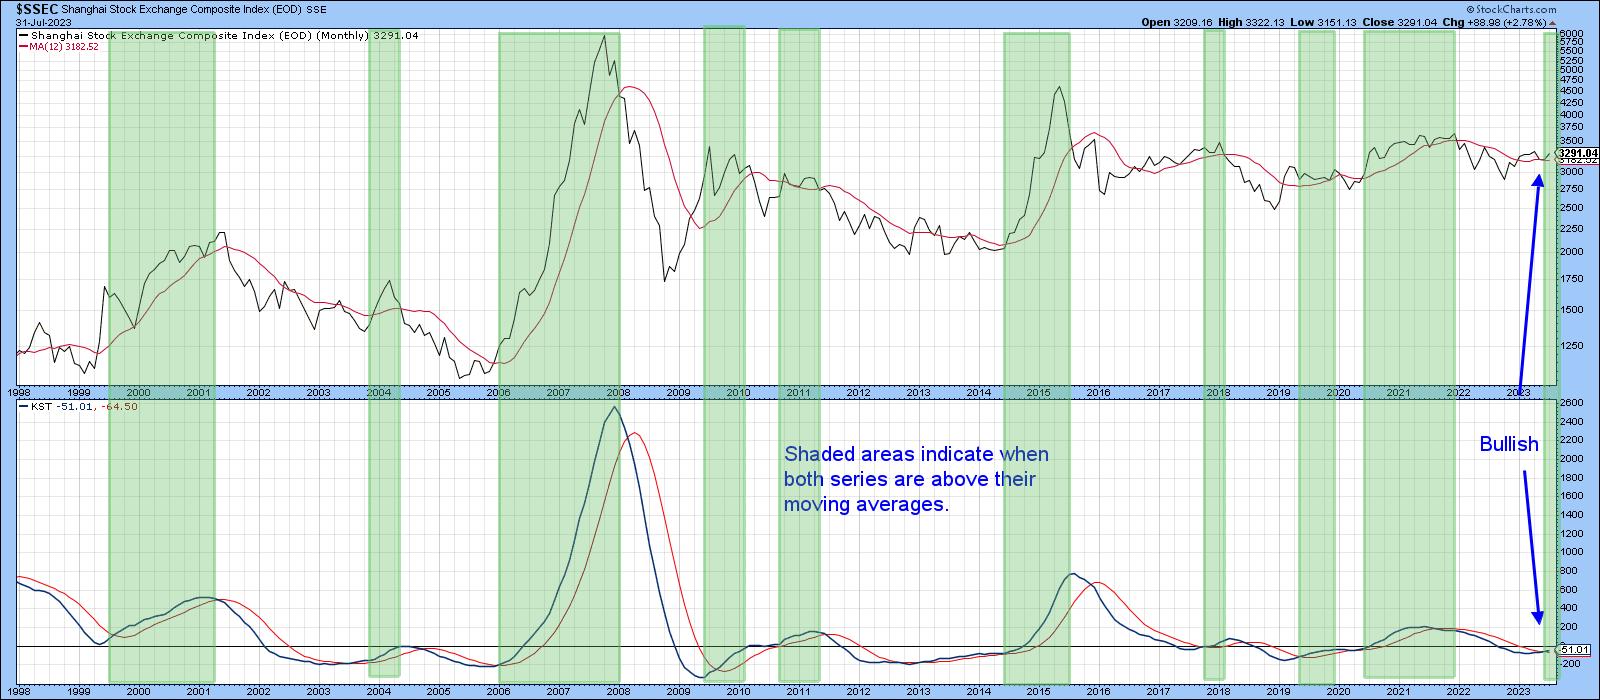
It's Time for These Chinese ETFs to Play Catch-Up
by Martin Pring,
President, Pring Research
There have recently been a lot of depressing stories concerning the state of the Chinese economy. Here are a spattering of headlines that appeared just today:
* China's Economic Recovery Weakens as Growth Concerns Linger (WSJ)
* China Manufacturing Keeps Shrinking, Weighing on Economic Recovery (Bloomberg)
* More Stimulus "Desperately...
READ MORE
MEMBERS ONLY

MARKET BREADTH IMPROVES -- SMALL CAPS TEST RESISTANCE -- ENERGY AND MATERIALS HAVE STRONG MONTH
by John Murphy,
Chief Technical Analyst, StockCharts.com
NYSE ADVANCE-DECLINE LINE BREAKS OUT... Stocks gained more ground this week to continue their uptrend. What's helping keep the rally going is the fact that more individual stocks are joining the uptrend. Chart 1 shows the NYSE Advance-Decline line rising above several previous peaks to the reach the...
READ MORE
MEMBERS ONLY

The Banking Crisis is Over... Or Is It?
by Martin Pring,
President, Pring Research
Last April, I wrote about the SVB (SVIB) banking crisis, using the KBW Regional Banking Index ($KRX) as a proxy, and suggested the price action in the right hand part of Chart 1 had the potential to be a double bottom formation. Double bottoms are characterized by heavy activity on...
READ MORE
MEMBERS ONLY

HEALTHCARE SECTOR NEARS UPSIDE BREAKOUT-- LED BY UNITEDHEALTH, JNJ, AND ABBOTT LABS
by John Murphy,
Chief Technical Analyst, StockCharts.com
MONEY ROTATES INTO HEALTHCARE... One of the most encouraging developments over the last month has been the rotation into formerly lagging sectors like industrials, financials, and materials. That rotation also includes this week's upside breakout in the Dow Industrials to the highest level in more than a year....
READ MORE
MEMBERS ONLY
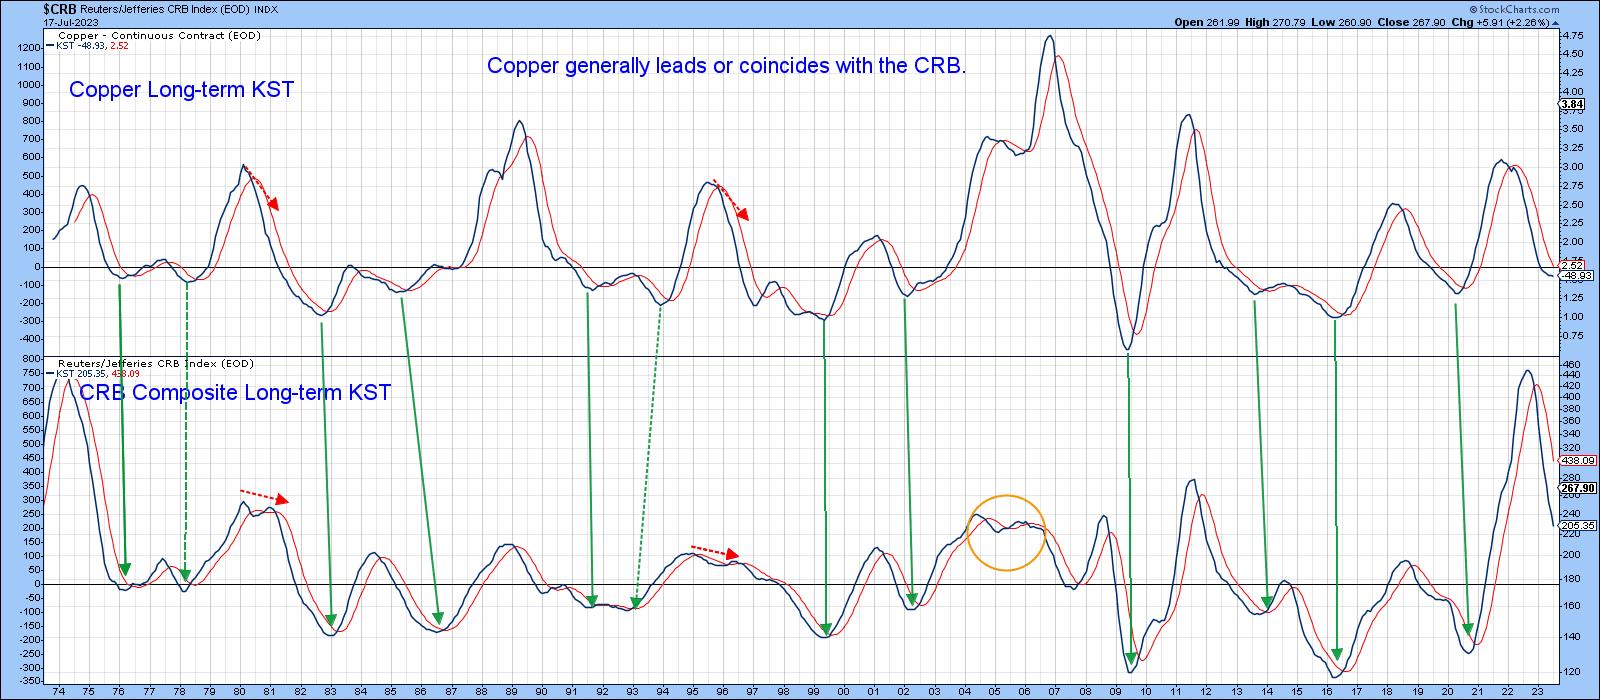
Taking a Deep Dive Into Dr. Copper and What it Means
by Martin Pring,
President, Pring Research
Last week, I pointed out that several indicators were close to triggering a bull market for commodities. Some of those benchmarks have since been met, but none have yet moved decisively in that direction. Now, it's time to take a deep dive into the copper price, as this...
READ MORE
MEMBERS ONLY
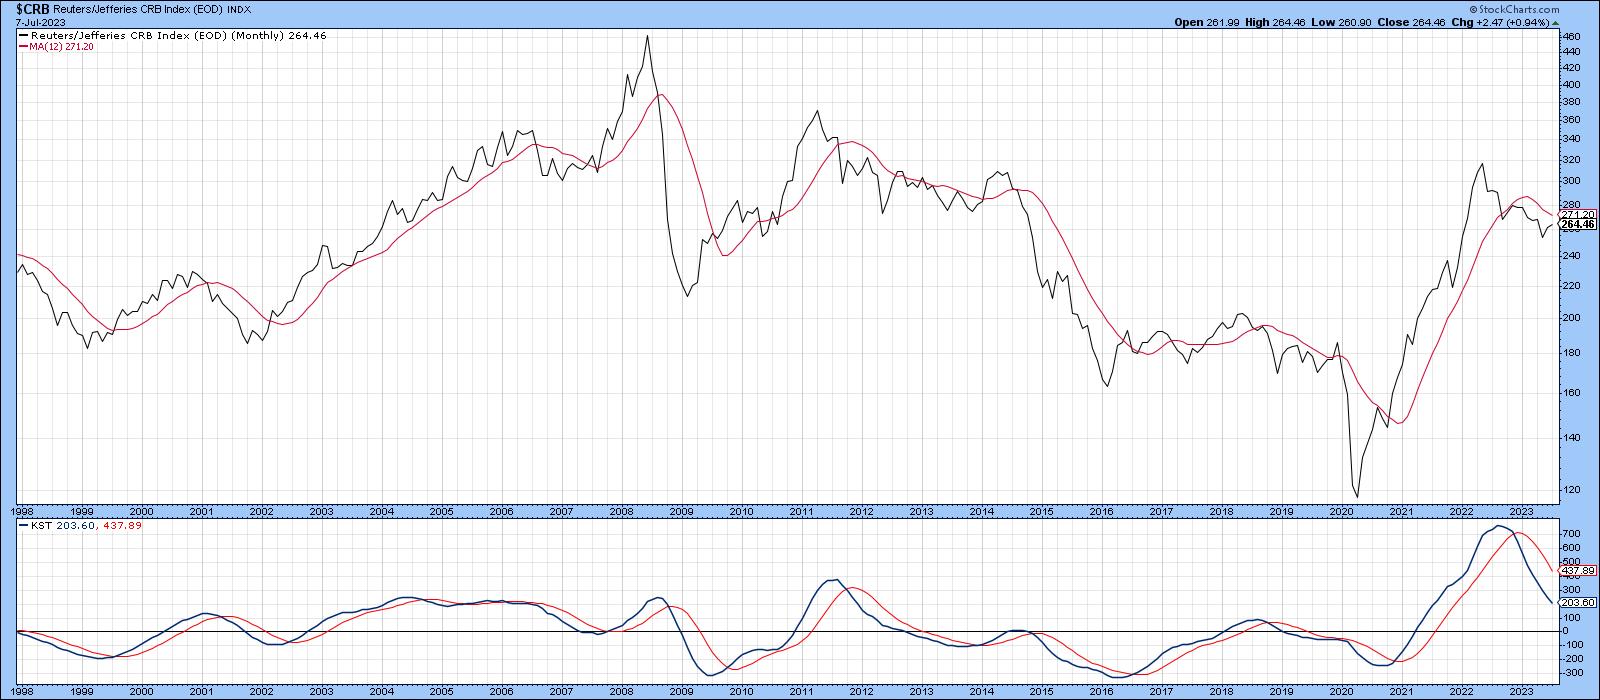
Commodities are in a Bear Market, But These Indicators Say That Could Soon Change
by Martin Pring,
President, Pring Research
I have been bearish on the primary trend of commodities for some time whilst still maintaining a bullish stance on their secular or very long-term trend. In other words, negative over a 9-month-to-2-year outlook, but constructive on a 10-to-20-year one. The secular aspect is important, because history shows primary bear...
READ MORE
MEMBERS ONLY

OIL SERVICE STOCKS LEAD ENERGY SECTOR HIGHER
by John Murphy,
Chief Technical Analyst, StockCharts.com
ENERGY SECTOR LOOKS OVERSOLD... Energy stocks have been one of the year's weakest sectors. The daily bars in Chart 1 show the Energy SPDR (XLE) trading sideways since March and looking oversold. The XLE would need to clear its red 200-day average and falling trendline to signal a...
READ MORE
MEMBERS ONLY
Why Rising Short Rates Could be Bullish for Stocks
by Martin Pring,
President, Pring Research
There has been a notable shift in expectations concerning rate hikes going forward, as several Fed spokesmen have floated the idea of additional hikes later in the year. Rising interest rates are generally seen as a negative factor for stocks, as they increase borrowing costs for companies, lowering their profitability...
READ MORE
MEMBERS ONLY

ECONOMICALLY-SENSITIVE STOCKS OUTPERFORM -- MATERIALS ON VERGE OF UPSIDE BREAKOUT
by John Murphy,
Chief Technical Analyst, StockCharts.com
TRANSPORTS GAIN, UTILITIES LOSE... Chart 1 shows transportation stocks rising while utilities are falling. The significance of the chart is that it suggests that investors are turning more positive. That's because stronger transports suggest a stronger economy while falling utilities show that investors are turning less defensive. Airlines...
READ MORE
MEMBERS ONLY
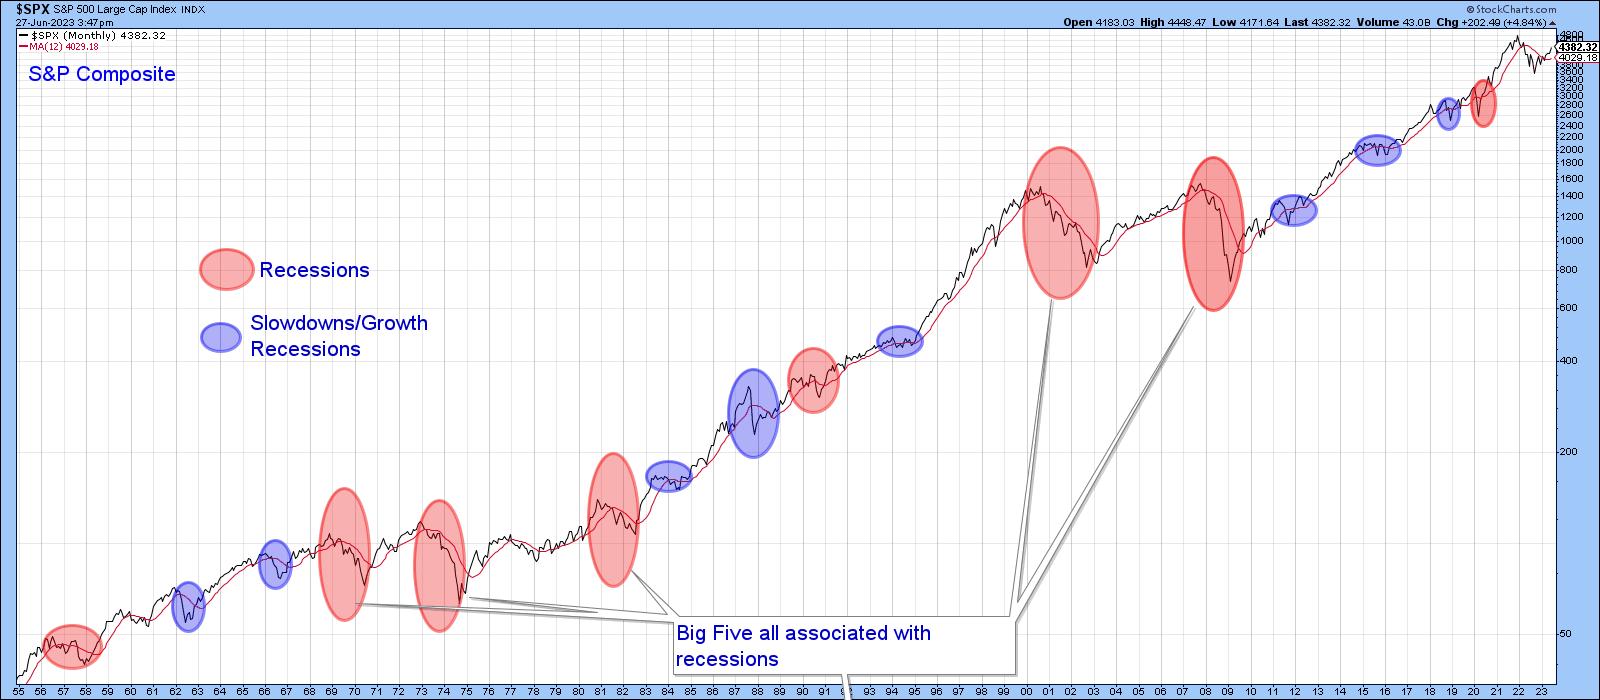
These Charts Explain Why Stocks Have Been Rallying Since October
by Martin Pring,
President, Pring Research
The ellipses in Chart 1 reflect economic events that have adversely affected the stock market since the 1950s. The pink ones reflect recessions, and those colored in blue indicate setbacks that anticipated economic slowdowns. Slowdowns develop when some economic sectors slip into recession, but that weakness is insufficient to push...
READ MORE
MEMBERS ONLY
Is the Tech Rally Overdone?
by Martin Pring,
President, Pring Research
When the direction of the primary trend changes, it's usually because the business cycle is transitioning from a slowdown or recession to a recovery. That process usually results in a change in sector rotation, as defensive ones, such as utilities and consumer staples, come to the fore and...
READ MORE
MEMBERS ONLY

MARKET BREADTH CONTINUES TO IMPROVE--AIRLINES LEAD INDUSTRIAL SECTOR HIGHER
by John Murphy,
Chief Technical Analyst, StockCharts.com
MORE BROADENING OUT...Various measure of market breadth continue to improve. That includes the number of stocks moving back above their moving average lines. Chart 1 shows the Percent of S&P 500 stocks trading above their 200-day averages rising to the highest level in four months. As a...
READ MORE
MEMBERS ONLY
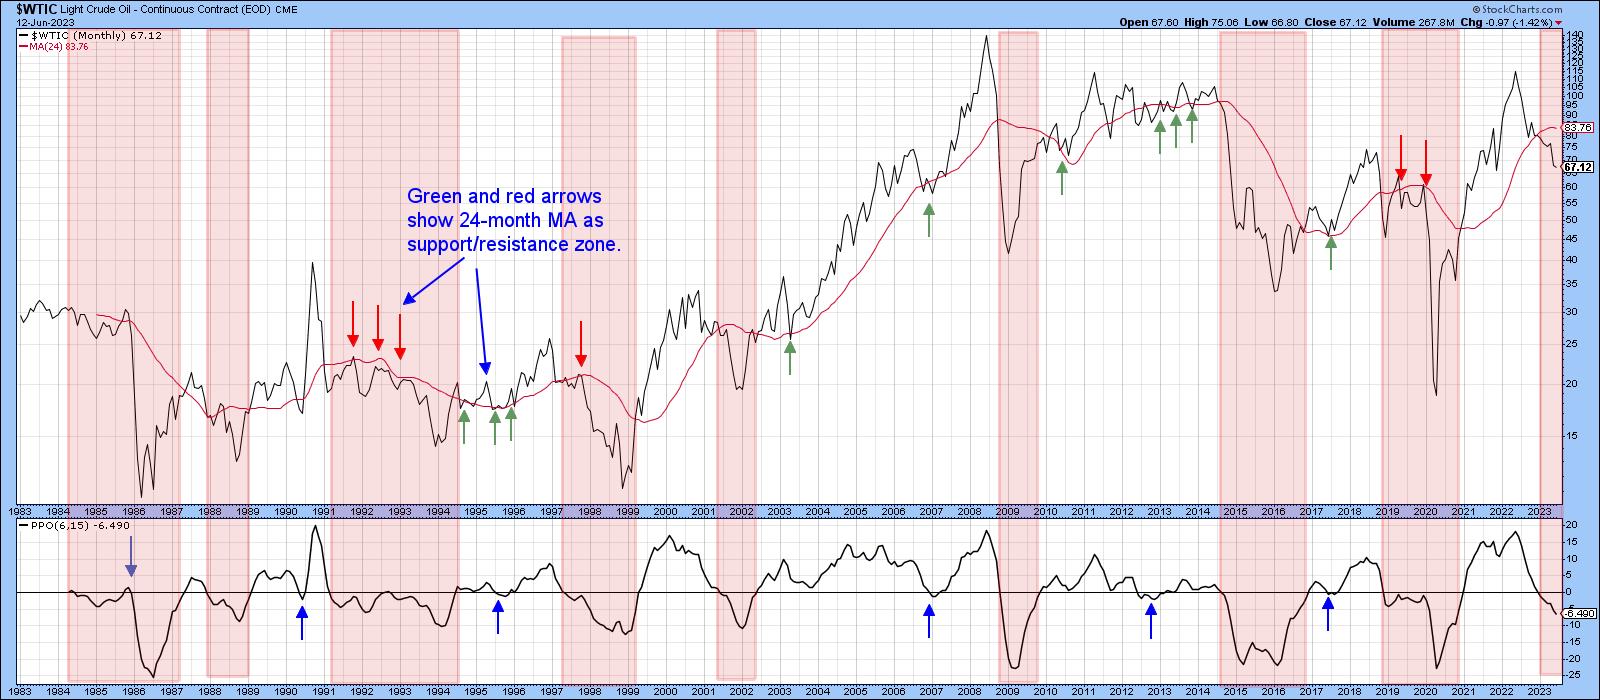
Can We Use Golf to Forecast Oil Prices?
by Martin Pring,
President, Pring Research
There used to be a rule of thumb on Wall Street that, whenever brokers upgraded to a new office after years of making do with smaller premises, it was the sign of market peak. Such behavior typically followed years of a bull market in which the investment houses had grown...
READ MORE
MEMBERS ONLY

S&P 500 TESTING AUGUST HIGH -- SMALL CAPS TURN UP -- XLY ACHIEVES UPSIDE BREAKOUT -- SO DO TESLA AND FORD
by John Murphy,
Chief Technical Analyst, StockCharts.com
S&P 500 TESTS AUGUST HIGH...Chart 1 shows the S&P 500 Index in the process of testing important overhead resistance at its August high (flat line). A close above that barrier would be a positive sign. The SPX has now gained 20% from its October low....
READ MORE