MEMBERS ONLY

Fourteen-Year Trend Favoring Relative Action of U.S. Equities May Be Over

by Martin Pring,
President, Pring Research
From the financial crisis in 2008 until October of last year, the U.S. stock market handsomely outperformed the Dow Jones Global Index ($DJW). However, recent price action suggests that this relationship may be about to change.
Stated more accurately, U.S. relative performance may have peaked last October, just...
READ MORE
MEMBERS ONLY

S&P 500 BACKS OFF FROM MOVING AVERAGE AND TRENDLINE RESISTANCE -- TNX NEARS POTENTIAL SUPPORT AT 200-DAY LINE

by John Murphy,
Chief Technical Analyst, StockCharts.com
S&P 500 REMAINS IN MAJOR DOWNTREND...Although stocks have experienced a counter-trend rally over the last three months, their major trend is still down. One way to measure that is by looking at where moving averages and trendlines are located. Chart 1 show the S&P 500...
READ MORE
MEMBERS ONLY

Selecting Sectors Using the Nirvana ChartStyle
by Martin Pring,
President, Pring Research
In the last couple of weeks, I've had a couple of conversations with clients asking how I go about selecting promising sectors, even when not much excites me at the moment.
To start with, I'm a believer in the principle that the character of short-term moves—...
READ MORE
MEMBERS ONLY

FALLING DOLLAR HELPING COMMODITY-RELATED MATERIAL STOCKS—FOREIGN STOCKS RISING FASTER THAN THE U.S.
by John Murphy,
Chief Technical Analyst, StockCharts.com
Last week's message showed how a falling dollar was boosting the price of gold and its miners. The falling dollar may also be lending support to material stocks tied to various commodities which can also benefit from a weaker dollar.
FALLING DOLLAR BOOSTS MATERIAL STOCKS
The green area...
READ MORE
MEMBERS ONLY

A Tale of Two Indexes
by Martin Pring,
President, Pring Research
Most of the time, the major indexes move in tandem. Occasionally, they'll throw up positive and negative divergences that technical analysts can use to better identify important trend reversals. Today, we will look at two market averages whose 2022 price action has resulted in completely different potential chart...
READ MORE
MEMBERS ONLY

FALLING DOLLAR BOOSTS GOLD AND ITS MINERS -- STOCKS END WEEK ON STRONG NOTE AS RATES DROP
by John Murphy,
Chief Technical Analyst, StockCharts.com
BOND YIELDS AND THE DOLLAR WEAKEN... The direction of interest rates plays a big role in determining the direction of the dollar. Rising U.S. rates during 2022 helped push the dollar to the highest level in twenty years. Chart 1, however, shows the 10-Year Treasury yield peaking during October...
READ MORE
MEMBERS ONLY

2023 Outlook

by Larry Williams,
Veteran Investor and Author
The Boy Scout Motto "Be Prepared" is apt for the year 2023. In this exclusive StockCharts TV special, Larry shows you the things you should be prepared for and some of his expectations for what's coming in the new year.
This video was originally broadcast on...
READ MORE
MEMBERS ONLY

Tesla's Bear Market Low: Are We There Yet?
by Martin Pring,
President, Pring Research
I don't usually get into individual stocks, but, back in August, I found Tesla's price action to be quite interesting. That's because I felt the stock, along with its fearless leader Elon Musk, were important icons of the 2020–2022 phase of the post-financial...
READ MORE
MEMBERS ONLY

STOCKS END WEAK DECEMBER UNDER PRESSURE: NASDAQ HAS REACHED ITS AUTUMN LOW; SECTOR RANKING REMAINS DEFENSIVE
by John Murphy,
Chief Technical Analyst, StockCharts.com
STOCKS END YEAR UNDER PRESSURE...
Little has changed since the last message written a couple of weeks ago. At that point, major stock indexes had failed a test of overhead resistance levels and were starting to weaken. They've weakened even further since then. Chart 1 shows the Dow...
READ MORE
MEMBERS ONLY

Santa Comes Up Empty-Handed
by Martin Pring,
President, Pring Research
Statistically speaking, the last half of December is the best seasonal period of the year, part of which serves as what is popularly known as the Santa Claus rally. The first half of the month also has a slight edge to the upside, though that has not worked out so...
READ MORE
MEMBERS ONLY

Stocks Fall Sharply at Key Resistance Levels: Year End Rally May Have Run Its Course
by John Murphy,
Chief Technical Analyst, StockCharts.com
STOCK INDEXES ARE FAILING AT OVERHEAD RESISTANCE LEVELS...
The year-end stock market rally appears to have run its course. A more hawkish Fed on Wednesday suggesting that rates will be higher for longer started the stock selling. This mornings's economic reports for November showed a drop in retail...
READ MORE
MEMBERS ONLY

The Business Cycle Is Poised for a Stage 1 Signal
by Martin Pring,
President, Pring Research
One of my favorite chart lists is one called Interasset Ratios. As the name implies, it contains a library of charts that plot various long-term relationships between asset classes, such as the stock/bond ratio, bond/commodity relationship, and so forth. It's not something you want to focus...
READ MORE
MEMBERS ONLY

STOCK INDEXES STRUGGLE BELOW RESISTANCE LEVELS --YEAREND RALLY IS RUNNING OUT OF TIME -- WHY FALLING COMMODITIES ARE A BAD SIGN
by John Murphy,
Chief Technical Analyst, StockCharts.com
STOCK INDEXES CONTINUE TO STRUGGLE WITH OVERHEAD RESISTANCE... The expected yearend rally has taken major stock indexes up against some formidable overhead resistance barriers. So far, the rally hasn't been enough to reverse the market's major downtrend. While seasonal trends are usually favorable during the fourth...
READ MORE
MEMBERS ONLY

Is Gold a Buy or a Sell?
by Martin Pring,
President, Pring Research
The price of gold has been on a tear recently, bouncing sharply from its October low. It could be a good time to see whether this is the start of a new bull market or just a flash in the pan. Let's begin with the big picture and...
READ MORE
MEMBERS ONLY

Three Indicators that Call Bear Market Bottoms Were AWOL at the October Lows
by Martin Pring,
President, Pring Research
To many, October represents the low for the 2022 bear market and what we are seeing today is the first leg of a new bull trend. After all, interest rates have probably peaked, inflation is dying, supply chain problems are over and so is the pandemic.
Looking Closely at the...
READ MORE
MEMBERS ONLY

DOW HITS SEVEN-MONTH HIGH WHILE THE REST OF THE MARKET LAGS BEHIND -- HEALTHCARE HAS BECOME A MARKET LEADER
by John Murphy,
Chief Technical Analyst, StockCharts.com
DOW CONTINUES TO LEAD... The market ended the Thanksgiving week with the Dow gaining ground on Friday while the S&P 500 and and Nasdaq ended the day lower. For the week, all three gained ground with the Dow in the lead and the Nasdaq turning in the weakest...
READ MORE
MEMBERS ONLY

What Does the Wall-to-Wall Media Coverage of the FTX Collapse Mean?
by Martin Pring,
President, Pring Research
Last May, I wrote an article entitled "Bitcoin Bubble Finally Bursts", where I laid out the technical case for substantially lower prices. It was partially based on the fact that the 18-month ROC had peaked from a level in excess of 200%. My research, featuring 26 case studies...
READ MORE
MEMBERS ONLY

DOW TESTS RESISTANCE NEAR AUGUST HIGH -- SPX AND QQQ LAG BEHIND -- 3 MONTH - 10 YEAR YIELD CURVE INVERTS
by John Murphy,
Chief Technical Analyst, StockCharts.com
DOW LEADS WHILE SPX AND QQQ LAG BEHIND... The fourth quarter rally in stocks may be losing some upside momentum. That's especially true of the Dow. Chart 1 shows the Dow Industrials approaching formidable overhead resistance at their August highs. That may be hard to overcome. Charts 2...
READ MORE
MEMBERS ONLY

Weakening Dollar Unleashes Non-U.S. Markets, or Does It?
by Martin Pring,
President, Pring Research
Last week, I wrote that the dollar and commodities were poised at inflection pointsand we should be on the lookout for an important move in both.
The U.S. Dollar Index ($USD) obliged with the completion of a head-and-shoulders top, as shown in chart 1. It's clearly overstretched...
READ MORE
MEMBERS ONLY
The End is Near!
by Larry Williams,
Veteran Investor and Author
The end of this year is close, so this will probably be the last special for Larry for 2022. But is the year going to close in a good or bad way? In this exclusive StockCharts TV special, Larry explains why he thinks it will be in a good way....
READ MORE
MEMBERS ONLY

STOCKS SURGE ON LOWER CPI FOR OCTOBER -- SHARP DROP IN BOND YIELDS BOOSTS HOMEBUILDERS -- HIGHER COMMODITY PRICES BOOST MATERIALS -- ASSET MANAGERS LEAD FINANCIALS
by John Murphy,
Chief Technical Analyst, StockCharts.com
DOW LEADS STOCKS HIGHER... Annual inflation for October was a lower than expected reading of 7.7% which was the lowest since January. That softer reading raised hopes that inflation might be peaking and pushed stock and bond prices sharply higher. A big drop in bond yields and the dollar...
READ MORE
MEMBERS ONLY

Dollar and Commodities Poised at Possible Inflection Points
by Martin Pring,
President, Pring Research
The Dollar Index has had a good run to the upside, but is starting to show some possible signs of fatigue. That potential weakness could take the form of an actual reversal in its primary uptrend, or an intermediate counter-correction. At the same time, commodities, which often (but certainly not...
READ MORE
MEMBERS ONLY

SECTOR ROTATION MODEL REMAINS BEARISH
by John Murphy,
Chief Technical Analyst, StockCharts.com
SECTOR ROTATION MODEL .. One of the more useful ways to help determine the state of the stock market and the economy is to compare how various market sectors are performing. Certain market sectors do better at market tops, while others do better at market bottoms. Chart 1 shows the Stockcharts...
READ MORE
MEMBERS ONLY

Signs the Bear Market Rally May Be Over
by Martin Pring,
President, Pring Research
Last time I reviewed the stock market, many of the Indexes had just experienced a bullish outside bar (see chart for the DIA). Since several of the oscillators had reached oversold readings, the idea of a rally seemed appropriate. By the same token, its important to remember that there is...
READ MORE
MEMBERS ONLY

DOW TESTS 200-DAY LINE TO LEAD MARKET HIGHER -- HEALTHCARE SPDR MAY BE BOTTOMING -- BIOTECHS LOOK STRONG
by John Murphy,
Chief Technical Analyst, StockCharts.com
DOW TESTS 200-DAY LINE... October has turned to be a strong month for the market, and industrials in particular. Chart 1 shows the Dow Industrials reaching a two month high and trying to close above its 200-day moving average. The Dow has gained more than 5% for the week and...
READ MORE
MEMBERS ONLY

Which Country ETFs Can Lead Us Out of the Bear Market and Which Ones Could Drag Us Deeper In?
by Martin Pring,
President, Pring Research
When I am looking at a downtrend of a specific market that has been in existence for a while, I often ask myself which components might be on the verge of an upside breakout and could therefore lead it higher. Conversely, I have to ask if there are any downside...
READ MORE
MEMBERS ONLY

SHORT-TERM STOCK REBOUND CONTINUES -- ENERGY SECTOR ACHIEVES UPSIDE BREAKOUTS -- EXXON AND SCHLUMBERGER.HIT 52-WEEK HIGHS
by John Murphy,
Chief Technical Analyst, StockCharts.com
SHORT-TERM REBOUND CONTINUES... Stocks are ending the week on a positive note and continue to show signs of having formed a short-term bottom. The daily bars in Chart 1 show the S&P 500 building on the gains that started the previous week. Sbort-term momentum indicators like the RSI...
READ MORE
MEMBERS ONLY

Sectors to Avoid if the Market Declines and Worth Consideration if it Rallies
by Martin Pring,
President, Pring Research
Last week, I suggested that some unusually bullish outside bars, in conjunction with positive short-term momentum and a favorable seasonal going into year-end, could trigger a worthwhile rally. That does not make me wildly bullish, because I still think we are in a bear market. When my long-term indicators turn,...
READ MORE
MEMBERS ONLY

STOCKS ENDING WEEK ON THE DOWNSIDE -- 10-YEAR TREASURY YIELD TRADES ABOVE 4% -- THAT'S HURTING HOMEBUILDERS
by John Murphy,
Chief Technical Analyst, StockCharts.com
NO UPSIDE FOLLOW-THROUGH...Stocks are being sold again on Friday following Thursday's impressive upside reversal. The daily bars in Chart 1 show the S&P 500 reversing upward on Thursday after falling to another bear market low. And it did so on heavy volume. The fact that...
READ MORE
MEMBERS ONLY

Giant Outside Days Spook the Bears
by Martin Pring,
President, Pring Research
Thursday's price action began bearishly with the probing of recent bear market lows. By the end of the session, the DJIA, along with several other markets, totally encompassed Tuesday's trading range and then some, in a one-day pattern known as an "outside day". To...
READ MORE
MEMBERS ONLY
Up, Up & Away!
by Larry Williams,
Veteran Investor and Author
In this exclusive StockCharts TV special, Larry talks about how inflation has been the driving force in the markets. Where are we now, and what is about to happen? Larry uses the Cycle Theory, Crude Oil, P/E, the Presidential Cycle and more to determine where the markets are likely...
READ MORE
MEMBERS ONLY

STOCKS SELL OFF ON JOBS REPORT -- RISING RATES AND OIL ARE ALSO WEIGHING ON STOCKS
by John Murphy,
Chief Technical Analyst, StockCharts.com
STOCK INDEXES GAP LOWER... Stocks are selling off sharply following this morning's September job report which came in a bit stronger than expected. That may be a case of good economic news being bad for stocks because it keeps the Fed on its path of higher interest rates....
READ MORE
MEMBERS ONLY
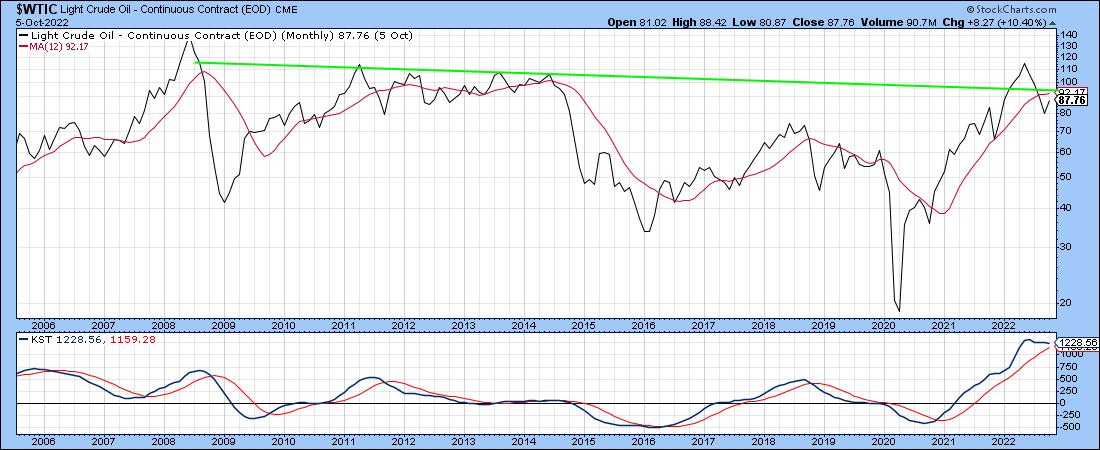
The Oil Price Gets Resuscitated: Is it Enough to Keep the Bull Market Alive?
by Martin Pring,
President, Pring Research
Just when it seemed that oil was peaking, OPEC breathed new life into the commodity this week by threatening a sizeable production cut. That does not change the overextended nature of the longer-term indicators. Nevertheless, it does hint that oil prices and their related stocks may be on the verge...
READ MORE
MEMBERS ONLY

FOREIGN STOCKS ARE LEADING U.S. LOWER
by John Murphy,
Chief Technical Analyst, StockCharts.com
FALLING FOREIGN CURRENCIES... Last week's message showed the U.S. Dollar Index rising to the highest level in twenty years. That's due largely to the fact that the Fed has been hiking rates faster and higher than most foreign bankers. What's good for the...
READ MORE
MEMBERS ONLY

Inflation is All the Rage, but Many Market Signals are Pointing in a Different Direction
by Martin Pring,
President, Pring Research
Polls show that the number one issue with voters is inflation, but some intermarket relationships are signaling otherwise. I am not saying that inflation is about to be wrestled to the ground, but it goes in waves, as you can see from Chart 1. Also, once prices go up, they...
READ MORE
MEMBERS ONLY

INTERMARKET VIEW REMAINS BEARISH -- YIELDS SURGE WITH DOLLAR AS COMMODITIES FALL -- STOCKS PRESSURE JUNE LOWS
by John Murphy,
Chief Technical Analyst, StockCharts.com
TREASURY YIELDS SOAR... An intermarket view across the various financial markets continues to present an overall bearish picture. And it starts with this year's surge in interest rates. Chart 1 shows the yield on 2-Year and 10-Year Treasury yields surging to the highest levels in more than a...
READ MORE
MEMBERS ONLY

This Chart Says the June Lows Will Not Hold
by Martin Pring,
President, Pring Research
The relationship between the stock market and money market interest rates is as old as the hills. The "hills," in this case, go back to 1900 and before.
The concept rests on the idea that, at the beginning of the cycle, when the economy is falling like a...
READ MORE
MEMBERS ONLY

TEST OF SUMMER LOW LOOKS LIKELY -- LONG-TERM STOCK INDICATORS REMAIN BEARISH
by John Murphy,
Chief Technical Analyst, StockCharts.com
STOCK INDEXES NEAR TEST OF SUMMR LOW... Hotter than expected inflation numbers this week pushed interest rates sharply higher and stock prices sharply lower. The daily bars in Chart 1 show the S&P 500 falling to the lowest level in two months and nearing a likely test of...
READ MORE
MEMBERS ONLY

Bearish Weekly Dollar Candles May Help Change the Energy Inflation Dynamic
by Martin Pring,
President, Pring Research
It is a well-established fact that the dollar and oil prices move in opposite directions, most of the time. Perhaps a more accurate way of saying the same thing is to observe that a rising dollar acts as a headwind for energy prices, while a falling one acts a tailwind...
READ MORE
MEMBERS ONLY
Down, Then Up, Up and Away!
by Larry Williams,
Veteran Investor and Author
Larry goes back to the future in this exclusive StockCharts TV special! The stock market, he predicts, will go down a bit, before then heading UP, UP & Away! He shares the things that make him think that way, including inflation, stocks, and a view of the future.
This video...
READ MORE