MEMBERS ONLY

Wyckoff at Work in the Intraday Timeframe

by Bruce Fraser,
Industry-leading "Wyckoffian"
It is well known that stock market indexes are fractal. Demonstrating repeatable price structures in all timeframes. In the intraday timeframe these price structures repeat frequently. The Wyckoff characteristics of Accumulation, Markup, Distribution and Markdown are constantly at work in smaller periods of time. Wyckoff students will study such structures...
READ MORE
MEMBERS ONLY

DP Trading Room: Upside Initiation Climax (Should We Trust It?)

by Erin Swenlin,
Vice President, DecisionPoint.com
On today's DecisionPoint Trading Room episode Carl and Erin discuss Friday's "Upside Initiation Climax" and whether it can be trusted. With market follow through tepid, they discuss the implications of this very bullish signal.
Carl reveals his sentiment of the overall market and covers...
READ MORE
MEMBERS ONLY

Top 5 Stocks in "Go" Trends | Fri May 31, 2024

by Tyler Wood,
Co-founder, GoNoGo Charts®
KEY TAKEAWAYS
* Trend Continuation
* Breakouts
* Momentum Confirmation
* Bull Flags
Top 5 Stocks in "Go" Trends
Trend Continuation on Rising Momentum
GoNoGo Charts® highlight low-risk opportunities for trend participation with intuitive icons directly in the price action. The resurgence of momentum in the direction of the underlying price trend...
READ MORE
MEMBERS ONLY

MUST SEE! Top 10 Stock Picks For June 2024

by David Keller,
President and Chief Strategist, Sierra Alpha Research

by Grayson Roze,
Chief Strategist, StockCharts.com
In this edition of StockCharts TV'sThe Final Bar, join Dave and Grayson as they run through top 10 charts to watch in June 2024! They'll cover breakout strategies, moving average techniques, relative strength, and much more. You don't want to miss these insights into...
READ MORE
MEMBERS ONLY

Is Aflac Set to Surpass Analysts' Targets? Find Out Now!

by Karl Montevirgen,
The StockCharts Insider
KEY TAKEAWAYS
* Aflac stock soars, hitting a new all-time high
* Indicators suggest the stock is strong and could continue rising
* Aflac has the potential to outperform the S&P 500, the Financial sector, and the insurance industry
Boring and captivating rarely coexist, except for contrarians who can uncover the...
READ MORE
MEMBERS ONLY

Textbook Double Top on Silver (SLV)
by Erin Swenlin,
Vice President, DecisionPoint.com
Gold is struggling, moving mostly sideways. Silver has technically been moving sideways as well, only it has formed a textbook double top chart pattern. Textbook double tops show even tops and a clear confirmation line delineated at the middle of the "M" formation. What is good about these...
READ MORE
MEMBERS ONLY

The Sky is Not Falling | Focus on Stocks: June 2024

by Larry Williams,
Veteran Investor and Author
A note to the Cassandras who are now out in full force...
Led by "Rich Dad, Poor Dad" Robert Kiyosaki's warning of "Be careful, it's the biggest crash in world history," the bears have come out of their winter caves. "We...
READ MORE
MEMBERS ONLY

From Summer Doldrums to Year-End Surge: How to Profit from Seasonal Trends in Precious Metals and Bitcoin
by Karl Montevirgen,
The StockCharts Insider
KEY TAKEAWAYS
* Bitcoin, gold, and silver exhibit similar seasonality patterns.
* Bitcoin, gold, and silver prices largely reflect economic expectations.
* If you're bullish on bitcoin, gold, or silver, there are critical levels to watch.
Safe-haven investments like gold, silver, and now Bitcoin have had a bumpy and uncertain rise,...
READ MORE
MEMBERS ONLY

Rules-Based Money Management - Part 7: The "Dancing with the Trend" Model

by Greg Morris,
Veteran Technical Analyst, Investor, and Author
Note to the reader: This is the twenty-third in a series of articles I'm publishing here taken from my book, "Investing with the Trend." Hopefully, you will find this content useful. Market myths are generally perpetuated by repetition, misleading symbolic connections, and the complete ignorance of...
READ MORE
MEMBERS ONLY

Three Stock Ideas as S&P 500 Treads Water
by David Keller,
President and Chief Strategist, Sierra Alpha Research
In this edition of StockCharts TV'sThe Final Bar, Dave welcomes Tony Zhang of OptionsPlay. Tony shares three stock ideas showing favorable risk/reward characteristics as the S&P 500 index treads water above support at 5250. David describes the deteriorating market breadth conditions and reviews charts of...
READ MORE
MEMBERS ONLY

This Simple Little Option Is A HUGE Productivity Booster
by Grayson Roze,
Chief Strategist, StockCharts.com
On this week's edition of StockCharts TV'sStockCharts in Focus, Grayson shows you how to boost your charting workflow with the "Inspect" tool. These powerful little crosshairs pack a punch, with hidden features that let you measure in multiple directions, track price and percent changes...
READ MORE
MEMBERS ONLY

Technical Indicator Showdown: MACD vs. PPO vs. PMO
by David Keller,
President and Chief Strategist, Sierra Alpha Research
In this edition of StockCharts TV'sThe Final Bar, Dave answers viewer questions from The Final Bar Mailbag. He outlines the differences between the MACD, PPO, and PMO indicators, covers the mechanics of corporate buybacks, examines the basics of candlestick analysis, and discusses whether applying trendline analysis to the...
READ MORE
MEMBERS ONLY

Surprise! These Grocery Stocks are Crushing 2024 Targets
by Karl Montevirgen,
The StockCharts Insider
KEY TAKEAWAYS
* Consumer Staples stocks offer stability and growth in a high inflation environment.
* Many consumer staples stocks have exceeded analyst price targets, revealing Wall Street's underestimation of their growth potential.
* Sometimes the next big stock is often found in a seemingly boring name, as Sprouts Farmers Market...
READ MORE
MEMBERS ONLY

Dow Theory Flashes Bear Signal
by David Keller,
President and Chief Strategist, Sierra Alpha Research
Dow Theory is based on the foundational work of Charles Dow, considered the "Father of Technical Analysis." Many of the tools we employ to better analyze market structure and investor sentiment, from trend analysis to index construction, are derived from Dow's original essays from the early...
READ MORE
MEMBERS ONLY

Rules-Based Money Management - Part 6: Putting It All Together
by Greg Morris,
Veteran Technical Analyst, Investor, and Author
Note to the reader: This is the twenty-second in a series of articles I'm publishing here taken from my book, "Investing with the Trend." Hopefully, you will find this content useful. Market myths are generally perpetuated by repetition, misleading symbolic connections, and the complete ignorance of...
READ MORE
MEMBERS ONLY

Hedging the S&P 500 All-Time Highs With Options

by Tony Zhang,
Chief Strategist, OptionsPlay
KEY TAKEAWAYS
* As stock market indexes hit all-time highs, you may want to consider hedging your portfolio with options.
* Since volatility is low, buying puts can be a relatively inexpensive way to protect your positions while remaining invested in the stock market.
As equity markets print new all-time highs and...
READ MORE
MEMBERS ONLY

Capitalizing on Riot Platforms' Potential: A Sleeper Stock Ready to Soar?
by Karl Montevirgen,
The StockCharts Insider
KEY TAKEAWAYS
* RIOT may be a beaten-down stock, but it has potential to rise higher
* A breakout above key the $12.65 price range on momentum could mean the stock price would move higher
* A potential resistance level is the $18.30 level
If you're not familiar, Riot...
READ MORE
MEMBERS ONLY

DP Trading Room: What's Up With Semiconductors?
by Erin Swenlin,
Vice President, DecisionPoint.com
Today Erin takes a deep dive into the Semiconductors (SMH). She goes over the "under the hood" health of the industry group and then takes us within the industry group to find the leadership stocks in that area.
Carl shares his wisdom on the current conditions of the...
READ MORE
MEMBERS ONLY

The Most Efficient Way To Follow The Markets - Customize Your Dashboard!
by Grayson Roze,
Chief Strategist, StockCharts.com
On this week's edition of StockCharts TV'sStockCharts in Focus, Grayson walks you through the "heart and soul" of StockCharts - Your Dashboard - and explains how he customizes his layout to serve as a one-stop-shop for following the latest market action. Grayson demonstrates how...
READ MORE
MEMBERS ONLY
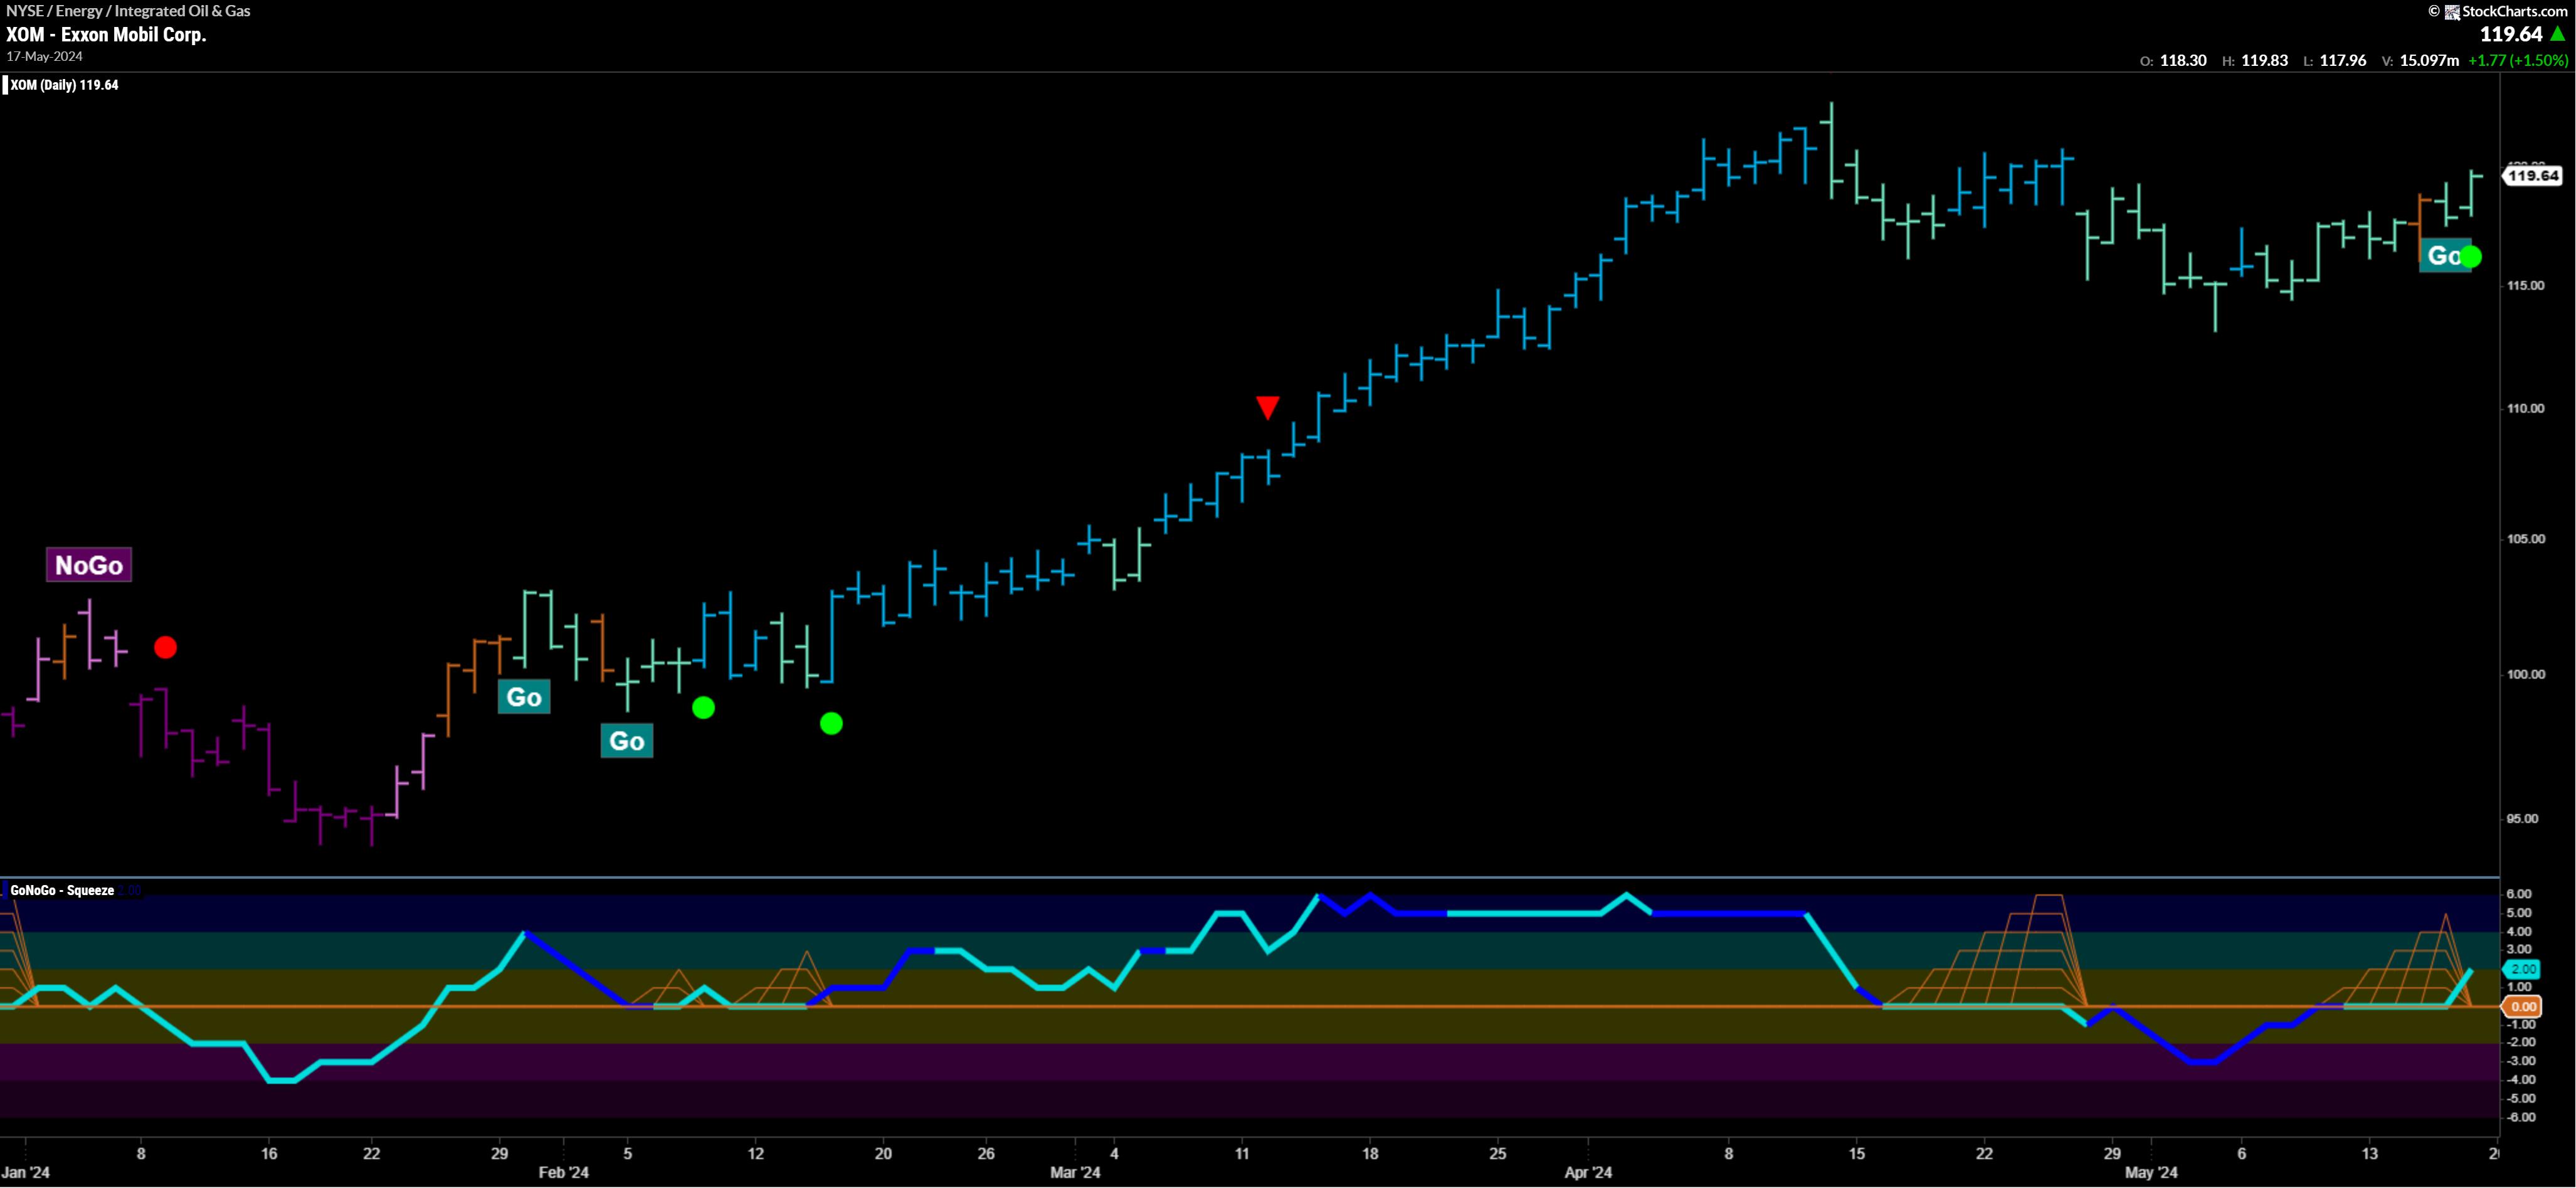
Top 5 Stocks in "Go" Trends | Fri May 17, 2024
by Tyler Wood,
Co-founder, GoNoGo Charts®
KEY TAKEAWAYS
* trend continuation
* breakouts
* Momentum Confirmation
* Bull Flags
Top 5 Stocks in "Go" Trends
Trend Continuation on Rising Momentum
GoNoGo Charts® highlight low-risk opportunities for trend participation with intuitive icons directly in the price action. The resurgence of momentum in the direction of the underlying price trend...
READ MORE
MEMBERS ONLY

The One Chart to Watch as S&P 500 Makes New All-Time Highs
by David Keller,
President and Chief Strategist, Sierra Alpha Research
As the S&P 500 and Nasdaq 100 have once again made new all-time highs, and the Dow Jones Industrial Average has briefly broken above the 40,000 level for the first time, how should we think about further upside for our equity benchmarks?
There are two general ways...
READ MORE
MEMBERS ONLY

Thrilling Week for the Stock Market: Dow Jones Makes Strong Close Above 40,000 for the First Time

by Jayanthi Gopalakrishnan,
Director of Site Content, StockCharts.com
KEY TAKEAWAYS
* Dow Jones Industrial Average closes above 40,000 for the first time
* Commodities such as silver, copper, and gold are moving higher
* Volatility remains low, indicating investors are complacent
It made it! The Dow Jones Industrial Average ($INDU) closed above 40,000 for the first time, another record...
READ MORE
MEMBERS ONLY
TOP 10 Stock Picks for May 2024
by David Keller,
President and Chief Strategist, Sierra Alpha Research
In this edition of StockCharts TV'sThe Final Bar, join Dave and Grayson as they run through the top 10 charts to watch in May 2024! They'll cover breakout strategies, moving average techniques, relative strength, and much more. You don't want to miss these insights...
READ MORE
MEMBERS ONLY

Gold and Silver Set to Smash Records: Could 2024 Be Their Biggest Year Yet?
by Karl Montevirgen,
The StockCharts Insider
KEY TAKEAWAYS
* Gold and silver are on the verge of breaking out toward record highs
* Gold and silver have reached most analyst price targets, but they could rise further
* From a technical perspective, gold and silver prices could smash above resistance levels
Gold is on the verge of breaking into...
READ MORE
MEMBERS ONLY

Bitcoin Sets Up with Classic Continuation Signal

by Arthur Hill,
Chief Technical Strategist, TrendInvestorPro.com
KEY TAKEAWAYS
* Corrections within bigger uptrends are opportunities.
* Chartists can identify corrections using retracements and patterns.
* The pattern provides a clear resistance level to watch for a breakout.
There is a certain ebb and flow in uptrends. Often we see some sort of stair step higher with big advances and...
READ MORE
MEMBERS ONLY
Larry Williams: Dow 40k, Cycle Analysis, and Lessons Learned
by David Keller,
President and Chief Strategist, Sierra Alpha Research
In this edition of StockCharts TV'sThe Final Bar, legendary trader and author Larry Williams joins Dave in the StockCharts TV studio. Larry shares his latest thoughts on Dow 40K, the resilient rise of gold and precious metals, cycle analysis on the S&P 500 and crude oil,...
READ MORE
MEMBERS ONLY

Larry's "Family Gathering" May 16, 2024 Recording
by Larry Williams,
Veteran Investor and Author
Certainty is needed for a trader's actions. Good judgment comes from experience, and experience is gained from poor judgment. The key to improving your trading is to really, truly study the losing trades.
In this month's Family Gathering video, Larry presents PPI numbers for historical buy...
READ MORE
MEMBERS ONLY

Rules-Based Money Management - Part 5: Security Selection, Rules, and Guidelines
by Greg Morris,
Veteran Technical Analyst, Investor, and Author
Note to the reader: This is the twenty-first in a series of articles I'm publishing here taken from my book, "Investing with the Trend." Hopefully, you will find this content useful. Market myths are generally perpetuated by repetition, misleading symbolic connections, and the complete ignorance of...
READ MORE
MEMBERS ONLY

"Family Gathering" Meeting Today at 2 PM Eastern
Today, Larry Williams will be hosting a "Family Gathering" meeting at 2pm Eastern Daylight Time (11am Pacific). Sign-in in begins 5 minutes prior. The show, which will include both a presentation from Larry and a viewer Q&A session, will be recorded and posted online for those...
READ MORE
MEMBERS ONLY
Powerful Entry Strategy Using One Moving Average

by Joe Rabil,
President, Rabil Stock Research
On this week's edition of Stock Talk with Joe Rabil, Joe explains how to use one SMA to pinpoint great entries in pullback plays, demonstrating how it can develop in slightly different ways. He shows 3 different types of setups in the price action and its relationship to...
READ MORE
MEMBERS ONLY

Salesforce Falls Out of Favor: Trade the Bear Put Spread Options Strategy
by Tony Zhang,
Chief Strategist, OptionsPlay
KEY TAKEAWAYS
* Salesforce stock will likely trade within the $210 to $220 area.
* A bear put spread is a strategy to consider if you want to take advantage of the stock trading between $210 and $220.
* With CRM's earnings about three weeks away, a bear put spread could...
READ MORE
MEMBERS ONLY

Larry's LIVE "Family Gathering" Webinar Airs THIS WEEK - Thursday, May 16 at 2 PM EDT!
Larry is going LIVE! Don't miss the upcoming "Family Gathering" webinar with Larry Williams, airing live through Zoom on Thursday, May 16 at 2:00pm Eastern Daylight Time.
In this must-see event, Larry will be presenting his current opinions on a broad variety of current market...
READ MORE
MEMBERS ONLY

This is the #1 Options Income Strategy You Should Master
by Tony Zhang,
Chief Strategist, OptionsPlay
In this exclusive interview, StockCharts' Grayson Roze sits down with Tony Zhang, Chief Strategist at OptionsPlay. Tony shares an informative overview of the Covered Call Strategy, explains how it can be used to generate reliable income for your portfolio, and explores best practices for the strategy including expiration and...
READ MORE
MEMBERS ONLY
DP Trading Room: Bonds & Yields At An Inflection Point
by Erin Swenlin,
Vice President, DecisionPoint.com
Today's focus was on the current and long-term conditions of Bonds and Yields which are at an inflection point. Yields are attempting to hold onto a rising trend and Bonds are plodding along to the upside for now. One reader asked if it is time to start dollar...
READ MORE
MEMBERS ONLY
Top 5 Stocks in "Go" Trends
by Tyler Wood,
Co-founder, GoNoGo Charts®
KEY TAKEAWAYS
* Trend Continuation
* Breakouts
* Bullish Flags
* Momentum Confirmation
Top 5 Stocks in "Go" Trends
Trend Continuation on Rising Momentum
GoNoGo Charts® highlight low-risk opportunities for trend participation with intuitive icons directly in the price action. The resurgence of momentum in the direction of the underlying price trend...
READ MORE
MEMBERS ONLY

Relative Strength Screams Bullish for This Tech Stock
by David Keller,
President and Chief Strategist, Sierra Alpha Research
In this edition of StockCharts TV'sThe Final Bar, Dave uncovers strength in SQSP using the Stochastics Oscillator and the StochRSI indicator. He shares his favorite chart for analyzing relative strength ratios for leading stocks, and also answers viewer questions on price patterns for XLB and PYPL, plus best...
READ MORE
MEMBERS ONLY
Rules-Based Money Management - Part 4: Security Ranking Measures
by Greg Morris,
Veteran Technical Analyst, Investor, and Author
Note to the reader: This is the twentieth in a series of articles I'm publishing here taken from my book, "Investing with the Trend." Hopefully, you will find this content useful. Market myths are generally perpetuated by repetition, misleading symbolic connections, and the complete ignorance of...
READ MORE
MEMBERS ONLY
What Rising Volatility Means to the Current Market
by Joe Rabil,
President, Rabil Stock Research
On this week's edition of Stock Talk with Joe Rabil, Joe explains how he uses a rising volatility condition to signal increased risk. He then discusses what needs to take place to offer a nice trading opportunity, and shows how to adjust your approach when volatility is increasing....
READ MORE
MEMBERS ONLY

Why Novo Nordisk's Stock Price Recovery Makes It a Promising Buy
by Jayanthi Gopalakrishnan,
Director of Site Content, StockCharts.com
KEY TAKEAWAYS
* Novo Nordisk's stock price fell after its Q1 earnings report, but pivoted and reversed
* NVO stock could break above its all-time highs
* A couple of technical indicators can help confirm your buy decision
Novo Nordisk (NVO) reported Q1 earnings on May 2. Even though it was...
READ MORE
MEMBERS ONLY

DP Trading Room: Two Industry Groups To Watch!
by Erin Swenlin,
Vice President, DecisionPoint.com
Today Erin uncovers two industry groups that are showing strength and potential in the short term. She takes a look "Under the Hood" to reveal participation and trends that are quite bullish.
Carl walks us through the market overall, covering not only the SPY, but also interest rates,...
READ MORE