MEMBERS ONLY

It's Time to Get Long

by Larry Williams,
Veteran Investor and Author
As a follower of my "Focus on Stocks" blog, you know we had a signal to sell on the opening Sunday night (10th day left).
That was forecast last month... now I think it's time to start to get long.
Where? At the August lows.
When?...
READ MORE
MEMBERS ONLY

Fed Keeps Hands Off Rates, Leaves DOOR OPEN for More Hikes!

by David Keller,
President and Chief Strategist, Sierra Alpha Research
In this edition of StockCharts TV'sThe Final Bar, Danielle Shay of Simpler Trading joins Dave to discuss what's the technical take on the FAANG stocks after today's Fed announcement going into earnings season? Powell and Co. leave rates unchanged, leave the door open for...
READ MORE
MEMBERS ONLY

Jesse Livermore on Mistakes & Rising From the Ashes

by Dave Landry,
Founder, Sentive Trading, LLC
In this week's edition of Trading Simplified, Dave continues his series on Jesse Livermore. In spite of Livermore's greatness, he made a lot of mistakes, and these mistakes often resulted in him blowing up. In this episode, Dave discusses how Livermore let extraneous influences force him...
READ MORE
MEMBERS ONLY
Timing the Market With the WillTrend Indicator

by Karl Montevirgen,
The StockCharts Insider
KEY TAKEAWAYS
* The WillTrend indicator helps identify stock trends and optimal entry and exit points
* The WillTrend indicator provides clear signals in weekly and daily charts that help determine actionable trading scenarios
* It's important to take each signal within the context of the stock's current technical...
READ MORE
MEMBERS ONLY

When to BUY, When to SELL, and When to SIT On Your Hands
by David Keller,
President and Chief Strategist, Sierra Alpha Research
In this edition of StockCharts TV'sThe Final Bar, guest Dave Landry of DaveLandry.com shares his own approach to what he calls the "Three Whens"- when to buy, when to sell, and when to sit on your hands! Meanwhile, host Dave Keller reviews charts of...
READ MORE
MEMBERS ONLY
Analyzing Risks for Mega-Cap Growth Stocks Before Key FED Meeting
by David Keller,
President and Chief Strategist, Sierra Alpha Research
In this edition of StockCharts TV'sThe Final Bar, Dave conducts a deep dive into current market breadth indicators, including advance-decline data, the McClellan Oscillator, and the Bullish Percent Index. He reviews key support and resistance levels for AAPL, TSLA, NVDA, and other growth stocks as the market waits...
READ MORE
MEMBERS ONLY

Quick Access to Your Chart Templates, The Secret Sauce That Makes ACP Fly

by Grayson Roze,
Chief Strategist, StockCharts.com
On this week's edition of StockCharts TV'sStockCharts in Focus, Grayson demonstrates the importance of Chart Templates in StockCharts' ACP platform, then pulls back the covers on a new "quick access" feature that just launched in the platform.
StockCharts users can now access any...
READ MORE
MEMBERS ONLY
Sector Spotlight: The Current State of ARGoN -- Applying the Concept to 30 DOW Stocks

by Julius de Kempenaer,
Senior Technical Analyst, StockCharts.com
In this episode of StockCharts TV's Sector Spotlight, I continue my chat with Ralph Acampora in the StockCharts.com studio.
After recording our previous video (see here!), I put Ralph on the spot, and together we flip through the 30 Dow stocks, calling the current price and relative...
READ MORE
MEMBERS ONLY

MEM TV: Best Ways for You to Hedge Tech Weakness

by Mary Ellen McGonagle,
President, MEM Investment Research
In this episode of StockCharts TV'sThe MEM Edge, Mary Ellen McGonagle shares her outlook for the markets heading into next week's interest rate decision by the Federal Reserve. She also reviews why Technology was the weakest sector and what it means for the group. She then...
READ MORE
MEMBERS ONLY

Sector Spotlight: The Story of ARGoN (Acampora's Relative Grid of Nine)
by Julius de Kempenaer,
Senior Technical Analyst, StockCharts.com
In this episode of StockCharts TV's Sector Spotlight, I chat with guest Ralph Acampora in the StockCharts.com studio in Redmond, WA. We discuss the birth of ARGoN, a special way of looking at markets from both a price and a relative perspective.
Once upon a time, Ralph...
READ MORE
MEMBERS ONLY
Three ETFs Suggest Further Downside
by David Keller,
President and Chief Strategist, Sierra Alpha Research
This past week had all the potential to see a revival of the great bull market of 2023. The September inflation data, Apple's latest product announcements, and Arm's IPO all seemed had the possibility to reignite the fire of bullishness for investors.
By Friday's...
READ MORE
MEMBERS ONLY
Deep Dive Into Stop Losses, Volatility Hacks, and Bullish Rotation
by David Keller,
President and Chief Strategist, Sierra Alpha Research
In this edition of StockCharts TV'sThe Final Bar, Dave drops a special all-mailbag episode, including viewer questions on using Average True Range for stop losses, stocks vs. bonds, India's test of all-time highs, and best practices for price volatility.
This video originally premiered on September 15,...
READ MORE
MEMBERS ONLY

Using the Chikou Span to Identify Early Trading Signals
by Karl Montevirgen,
The StockCharts Insider
KEY TAKEAWAYS
* Like a swiss army knife, the Ichimoku Kinko Hyo is a multi-purpose indicator that can be used to shape your trading setups and decisions
* The Chikou Span, with its 26-day look-back, can be used to confirm market sentiment and identify potential trend reversals
* Even as a retroactive feature,...
READ MORE
MEMBERS ONLY
Timeless Lessons from the Godfather of Technical Analysis
by David Keller,
President and Chief Strategist, Sierra Alpha Research
In this edition of StockCharts TV'sThe Final Bar, Dave sits down with Ralph Acampora, CMT, co-founder of the CMT Association, for a memorable conversation on all things technical analysis. They review lessons learned from the October 2022 market low, words of wisdom for traders new to technical analysis,...
READ MORE
MEMBERS ONLY
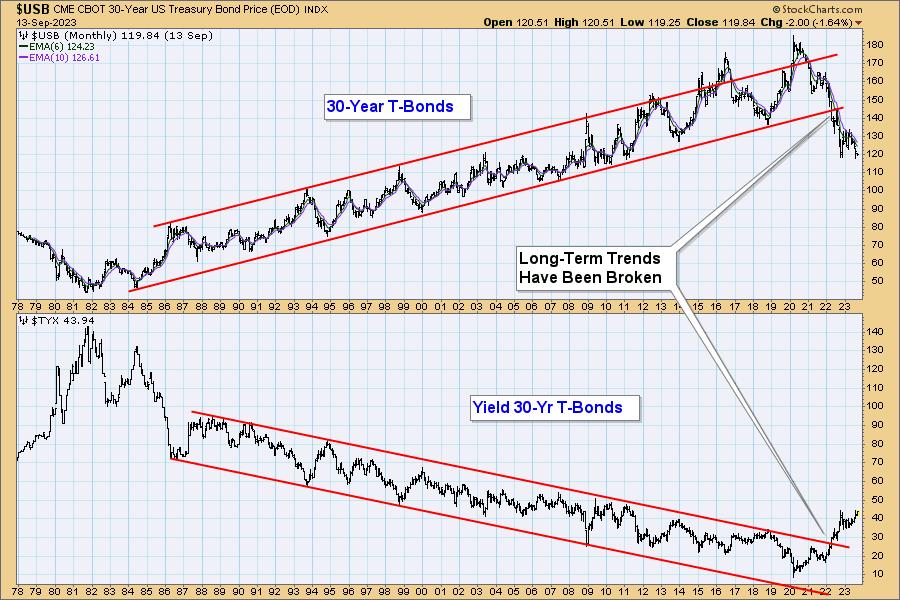
Bonds: Don't Forget the Long-Term Trend

by Carl Swenlin,
President and Founder, DecisionPoint.com
Many of the forecasts I hear regarding bonds seem to be based upon what bonds have done for most of the last 40 years, without acknowledging what has happened more recently. The chart below shows that 30-Year T-Bonds were in a rising trend from the 1982 low, but, in early...
READ MORE
MEMBERS ONLY
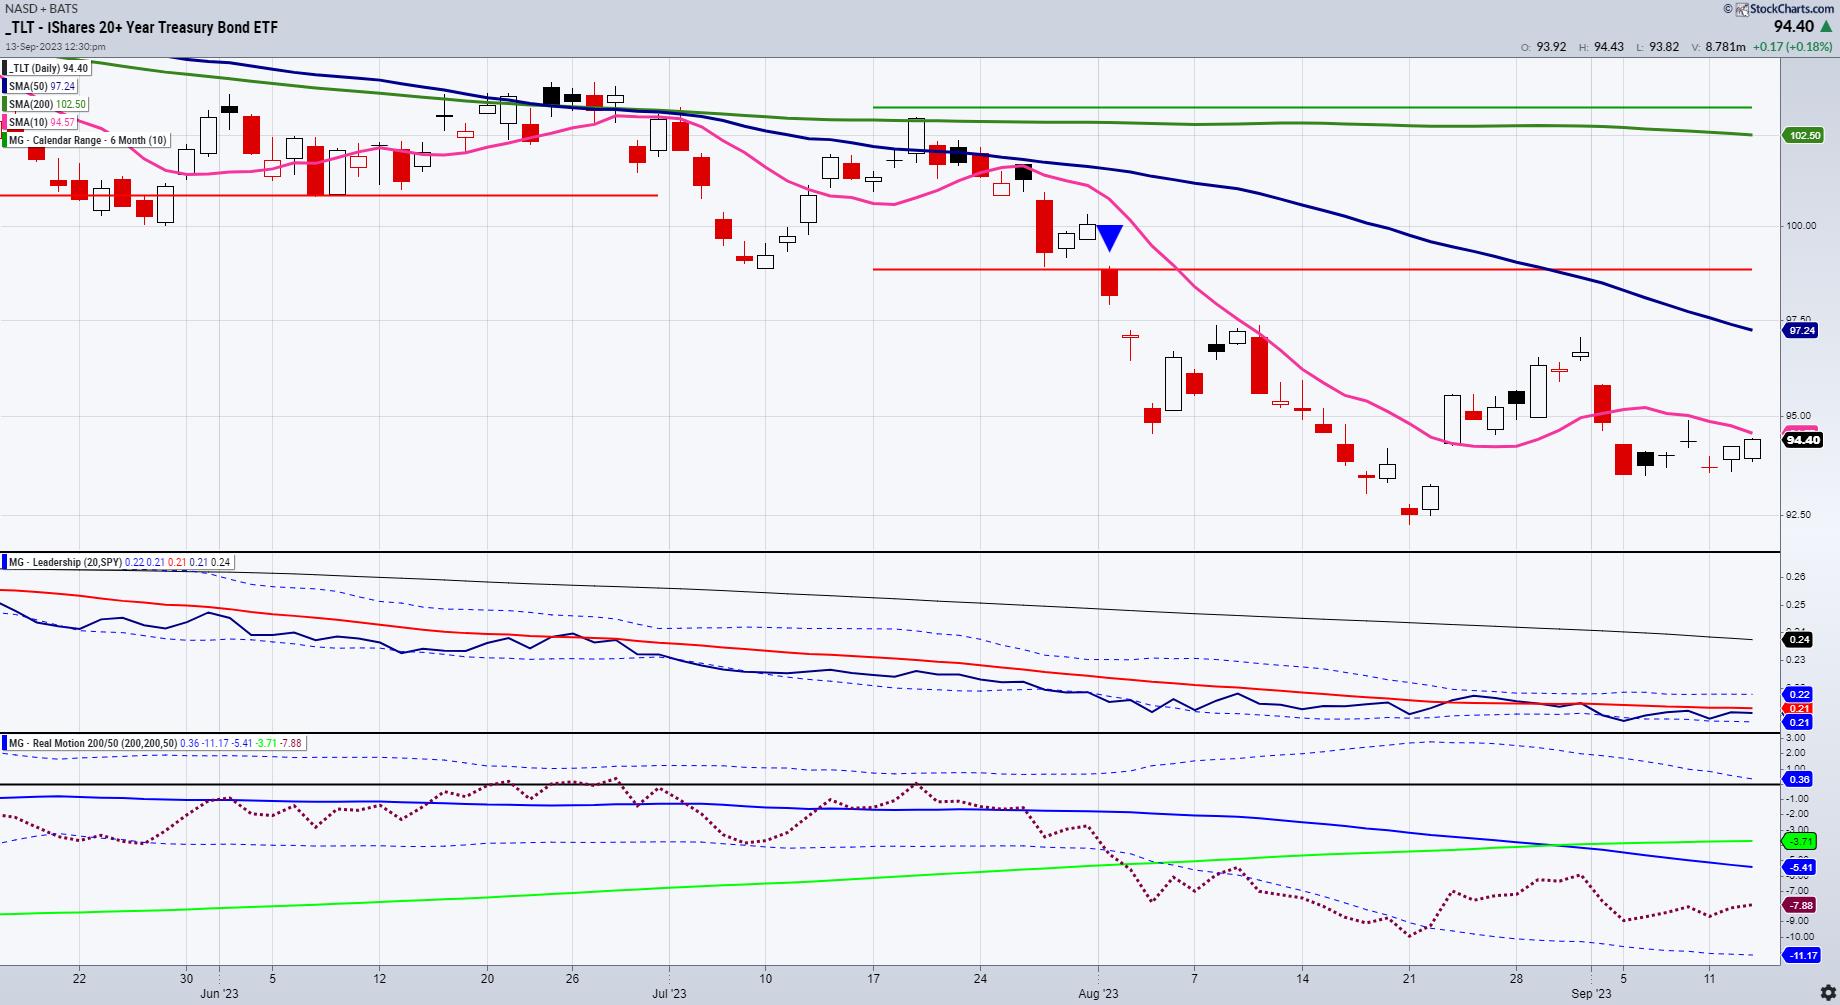
Fresh Look at Long Bonds
I doubt any of our readers are too surprised by the CPI reading coming in a bit hotter than expected.
The bulk of it was in energy costs. Food costs were, mixed with bread and meat, up, while eggs and milk were down. Services inflation was up slightly, while shelter...
READ MORE
MEMBERS ONLY
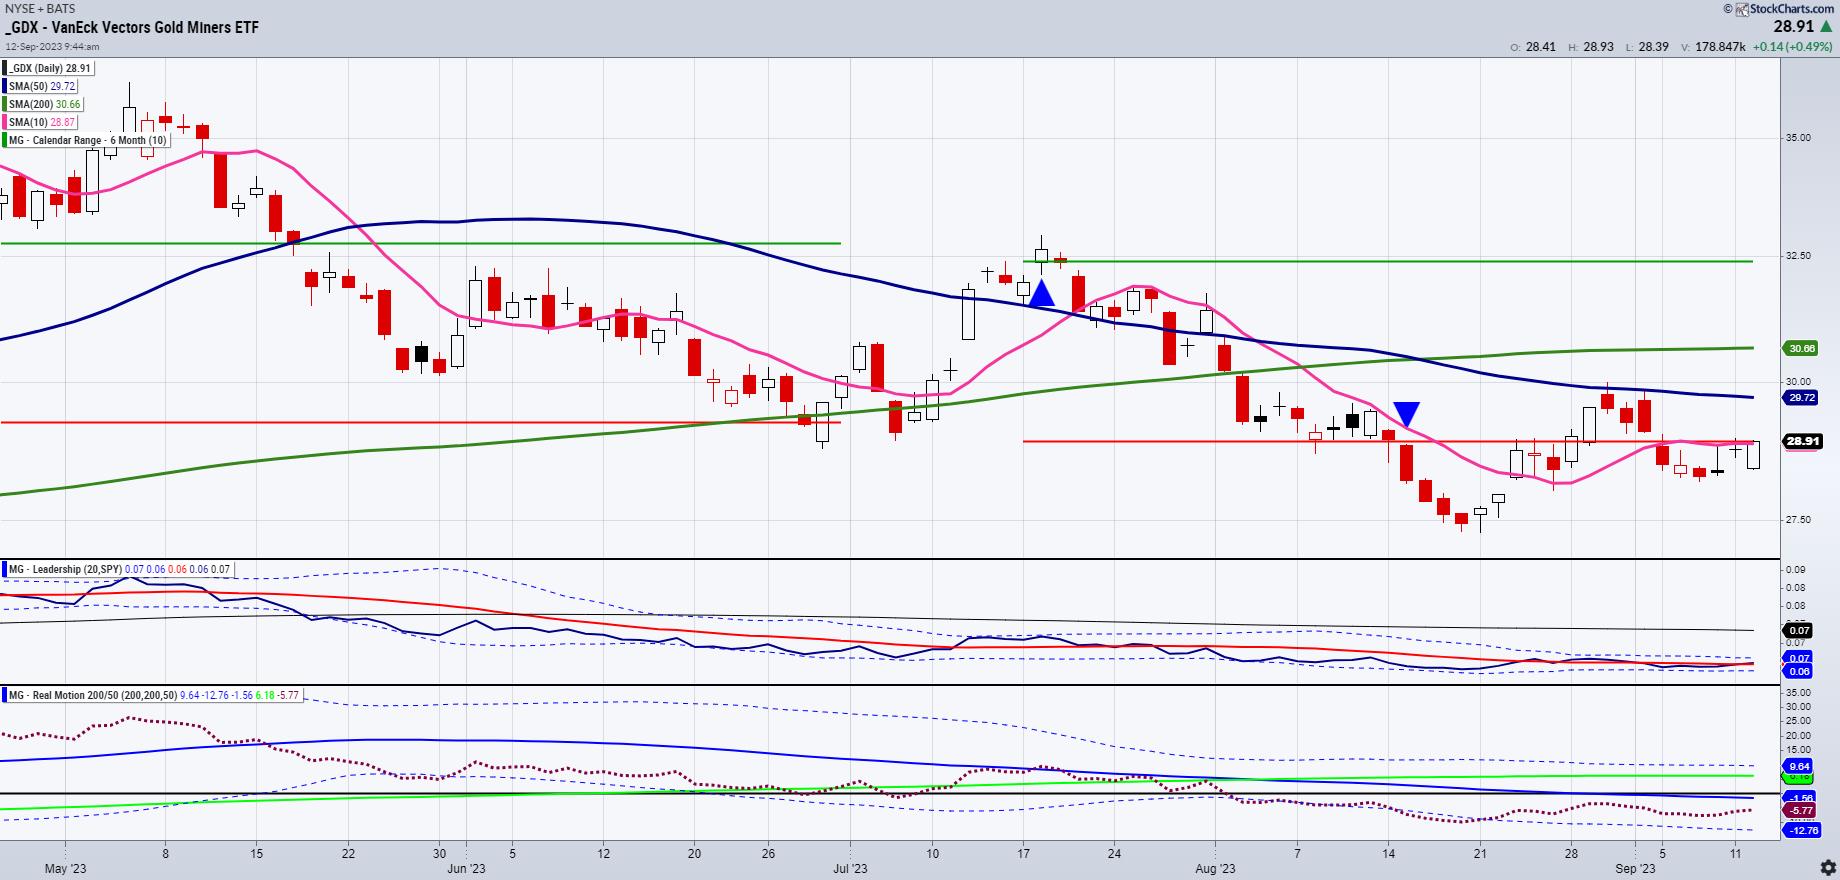
Finding and Trading Instrument Bottoms
In June, we wrote about the bottom in oil and cannabis through USO and MSOS (ETFs) respectively. In July, we wrote about the potential top in NASDAQ and SPY. In August, we wrote about the importance of the retail sector; XRT is below the July calendar range and a major...
READ MORE
MEMBERS ONLY
The Bull Case for Commodities
by David Keller,
President and Chief Strategist, Sierra Alpha Research
In this edition of StockCharts TV'sThe Final Bar, David Cox, CFA CMT of Raymond James reviews underperformance for defensive sectors like Utilities and describes why commodities should be an area of focus for investors. Host David Keller, CMT reviews today's drop in ORCL and AAPL as...
READ MORE
MEMBERS ONLY

Don't Even Think About Investing Without Addressing These 10 Essentials (Part 1: Essentials #1 - #5)

by Gatis Roze,
Author, "Tensile Trading"
We investors are frequently guilty of hearing only what we want to hear. The justification often being "that doesn't apply to me." Or my other favorite line, "Oh, I don't do that." In my previous blog — a tribute to William J. O&...
READ MORE
MEMBERS ONLY

Larry's LIVE "Family Gathering" Webinar Airs THIS WEEK - Thursday, September 14th at 3:00pm EDT!
by Larry Williams,
Veteran Investor and Author
Larry is going LIVE! Don't miss the upcoming "Family Gathering" webinar with Larry Williams, airing live through Zoom this Thursday, September 14th at 3:00pm EDT.
In this must-see event, Larry will be presenting his current opinions on a broad variety of current market topics, directly...
READ MORE
MEMBERS ONLY

DP Trading Room: Can Tech's Bullish Bias Hold?

by Erin Swenlin,
Vice President, DecisionPoint.com
by Carl Swenlin,
President and Founder, DecisionPoint.com
In this week's edition of The DecisionPoint Trading Room, Carl reviews the markets and shares the new DecisionPoint BIAS assessment list. Erin concentrates on Technology (XLK) and Utilities (XLU). Technology is only sector holding a bullish bias in the intermediate and long terms, will that hold up? Utilities...
READ MORE
MEMBERS ONLY

When Facing a Market Pullback, RUN THESE SCANS!
by David Keller,
President and Chief Strategist, Sierra Alpha Research
In this edition of StockCharts TV'sThe Final Bar, Dave recaps a big up day for TSLA and bearish engulfing pattern for energy stocks. He answers viewer questions on growth stocks during rising rate environment and shares two scans to identify potential opportunities during corrective periods.
This video originally...
READ MORE
MEMBERS ONLY

Called It! The Drop in AAPL Before the Bell

by TG Watkins,
Director of Stocks, Simpler Trading
On this week's edition of Moxie Indicator Minutes, TG presents a perfect example of what it is like being in the Moxie trading room, and the benefits the subscribers get from my trading methodology. TG was able to point out that AAPL was most likely going to pullback,...
READ MORE
MEMBERS ONLY
StyleButtons: The Key to an Optimized Charting Process! Here's How I Use ‘Em
by Grayson Roze,
Chief Strategist, StockCharts.com
On this week's edition of StockCharts TV'sStockCharts in Focus, Grayson shares one of the simplest yet most effective ways to streamline and enhance your charting routines on the SharpCharts workbench: StyleButtons. By assigning your favorite "ChartStyles" (chart templates that include all of the indicators,...
READ MORE
MEMBERS ONLY
MEM TV: Major Tech Group Turns Negative
by Mary Ellen McGonagle,
President, MEM Investment Research
In this episode of StockCharts TV'sThe MEM Edge, Mary Ellen McGonagle reviews the weakness in the broader markets while highlighting bright spots amid base breakouts. She also shares best ways to prepare your watch list and why the Dow Industrial Index outperformed.
This video originally premiered September 8,...
READ MORE
MEMBERS ONLY
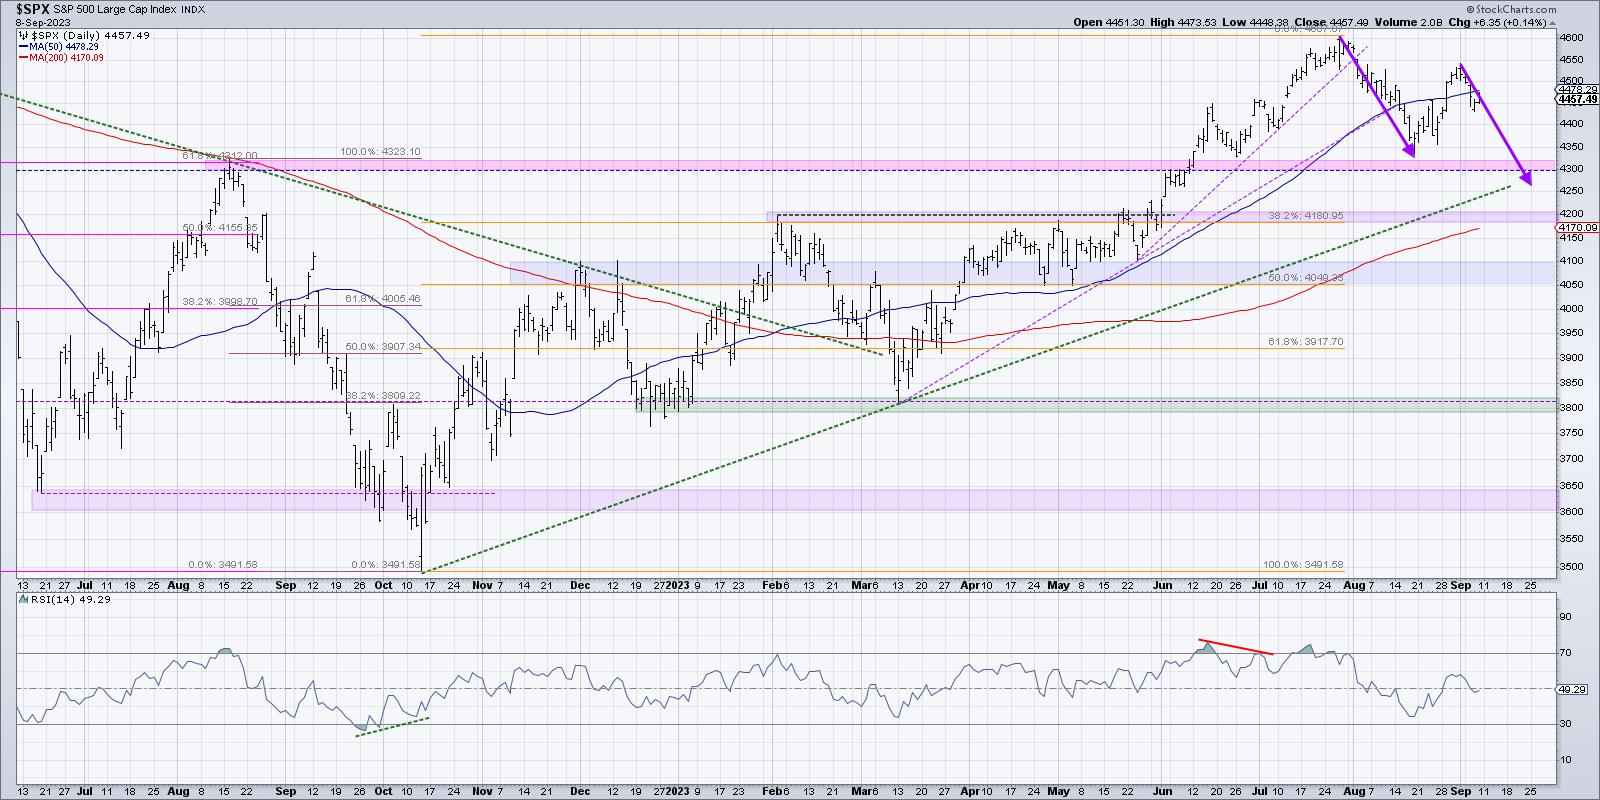
Which is More Likely -- SPX Over 4600 or Below 4200?
by David Keller,
President and Chief Strategist, Sierra Alpha Research
KEY TAKEAWAYS
* Top investors use probabilistic analysis to think through different scenarios to determine which appears the most likely.
* By thinking through each of four potential future paths for the S&P 500, we can be better prepared for whichever scenario actually plays out in the coming weeks.
We...
READ MORE
MEMBERS ONLY
BONDS & CASH - But Can We Find Better Income Alternatives?
by David Keller,
President and Chief Strategist, Sierra Alpha Research
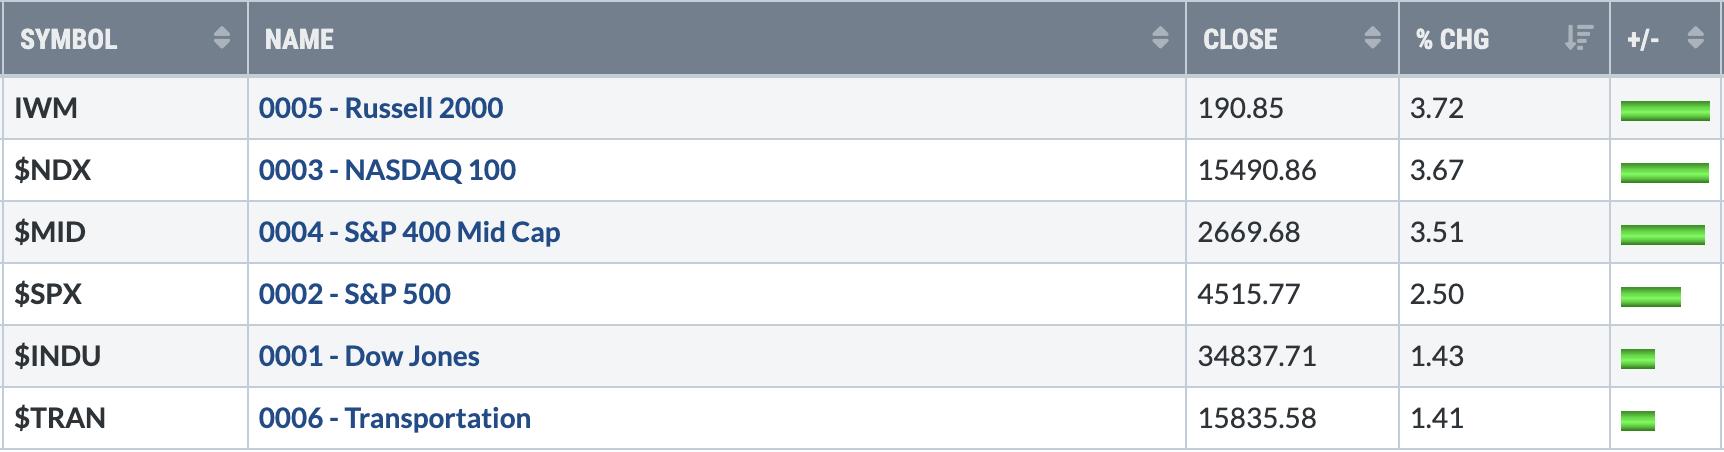
In this edition of StockCharts TV'sThe Final Bar, Dave wraps the week with a focus on weakening breadth conditions, the Russell 2000 and underperformance of small caps, and strong energy stocks driven by stronger crude oil prices. He answers viewer questions on using ETFs instead of bonds or...
READ MORE
MEMBERS ONLY

Can the Windowmaker Natural Gas Resuscitate?
Probably the worst or at least one of the worst performers in the overall market and in the commodities market, natural gas is choppy and lifeless. So why write about it?
For starters, we love an underdog. Perhaps a bit too contrarian, as the reasons for the decline in natural...
READ MORE
MEMBERS ONLY
Optimizing Your Stock Selection With the Williams True Seasonal Indicator
by Karl Montevirgen,
The StockCharts Insider
KEY TAKEAWAYS
* The Williams True Seasonal is a unique tool that detects stocks via seasonality patterns
* The Williams True Seasonal indicator differs from other seasonality indicators in that it provides greater accuracy by tweaking the way it uses data
* The main benefit in using the Williams True Seasonal indicator is...
READ MORE
MEMBERS ONLY

Crucial Insights: How Rising Rates IMPACT You!
by David Keller,
President and Chief Strategist, Sierra Alpha Research
In this edition of StockCharts TV'sThe Final Bar, guest Willie Delwiche, CMT, CFA of Hi Mount Research outlines the long-term uptrend in interest rates and shares two sectors to focus on given the rising rate environment. Host David Keller, CMT tracks the sharp pullback for semiconductors and breaks...
READ MORE
MEMBERS ONLY

How to Identify Great Trade Opportunities Using the MACD Zero Line

by Joe Rabil,
President, Rabil Stock Research
On this week's edition of Stock Talk with Joe Rabil, Joe explains the importance of the MACD Zero line. First, he discusses what the zero line is and why it is significant. Then, Joe shows how it can identify great trade opportunities when used in multiple timeframes. Joe...
READ MORE
MEMBERS ONLY

Energy Stocks in the Spotlight: A Look at Diamondback Energy

by Jayanthi Gopalakrishnan,
Director of Site Content, StockCharts.com
KEY TAKEAWAYS
* Energy stocks are in focus as US crude oil prices continue rising higher
* Oil prices have more room to rise but if prices go too high there may be demand pressures
* Diamondback Energy is getting close to its 52-week high
With Labor Day weekend behind us, it'...
READ MORE
MEMBERS ONLY
Small-Caps Take BIG Plunge in Risk-Off Move
by David Keller,
President and Chief Strategist, Sierra Alpha Research
In this edition of StockCharts TV'sThe Final Bar, Dave notes severe weakness in the small-cap space as the Russell 2000 forms a potential head-and-shoulders topping pattern. He answers viewer questions on index volume, Coppock curves and running oscillators on breadth indicators.
This video originally premiered on September 5,...
READ MORE
MEMBERS ONLY
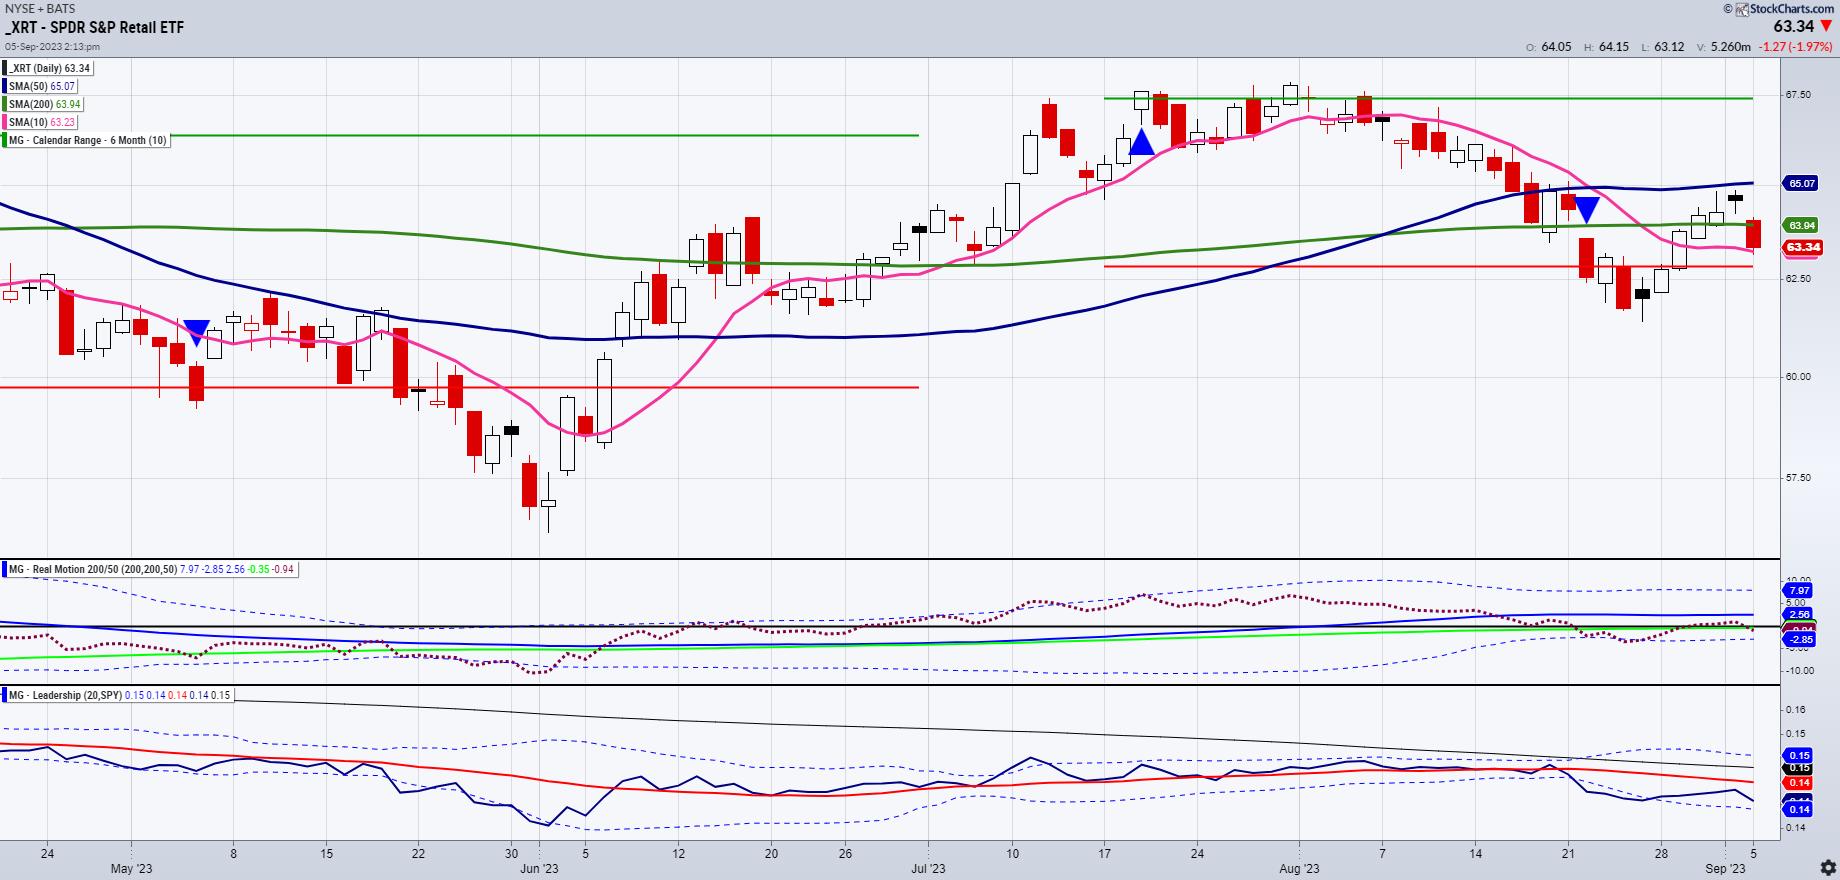
It's Really All About the Retail Sector Now
This entire year, retail, as measured by the ETF XRT (a.k.a. the Granny of the Economic Modern Family), has underperformed the SPY and QQQs. Encumbered by higher interest rates, higher oil prices, higher inflation, higher insurance costs, and a burgeoning credit card debt, we have wondered many times...
READ MORE
MEMBERS ONLY
Top 10 Charts to Watch, September 2023
by David Keller,
President and Chief Strategist, Sierra Alpha Research
by Grayson Roze,
Chief Strategist, StockCharts.com
In this edition of StockCharts TV'sThe Final Bar, Dave and Grayson co-host a special presentation, wherein they unveil the top 10 charts that are poised to shape the landscape of September 2023.
This video originally premiered on September 4, 2023. Watch on our dedicated Final Bar pageon StockCharts...
READ MORE
MEMBERS ONLY
Here's My Latest View of Current Market Action

by Tom Bowley,
Chief Market Strategist, EarningsBeats.com
Hello to all my StockCharts supporters! First of all, thank you for your readership of my Trading Places blog, which is now in its 8th year. Also, thanks to all of you that watch my Trading Places LIVE shows that air on Tuesdays, Wednesdays, and Thursdays at 9:00am ET....
READ MORE
MEMBERS ONLY
Seasonality versus Simply Market Timing

by Arthur Hill,
Chief Technical Strategist, TrendInvestorPro.com
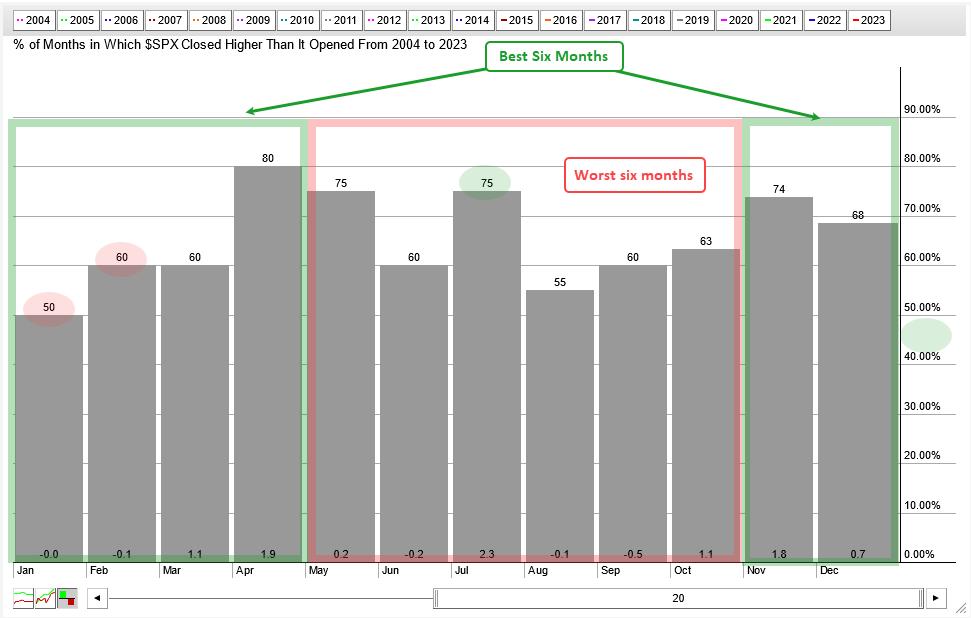
There is some validity to the best six months strategy, but investors would probably be better off with a simple timing tool. According to the Stock Trader's Almanac, the best six-month period runs from November to April. The worst six-month period runs from May to October. This is...
READ MORE
MEMBERS ONLY
Three Ways I Use RSI To Analyze Trends
by David Keller,
President and Chief Strategist, Sierra Alpha Research
KEY TAKEAWAYS
* Momentum indicators like RSI can indicate overbought and oversold conditions, suggesting a short-term reversal.
* A bearish divergence, with higher prices and a lower RSI, often occur at the end of a bullish phase.
* By analyzing the range of the RSI, investors can confirm the overall trend phase and...
READ MORE
MEMBERS ONLY
Bottom-Up Stock Picking Made Easy with This Automated Scanning Set-Up
by Grayson Roze,
Chief Strategist, StockCharts.com
On this week's edition of StockCharts TV'sStockCharts in Focus, Grayson walks you through a "bottom-up" stock-picking approach that he uses daily on StockCharts, which helps him find the strongest stocks and best technical setups out there in the market. Learn how to customize your...
READ MORE
MEMBERS ONLY

Focus on Stocks: September 2023
by Larry Williams,
Veteran Investor and Author
Cycle Deep Dive
At times, it seems there are as many cycles as there are traders. I have been focusing on the shorter-term ones, those ranging from 2 to 5 years.
Recently, I pondered on the clear fact that cycle forecasts work far better to spot market bottoms than tops....
READ MORE
