MEMBERS ONLY

S&P 500 Needs One Key Ingredient for Bottom

by Tom Bowley,
Chief Market Strategist, EarningsBeats.com
The Dow Industrials, Nasdaq 100, and Russell 2000 reached a 10% correction, and the S&P 500 is getting close. Volatility is elevated, and the Technology sector closed below a key support level. Tom Bowley breaks it all down using easy-to-digest charts....
READ MORE
MEMBERS ONLY

Before You Buy the Dip, Look at These 3 Charts

by Jayanthi Gopalakrishnan,
Director of Site Content, StockCharts.com
The major stock market indexes are under pressure. Learn what the charts say now, which support levels matter, and why caution still makes sense for investors....
READ MORE
MEMBERS ONLY

These Sectors Are Leading but the Market Is at a Turning Point

by Joe Rabil,
President, Rabil Stock Research
Joe Rabil highlights leading sectors and explains why oversold areas like tech and financials could see a bounce. He also reviews sentiment, volatility, and key support levels as the market approaches a potential turning point....
READ MORE
MEMBERS ONLY

Time for an Easter Rally?

by Martin Pring,
President, Pring Research
The recent stock market pullback may be hitting a floor. Discover which oversold indicators Martin Pring is monitoring for the next big trend reversal....
READ MORE
MEMBERS ONLY

S&P 500 Pullbacks Are Changing. What’s Different Now?

by Frank Cappelleri,
Founder & President, CappThesis, LLC
S&P 500 pullbacks are starting to behave differently following a confirmed breakdown and rising volatility. Frank Cappelleri explains what’s changed, what signals are weakening, and what needs to happen next....
READ MORE
MEMBERS ONLY

Are Sentiment Indicators Bearish Enough to Be Bullish?

by David Keller,
President and Chief Strategist, Sierra Alpha Research
Sentiment has turned more bearish, but is it bearish enough to signal a market low? Join Dave Keller as he reviews the VIX, AAII survey, NAAIM exposure, and put/call ratios to show why conditions may not be extreme just yet....
READ MORE
MEMBERS ONLY
This Pullback May Be Setting Up the Next Move Higher
by Joe Rabil,
President, Rabil Stock Research
A market pullback with improving sentiment may be setting up the next move higher. Follow along as Joe Rabil highlights key signals and stocks showing constructive setups....
READ MORE
MEMBERS ONLY

Not Even Rising Fear Can Crack This Market
by Tom Bowley,
Chief Market Strategist, EarningsBeats.com
Fear is rising across markets as volatility spikes and headlines pile up. In this video, Tom Bowley explains why key accumulation signals and improving growth leadership suggest buyers are still supporting this market....
READ MORE
MEMBERS ONLY

Pullback Playbook: Buy the Dip When Everyone Else Panics

by Tony Zhang,
Chief Strategist, OptionsPlay
Tony Zhang explains how to identify real dip-buying opportunities during market panic using a data-driven pullback filter. Learn a structured framework for recognizing when volatility may be creating a reversal setup....
READ MORE
MEMBERS ONLY
S&P 500 Pullbacks Keep Getting Bought. Why?
by Frank Cappelleri,
Founder & President, CappThesis, LLC
S&P 500 pullbacks keep attracting buyers, even as momentum signals weaken. Join Frank Cappelleri as he explains why dip-buying continues to support the market in spite of rising volatility and mixed technical signals....
READ MORE
MEMBERS ONLY
Rising Oil Prices, Rising Fear — What the Charts Are Showing Now

by Mary Ellen McGonagle,
President, MEM Investment Research
Rising oil prices and geopolitical tensions pushed volatility higher as the S&P 500 tested key support levels. Mary Ellen McGonagle analyzes what the charts reveal about inflation fears, sector weakness, and the few pockets of strength emerging in this volatile market....
READ MORE
MEMBERS ONLY
A Market in Transition: Navigating Volatility and Rising Macro Risk
by Mary Ellen McGonagle,
President, MEM Investment Research
Rising oil prices are increasing investor fear. We're seeing a broad risk-off shift across institutional portfolios. Here's what you can expect, going forward. ...
READ MORE
MEMBERS ONLY

Stocks Wobble as Oil Spikes: What the Charts Are Telling Investors
by Jayanthi Gopalakrishnan,
Director of Site Content, StockCharts.com
The stock market turned volatile as oil prices surged. Here's what the charts are telling investors about the market's next move....
READ MORE
MEMBERS ONLY
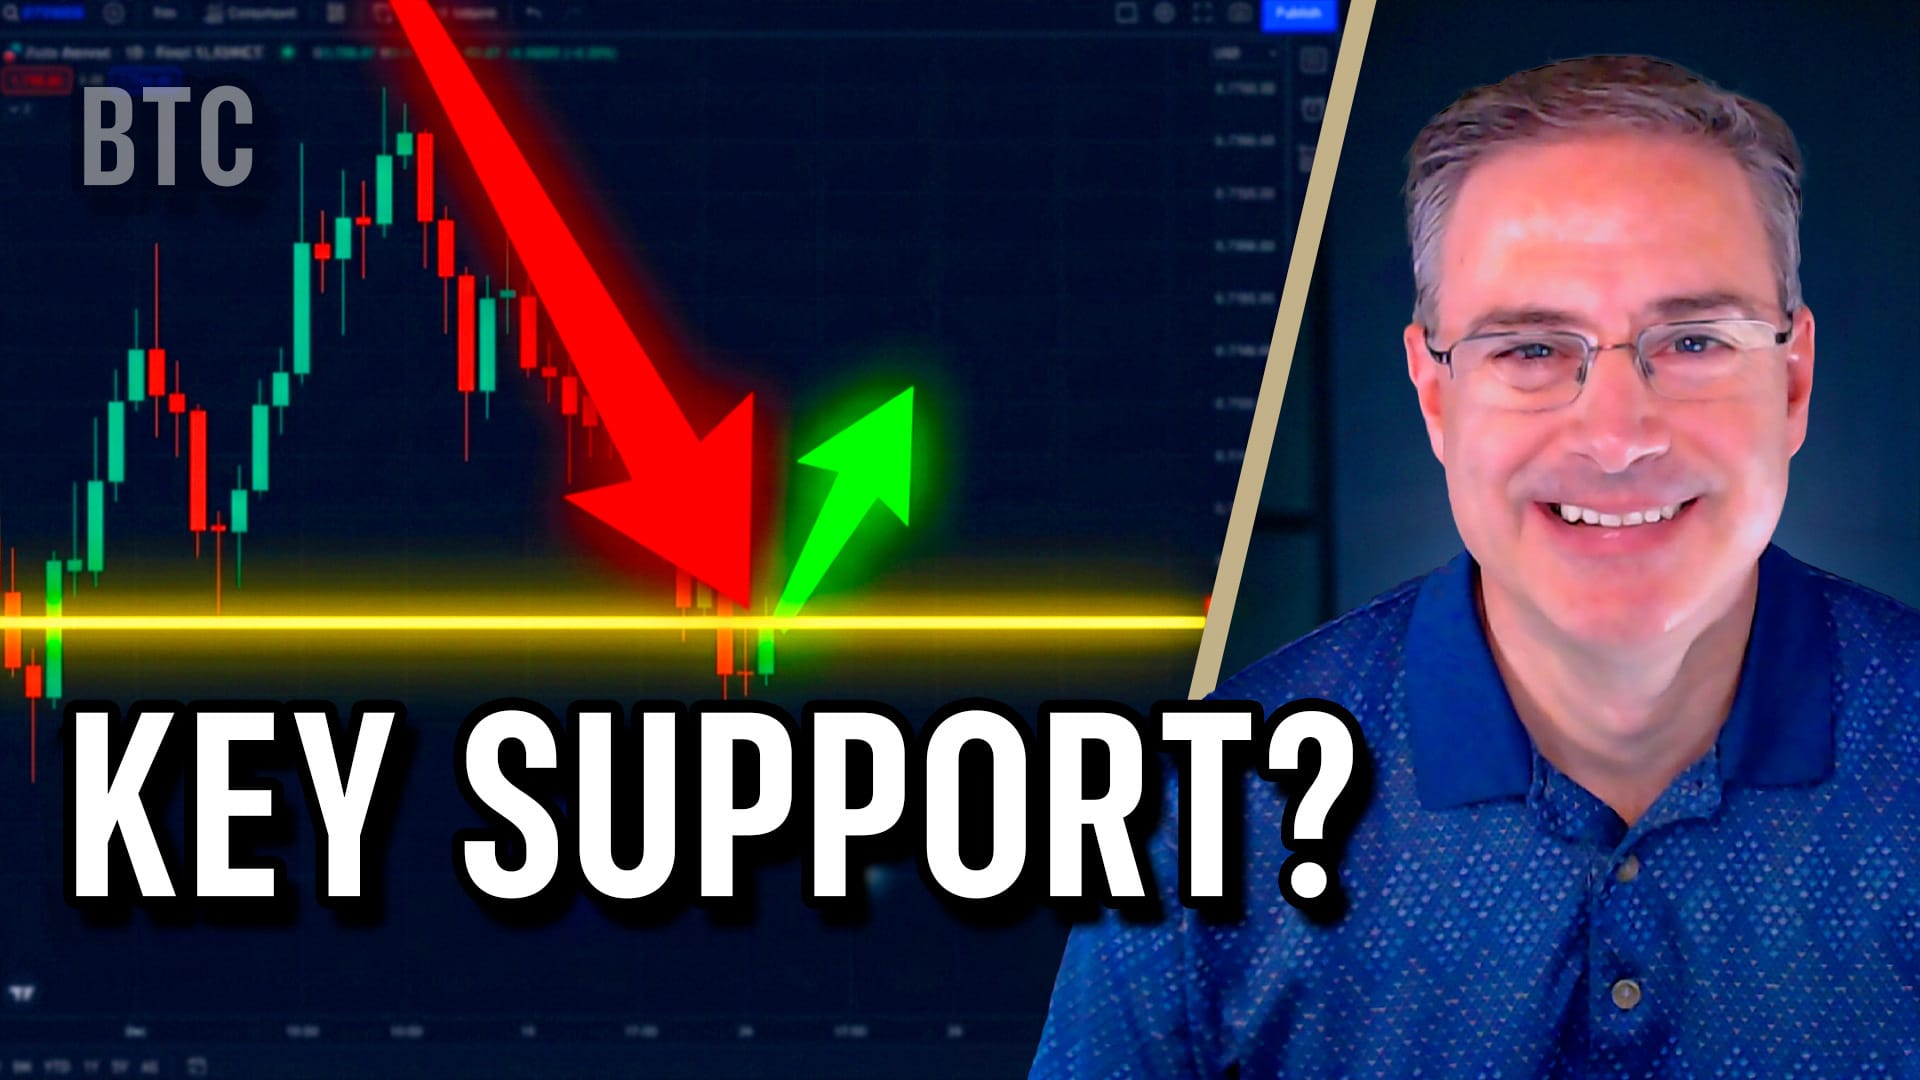
Bitcoin at Key Support — Is an Interim Low Forming?
by Joe Rabil,
President, Rabil Stock Research
Joe Rabil explains why Bitcoin is sitting at key support near a major retracement level and what would confirm an interim low. He also reviews SPY volatility, sentiment, ADX conditions, and several stock setups....
READ MORE
MEMBERS ONLY

Week Ahead: NIFTY Slated for A Strong Start; Close Above This Level Needed for Trending Move

by Milan Vaishnav,
Founder and Technical Analyst, EquityResearch.asia and ChartWizard.ae
The Nifty continues to consolidate just below a crucial resistance band while maintaining a broader uptrend. What would be needed to for it break out?...
READ MORE
MEMBERS ONLY

VIX Near 20: Is the Stock Market Entering the Danger Zone?
With several event catalysts now within the 30-day VIX window, it's time to ask: Does the market have a volatility problem? Mike Zaccardi breaks down the charts and assesses the danger....
READ MORE
MEMBERS ONLY

Week Ahead: Nifty Near a Tactical Inflection Point
by Milan Vaishnav,
Founder and Technical Analyst, EquityResearch.asia and ChartWizard.ae
After a week of heightened volatility, the Nifty ended the week with gains and a positive broader trend. What will it take to reassert upside momentum -- or a correction?...
READ MORE
MEMBERS ONLY
AI Infrastructure Is Leading — Not the Headlines!
by Mary Ellen McGonagle,
President, MEM Investment Research
Mary Ellen McGonagle breaks down why AI infrastructure continues to lead even as headline tech stocks struggle with earnings volatility. She highlights where capital is flowing under the surface and why long-term demand themes are holding up against short-term noise....
READ MORE
MEMBERS ONLY

As Fear Rises, Cracks Are Forming Beneath the Market!
by Tom Bowley,
Chief Market Strategist, EarningsBeats.com
Markets are testing key support levels as volatility rises and growth stocks come under pressure. Tom Bowley breaks down the cracks forming beneath the surface and what they may signal in the weeks ahead....
READ MORE
MEMBERS ONLY
These Low ADX and Price Patterns Could Lead to the Next Breakouts!
by Joe Rabil,
President, Rabil Stock Research
Joe Rabil of Rabil Stock Research breaks down how low ADX and price patterns can signal emerging breakout setups. He also reviews SPY market conditions, rising bullish sentiment, and some recent symbol requests....
READ MORE
MEMBERS ONLY

Ignore the Headlines — This Is Where the Money Is Going!
by Tom Bowley,
Chief Market Strategist, EarningsBeats.com
Markets were mixed last week, but Tom Bowley explains why the real story isn’t in the headlines. He breaks down where money is rotating right now — and why those early-January signals matter more than index levels....
READ MORE
MEMBERS ONLY
Market Risk Is Rising — But These Stocks Look Better on Pullbacks
by Joe Rabil,
President, Rabil Stock Research
Joe Rabil of Rabil Stock Research explains why a pullback could create better stock opportunities, even as overall market risk rises. From there, he reviews SPY conditions, volatility, sentiment, and recent symbol requests....
READ MORE
MEMBERS ONLY

A Year of Market Fear — and Resilience: Breaking Down the VIX in 2025
Revisit the major volatility catalysts of 2025 to gain insight into what new ones could be in store next year....
READ MORE
MEMBERS ONLY
2025 Market Recap & 2026 Outlook: Trends, Psychology, and What Comes Next

by Grayson Roze,
Chief Strategist, StockCharts.com
by David Keller,
President and Chief Strategist, Sierra Alpha Research
Grayson and Dave give their year-end thoughts about the wild market action of 2025, what worked (or not) for traders over the course of the year, and what lessons to take for 2026. ...
READ MORE
MEMBERS ONLY

The Year-End Macro Marathon: Why Every Data Point Matters & Where to Look
The StockCharts Sample Gallery contains charts of economic data, such as unemployment rate, inflation, and mortgage rates. Calm bond and mortgage markets could offer a potential tailwind as we head into 2026....
READ MORE
MEMBERS ONLY

The Market’s Stuck in Neutral: What Could Break the Standstill?
by Jayanthi Gopalakrishnan,
Director of Site Content, StockCharts.com
The stock market churned but went nowhere this week as breadth held steady and rate-cut odds shifted. Here's what investors should watch next week....
READ MORE
MEMBERS ONLY

Market Pullback or Pause? Inside the November Dip and What Comes Next for Stocks
Intermarket relationships between stocks, bonds, the US dollar, and commodities are unsettled at the moment. What happens next? Here are the charts investors should be watching for clues....
READ MORE
MEMBERS ONLY

The Market's Muscle: What Broad Tech Strength Says About This Bull Run
by Jayanthi Gopalakrishnan,
Director of Site Content, StockCharts.com
Mega-cap tech stocks powered markets higher, but strength across the sector shows this rally is strong. Learn how to track it with these charts....
READ MORE
MEMBERS ONLY

Year-End Rally Watch: How Sector Rotation Is Fueling the Bull Case
It's a market-moving week with the FOMC meeting, mega-cap earnings, and global trade headlines taking place. These tools will help you keep track of sector rotation, yield trends, and the next potential leg of the rally....
READ MORE
MEMBERS ONLY

Week Ahead: NIFTY Stays Above Crucial Supports; Prolonged Complacency in the Markets Remains a Concern
by Milan Vaishnav,
Founder and Technical Analyst, EquityResearch.asia and ChartWizard.ae
The Nifty is consolidating with a slightly positive bias. Here's an analysis of the index and a look at sector performance....
READ MORE
MEMBERS ONLY

Jackson Hole 2025: Investors Stay Calm as Bond Volatility Hits Lows
Despite rising inflation pressures and fresh Fed minutes, Treasury volatility and credit spreads remain near multi-year lows ahead of Powell’s speech....
READ MORE